
Abstract
This paper assesses the state of inward foreign direct investment (IFDI) and outward foreign direct investment (OFDI), as well as the direct and spatial impact of China’s Belt and Road Initiatives (BRI) on FDI and the degree of coordination synergy between IFDI and OFDI at the provincial level. The paper uses a discontinuous and spatial regression analysis covering 30 Chinese provinces between 2007 and 2019. The results suggest that China’s IFDI and OFDI development has achieved moderate coordination synergy over time. At the provincial level, the BRI has a positive direct impact on IFDI, OFDI and foreign investment coordination synergy. This indicates that with the BRI, China is able to improve OFDI flows and achieve better synergy in foreign investment coordination achieving a more balanced investment development path. Interestingly, the growth of OFDI at the provincial level also had a positive spatial spillover effect, while IFDI displaces domestic investment, the growth of OFDI is able to mitigate the displacement effects. However, the positive effect of BRI was only significant in the eastern region and not in the central and western regions. This indicates the heterogeneous nature of BRI effects, which limits the effectiveness of BRI in promoting FDI growth in China and its coordination synergy as an ambitious global policy.
Plain Language Summary
China’s Belt and Road Initiative (BRI) is a global development strategy that aims to improve trade and investment connections between China and other countries. This study examines how the BRI affects China’s foreign investment—both the money China invests in other countries and the money other countries invest in China. It also looks at how well these investments work together to create economic benefits. The findings show that the BRI has increased both China’s outward investment (money China invests abroad) and inward investment (money flowing into China). It has helped build stronger economic ties between China and participating countries, making investment more coordinated and efficient. However, there are also challenges, such as political risks and financial uncertainties, that can affect these investments. This research helps policymakers, businesses, and investors understand how the BRI shapes China’s investment landscape. By improving investment cooperation, the BRI can create new economic opportunities, but careful planning is needed to manage risks and maximize benefits.
Introduction
Foreign direct investment (FDI) has long been recognized as a critical driver of global economic growth, with its liberalization fostering cross-border capital flows and industrial integration (Kumari et al., 2023; Suhrab et al., 2025; Zhao et al., 2024). China’s experience with FDI—both inward FDI (IFDI) and outward FDI(OFDI)—offers a compelling case study. In the early 1980s, developed countries began to invest in China to gain market advantage (C. Chen et al., 1995; Gallagher, 2002), reduce costs through internalization (Buckley & Casson, 2016), and transfer marginal industries (Kojima, 1977). As a result, IFDI flows increase in China (Azarhoushang et al., 2023; Gao, 2023), contributing to economic development (Karahan & Çolak, 2024; Lv et al., 2025; Wu et al., 2020). Similarly, China also aims to improve its OFDI as a strategy to internationalize its industries and capture more global market share. As a result, China aims to achieve its ambitious globalization goals through the Belt and Road Initiatives (BRI), where FDI is an important channel for China’s economic globalization and stable development.
Examining China’s IFDI and OFDI reveals an interesting trend: with China’s accession to the WTO in 2001, OFDI began to rise and surpassed IFDI in 2014. However, if the investment development path (IDP) theory is correct, China’s OFDI should have caught up by 2009, when its GNI (Gross National Income) per capita was above USD 4,750. China’s deliberate action in September and October 2013, when it proposed the BRI, which aims to build a community of shared prosperity, would have had an impact on OFDI and IFDI. By 2024, more than 150 countries and 30 international organizations have joined or participated in the BRI. The BRI has enormous potential to improve infrastructure, regional development, connectivity and promote sustainable transformation of countries along the route (Madni, 2023). In addition, the BRI is likely to have a significant impact on the global economy (Chishti et al., 2025; Shurong et al., 2024; Zhai, 2018) and the Chinese economy(Kong et al., 2021; C. Wang et al., 2025; Yeung & Huber, 2024). In 2024, China’s industry-wide OFDI totaled 1159.27 billion yuan, a year-on-year growth of 11.3%, while China’s IFDI amounted to 826.25 billion yuan, a year-on-year decrease of 27.1%. Meanwhile, China is the country with the highest foreign capital inflows and has maintained its status as the second-largest foreign capital exporter in the world.
Despite the BRI’s prominence, existing literature on its impact on two-way FDI remains limited. Most studies focus narrowly on either OFDI (J. Chen et al., 2025; Razzaq et al., 2021; H. Yao et al., 2023; Y. Zhang et al., 2024) or IFDI in isolation, neglecting their coordinated development and synergistic effects. Against this backdrop, this paper aims to address three integrated research objectives and questions: first, to measure the coordinated development of two-way FDI across China’s 30 provinces (autonomous regions, municipalities) using the Coordinated Synergy Index (CSI), guided by the question of what the current state of coordinated development of IFDI and OFDI is at the provincial level in China; second, to evaluate the BRI’s impact on this coordination at the provincial level, driven by the question of whether the BRI significantly affects the coordinated development of two-way FDI across China’s provinces; third, to analyze spatial spillovers and regional heterogeneity in these effects (to provide insights for targeted policy design), with the underlying question of whether the BRI’s effects on two-way FDI coordination vary across regions and whether there are significant spatial spillover effects between provinces. To achieve these objectives, we employ a regression discontinuity design (RDD) to identify the causal impact of the BRI. RDD is particularly suited to this context, as it addresses endogeneity concerns by leveraging the BRI’s clear 2013 launch timeline as a discontinuity point, isolating policy effects from pre-existing economic conditions. Complementing this, spatial econometric techniques are used to capture cross-provincial spillover effects, aligning with the BRI’s focus on regional connectivity.
This paper contributes to and extends our knowledge in the following ways. First, the coordinated development of two-way FDI measured by the CSI is crucial for understanding the stable development of China’s economy, especially the degree of coordinated development of two-way FDI in China at the provincial level for policymakers. Second, evaluating the role of policy interventions such as the BRI would verify their impact on China, especially with a more robust evaluation using a discontinuous regression design that avoids the problems of endogeneity and provides more precise policy effects. Understanding the spatial spillover effects and regional heterogeneity of BRI would provide more knowledge about the indirect effects of BRI on investment portfolios. Overall, the results would be important for understanding the current state of the coordinated development of two-way FDI in China and the broad policy implications of BRI.
The remainder of this paper is organized as follows. Methodology discusses the existing literature on the relationship between China’s IFDI and OFDI to provide the theoretical basis for this study. Results and Discussion describes the research methodology, while Conclusions and Implications discusses the findings of the study. The final section concludes the study.
Literature Review
This section critically reviews the existing literature on the BRI’s impact on FDI and the IDP theory, with a focus on identifying gaps in understanding the coordination synergy between IFDI and OFDI, particularly in the context of China.
The BRI and Its Heterogeneous Impacts on IFDI and OFDI
With China’s growing ambitions and burgeoning global aspirations (Yuan, 2023), in September and October 2013, the Chinese government proposed the “Silk Road Economic Belt” and the “21st Century Maritime Silk Road.” The BRI aims to promote the orderly and free flow of economic factors, the efficient allocation of resources, the deep integration of the market and the coordination of economic policies between the countries along the route (Y. Zhang et al., 2024). In addition, the BRI focuses on deepening cooperation with countries along the route in five areas, including policy coordination, infrastructure connectivity, trade facilitation, financial integration, and people-to-people bonds (Parepa, 2020; Yang et al., 2024). While its strategic significance is widely acknowledged—from deploying foreign exchange reserves (Swaine, 2015) and expanding geopolitical influence through the Asian Infrastructure Investment Bank (AIIB) (H. Yu, 2017) to reshaping global multipolarity through enhanced trade, security cooperation, and comprehensive foreign policy initiatives (De Lombaerde et al., 2024; Moradi Haghighi & Augustín, 2025)—scholars remain divided on its actual effects on FDI, reflecting methodological differences, varying sample periods, and heterogeneous geographic scopes.
BRI and OFDI: Contested Evidence
Scholarship on the BRI’s impact on China’s OFDI reveals significant inconsistencies, reflecting methodological and contextual variations. On one side, H. Yao et al. (2023) find that high-level political and economic cooperation under the BRI boosts China’s OFDI, particularly in countries with bilateral investment treaties (S. Li et al., 2024; Q. Wang & Liu, 2022; J. Zhou & Lin, 2025). M. X. Chen and Lin (2020) quantify this effect, estimating that BRI-participating countries receive 5% more OFDI from China than non-participants, while Mao et al. (2023) highlight the initiative’s role in “greening” OFDI, with spillover effects on host-country productivity (Ashraf, 2024; Azarhoushang et al., 2023; Bach et al., 2025; Qiu et al., 2022) and global value chain positioning (He et al., 2021; S. Li et al., 2024; Moradi Haghighi & Augustín, 2025). These studies align with broader claims of a positive BRI-OFDI link S. Yu et al. (2019) and Khan et al. (2023).
On the other side, Nugent and Lu (2021) find no statistically significant impact of the BRI on China’s OFDI in participating countries, a result echoed by (Oberhauser, 2024), who frames BRI-driven OFDI as a “double-edged sword” that is constrained by host-country sentiment—particularly concerns over political infiltration or labor market disruptions (Aryal, 2021; Himaz, 2021). This divide underscores a critical gap: existing research focuses on whether the BRI affects OFDI, but not how it interacts with IFDI to shape coordinated FDI dynamics.
BRI and IFDI: A Neglected Dimension
In contrast to OFDI, research on the BRI’s impact on China’s IFDI is scarce. While W. Liu and Dunford (2016) note that BRI-driven trade facilitation could attract foreign capital, and Luo et al. (2019) document a divergence in provincial IFDI—with “node provinces” attracting more foreign investment than non-nodes—these analyses are descriptive, lacking systematic exploration of causal mechanisms. This omission is striking: the BRI’s emphasis on trade liberalization (W. Liu & Dunford, 2016) and financial integration (Łasak & Van der Linden, 2019) should theoretically influence IFDI inflows, yet no study connects these policies to IFDI-OFDI coordination.
Provincial dynamics exacerbate this gap. China’s regions respond to the BRI unevenly: northwest provinces focus on Central Asia (Kahraman & Özcan, 2025; Siddiqui, 2019), southwest regions on ASEAN (Y. Li et al., 2025; Summers, 2021; Y. Wang & Tao, 2024), and eastern areas on the Greater Bay Area (S. Guo, 2021; Steenhagen & Hou, 2025; L. Zhou et al., 2023). Despite these variations, no research examines how subnational BRI implementation shapes the coordination of IFDI and OFDI across regions—a critical oversight given documented regional FDI disparities (Luo et al., 2019).
IDP Theory and the Coordination Synergy of IFDI and OFDI
The IDP theory of Dunning (1981) posits that a country’s IFDI and OFDI evolve dynamically with its economic development: from net IFDI dependence (low-income stages) to balanced or net OFDI (high-income stages). This framework has been widely tested, but debates persist over the drivers of IFDI-OFDI interactions and their relevance to emerging economies like China.
Ambiguous IFDI-OFDI Interactions
Scholars identify two competing mechanisms linking IFDI and OFDI: spillover effects, where the growth of IFDI can promote the technological upgrading of a host country’s firms and generate spillover effects (Barboza et al., 2025; R. Guo et al., 2021; Tan et al., 2023). Host country firms can also improve their productivity by absorbing the technological spillover effects of IFDI (Ombuki et al., 2025; Spithoven & Merlevede, 2023), thus promoting their OFDI activity (Gao, 2023); and competition effects, where foreign firms displace domestic counterparts (Shen et al., 2021; Sugiharti et al., 2022) or poach talent (Belderbos et al., 2025; Farndale et al., 2022; Sheldon & Li, 2013), inhibiting OFDI.
Empirically, these effects vary by context: Borda Reyes et al. (2019) find industry heterogeneity (positive in services, negative in manufacturing), while J. Chen et al. (2020) note stronger positive IFDI-OFDI links in developed provinces, weakening over time. Notably, however, no study explores how policy interventions like the BRI mediate these dynamics—despite evidence that institutions shape FDI interactions (Sawitri & Brennan, 2023; Srofenyoh et al., 2024; J. Zhang et al., 2025).
China’s IDP Anomaly and the BRI’s Unaddressed Role
China’s FDI trajectory challenges standard IDP predictions. The trends in IFDI and OFDI after China’s accession to the WTO in 2001 are interesting. China’s IFDI has increased, and only since 2014 has OFDI increased and surpassed IFDI (see Figure 1). However, if the IDP theory applies, China’s OFDI should have already caught up in 2009 when its income level (GNI per capita) exceeded USD 4,750 (see Figure 2). This phenomenon provides us with an interesting starting point for analyzing the role of the BRI on the IFDI-OFDI coordination synergy.

China’s IFDI and OFDI flows 2002 to 2022.
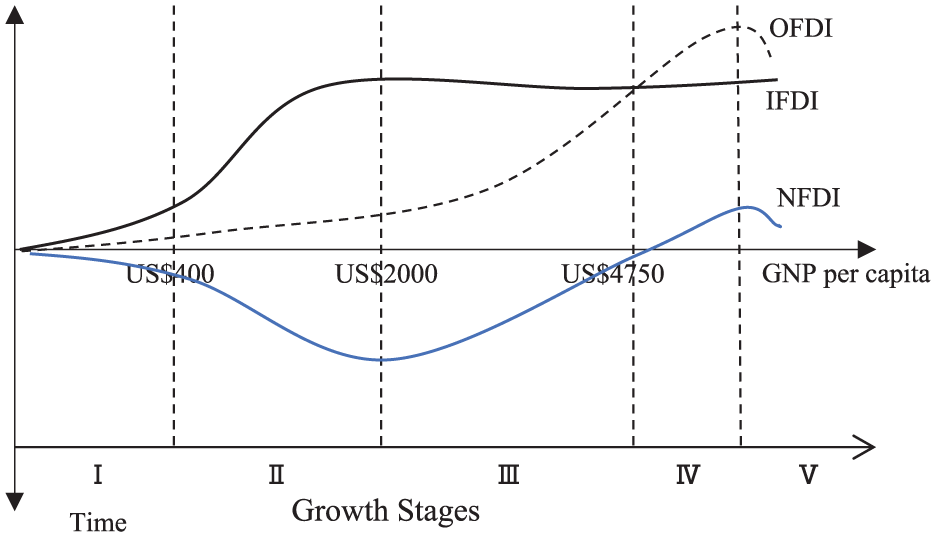
Investment development path theory—investment and economic growth.
Critical to this anomaly is the role of policy. The BRI, launched in 2013, coincided with China’s OFDI surge, yet existing studies rarely link the initiative to IDP stage transitions. Does the BRI accelerate OFDI catch-up by mitigating institutional barriers? Does it enhance IFDI-OFDI coordination by aligning inward and outward investment strategies? These questions remain unanswered.
Coordination and Domestic Investment: A Missing Link
IFDI and OFDI also interact through their effects on domestic investment, a channel understudied in coordination analyses. (Magbondé et al., 2025) argue that IFDI crowds out domestic investment, while OFDI complements it via reverse spillovers (Ge et al., 2025). However, Djokoto et al. (2024) contest this, finding long-term crowding-out by OFDI. For China, where regional DI disparities are stark, understanding how BRI-driven FDI affects domestic investment—and thus IFDI-OFDI synergy—is crucial, yet no study has addressed this.
The literature leaves three critical gaps: existing studies overlook the BRI’s impact on IFDI-OFDI coordination, neglect spatial spillovers of BRI-driven FDI synergy across China’s provinces, and underexplore how the BRI accelerates China’s IDP transition by mediating IFDI-OFDI spillovers. Based on this, this paper integrates the BRI into IDP theory to analyze policy-driven FDI coordination; empirically, it uses RDD and spatial econometrics to identify causal, spatial effects of the BRI on IFDI-OFDI synergy; contextually, it explains China’s two-way FDI lag relative to IDP predictions and the BRI’s role in closing this gap, illuminating policy-driven FDI dynamics in emerging economies. These contributions advance understanding of the BRI’s macro-foundations and China’s two-way FDI system.
Methodology
Data and Variable Measurements
This paper used data from 30 provinces in China from 2007 to 2019 to construct a panel dataset. The data on China’s OFDI comes from the “Statistical Bulletin of China’s Outward Foreign Direct Investment”, while the data on China’s IFDI and other variables come from the “China Trade and External Economic Statistical Yearbook” and the National Bureau of Statistics of China.
The dependent variables, IFDI and OFDI, are measured as follows. InOFDI measures the non-financial OFDI stocks, lnIFDI represents the natural logarithm of provincial IFDI stocks, converted using annual exchange rates. Since the individual provinces do not publish their IFDI stocks, following Hall and Jones (1999) and Rossi (2022), the IFDI stocks are estimated as follows:

First, we estimated the IFDI stocks for 2007. In Eq. (1),

We also use investment coordination synergy between OFDI and IFDI as the dependent variable. Following Sun et al. (2022) and Dong et al. (2025), we measure the coordination synergy index (CSI) using the stock values of IFDI and OFDI based on the coupling coordination model. The specific process is as follows. First, we normalized the OFDI and IFDI values using Eq. (3) as follows:

In Eq. (3), Yij is the stock value of OFDI and IFDI in the j-th year of the i-th province. Maxij and Minij are the maximum and minimum values in the i-th province in the study period (2007-2019), respectively. The value range of uij after normalization is between [0,1]. Second, we calculated the comprehensive development level of OFDI and IFDI as follows.

This model had no sub-indexes other than IFDI (u1) and OFDI (u2). Meanwhile, China’s OFDI and IFDI have similar contributions to the overall provincial development and therefore same weight is assigned to both, as follows.

Thus, the simplified equation for measuring the degree of coupling between OFDI and IFDI in China is as follows.

In Eq. (6), C represents the degree of coupling, and the value range is [0,1]. When the value of C is higher, the degree of coordination between IFDI and OFDI is higher and vice versa. Nevertheless, a higher C cannot distinguish whether OFDI and IFDI coupling is good or bad. For instance, a higher C does not mean China’s OFDI and IFDI have reached coordination; therefore, the estimation uses the coupling coordination model as follows.

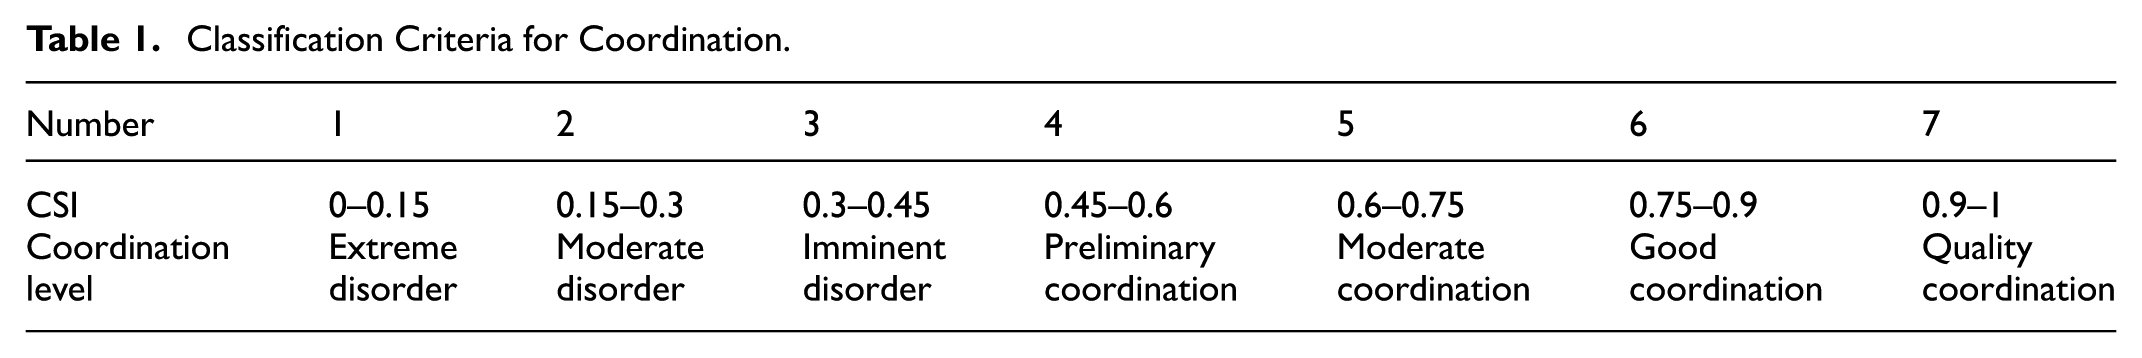
In Eq. (7), CSI represents the coordinated development level of China’s IFDI and OFDI, reflecting the synergy between the two. Considering that China’s IFDI and OFDI are equally important, we take a = b = 0.5. Following the research of Peng et al. (2020), we classify the CSI into seven levels, as shown in Table 1.
Classification Criteria for Coordination.
RD, the core variable of the study, is a dummy variable measuring each province’s responses to the BRI. Due to inconsistencies in the release time of provincial document responses on BRI, we measure it as 1 after each province released the documents for the first time. Otherwise, it is 0. Other control variables include GDP, Technology, Industrial scale, imports and fiscal revenue. GDP measures the real GDP using the GDP deflator with 2007 as the base year. Technology level (Tech), is measured by the volume of patent transactions in each province. Meanwhile, industrial scale (IS) is measured by the number of industrial enterprises in each province. Import (IM) measures the province’s import value converted using the exchange rate for the respective years. Fiscal revenue (FR) is measured by each province’s fiscal revenue. All control variables are in natural logarithms.
Spatial Regression Discontinuity Design—Assessing BRI Impact
This paper uses regression discontinuity design (RDD) to examine the impact of BRI on China’s two-way FDI and its coordinated development. RDD was first used by Thistlethwaite and Campbell (1960) as a method for estimating treatment effects. It uses a discontinuity function that depends on a continuous variable to determine whether the individual sample is subject to policy or project treatment. Time is used as a continuous variable. Since the Chinese government initiated the BRI in 2013, the time of discontinuity was set to 2014, i.e. c = 2014. Since 2014 was set as the time of discontinuity, provinces before 2014 were treated as the control group, and provinces after 2014 were treated as the treated group. In addition, the RDD can take the form of a sharp regression discontinuity (SRD) and a fuzzy regression discontinuity (FRD) (Imbens & Lemieux, 2008; Ramírez Sierra et al., 2024; Y. Wang et al., 2022). As the provinces did not immediately issue relevant documents in response to the BRI in 2013, the FRD is used in this study. Following Hahn et al. (2001) and McCrary (2008), we use the non-parametric FRD. The FRD is generally analyzed using the two-stage least squares (2SLS) method (Deng et al., 2021; Nawaz & Gul, 2022). The settings for the first-stage model are as follows:

The second-stage model setting is as follows,

Considering the possible spatial spillover effect of the BRI and the spatial autocorrelation of OFDI and IFDI, we added a spatial matrix and used the spatial RDD for analysis. The equation was set up as follows:

In Eq. (8) to (10), the dependent variable Yit is provincial OFDI and IFDI and its coordination synergy index, respectively. RD and BRI are dummy variables. W1 and W2 are spatial weight matrices constructed based on IFDI and OFDI. (t−c) is the time difference between the year and the discontinuity point (year c), h(t−c) and f(t−c) is the polynomial function of the time difference. Specifically, for BRI, when the time difference (year c = 2014) is greater than 0, the variable BRI is 1 (the Chinese central government proposes the BRI). Otherwise, the variable BRI is 0; For RD, when the time difference (year c = the year each provincial government issued a policy document on the BRI) is greater than 0, the variable RD is 1 (each provincial government issued a policy document on the BRI). Otherwise, the variable RD is 0 Controls are control variables. ω and ε are error terms.
Spatial Autoregression Test for FDI and Coordination Synergy
Before estimating Eq. (8), it is necessary to assess the spatial autoregression of IFDI, OFDI, and CCID. This paper uses Moran’s I and Geary’s C indexes to test for spatial autocorrelation. When choosing the spatial weight matrix, the adjacent and spatial distance matrices are usually used. However, geographic factors are not the only factors that determine spatial correlation. Therefore, following L. Yao et al. (2021), based on the inverse geographic distance matrix, the IFDI and OFDI were added to construct the economic distance matrix. The specific equations of Moran’s I index, Geary’s C and the economic distance matrix are as follows:


However, Moran’s I index and global Geary’s C index only represent the global spatial autocorrelation but cannot distinguish the degree of local aggregation. Therefore, the Local Moran’s I index was used to analyze the differences between provinces further. The equation is as follows:

In Eq. (11) to (15), W(d) represents the element in the i-th row and j-th column of the spatial weight matrix W, and dij represents the spatial distance between province i and province j,
Results and Discussion
Descriptive Statistics and Spatial Index Analysis
Table 2 reports the descriptive statistics of the individual variables. It shows that the mean value of China’s IFDI is 7.158, which means that the IFDI of each province in China is generally high, while the standard deviation is 1.551, which means that the IFDI of each province varies greatly. This aligns with Q. Zhang (2023), which document substantial regional imbalance in China’s IFDI, driven by historical policy and geographic advantages of coastal regions. The OFDI across provinces also showed a similar trend; the minimum was −1.353, and the maximum was 10.74, which proves this. When analyzing the CSI, it was found that the mean value of CSI was not high at 0.375. Figure 3 shows that the CSI values for China and its regions, i.e. the eastern, central and western regions, generally reflect a progressive trend from 2007 to 2019. Moreover, China reached the preliminary coordination level after 2015 and the moderate coordination level after 2017. Overall, this indicates that China’s IFDI and OFDI have reached a moderate coordination level, and there is still room for China to reach a good or even high-quality coordination level, a finding echoed by Xu et al. (2024), who emphasized that there is an interactive relationship between two-way FD, but there is regional heterogeneity.
Descriptive Statistics.

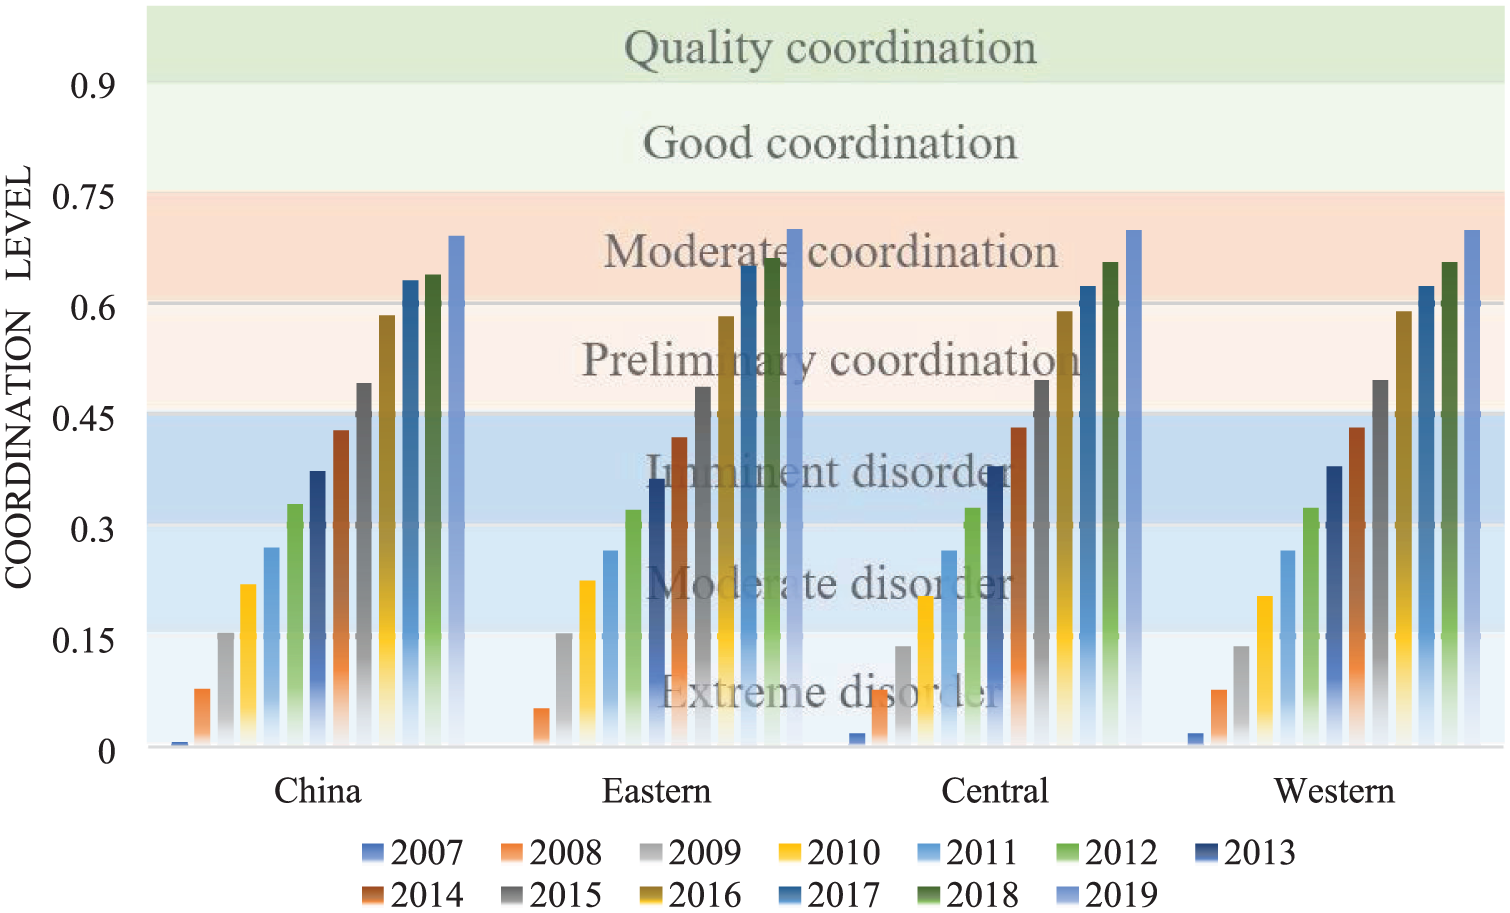
CSI for China and its eastern, central, and western regions.
Table 3 shows the results of the spatial autoregression, which reveals a significant spatial correlation based on Moran’s I and Geary’s C indices for China’s FDI from 2007 to 2019. For CSI, however, there appears to be no significant spatial correlations. As Figure 4 shows, the results of the local Moran’s I index indicate that the provinces with the highest IFDI in China are all located in the southeastern coastal region and are gradually expanding to the central region. In contrast, the provinces with the lowest IFDI were located in the north-west of China. A similar trend was also observed for OFDI in China, with the clustering of OFDI gradually expanding in the southeastern coastal provinces. The province with the lowest OFDI was Qinghai Province, indicating that the OFDI of the surrounding provinces were generally lower than those of other provinces. This aligns with the Ouyang and Yao (2017) and X. Wang and Qi (2020), who argue that coastal provinces’ agglomeration economies attract two-way FDI, reinforcing regional disparities.
Spatial Autocorrelation Test Results.

Note. The spatial autoregressive test was based on the inverse geographic distance matrix W.
p < .01. **p < .05. *p < .1.

Results of local Moran’s I index analysis of IFDI and OFDI in China.
Regression Results—Impact of BRI
Table 4 presents the results of RDD, which show a significant impact of RD, indicating a significant positive effect of BRI in promoting China’s two-way FDI and its coordination synergy. In fact, the impact of BRI (larger RD coefficient) is larger when a better model fit is achieved by adding the control variables. A relative comparison of the impact of BRI on IFDI and OFDI shows that the impact of BRI on OFDI is larger than on IFDI. For instance, the impact of BRI on OFDI was 1.0316, while on IFDI it was 0.5789. This disparity resonates with Razzaq et al. (2022), who argue that stronger institutional quality mitigates an “infrastructure-OFDI curse,” and the curse disappears in the post-BRI period, promoting China’s OFDI into host countries. In contrast, IFDI promotion under the BRI is more indirect, primarily driven by spillover effects from regional integration rather than targeted policy incentives—explaining its relatively weaker coefficient. This pattern validates IDP theory of Dunning (1981), which posits that mature economies transition from net FDI recipients to balanced or net outward investors as their firms accumulate ownership, location, and internalization advantages. Our results suggest the BRI is accelerating this transition in China: by boosting OFDI at a faster pace than IFDI, it narrows the historical gap between inward and outward investment, thereby enhancing their coordination synergy (as reflected in the positive CSI coefficient).
Regression Results—RDD.

Note. The values in brackets are the standard errors of clustering at the provincial level.
p < .01. **p < .05.
Given the significant spatial correlation between IFDI and OFDI, we further estimated the possible spatial spillover effects of BRI using spatial RDD on FDI. Table 5 shows the results where the spatial coefficients of RD were both significantly positive, suggesting that the BRI promotes IFDI and OFDI in the provinces and had positive spatial spillover effects on IFDI and OFDI in the surrounding provinces. This supports the “spatial diffusion” mechanism of BRI (Liao, 2025).
Regression Results—Spatial RDD.

Note. The values in brackets are the standard errors of clustering at the provincial level. Wald test and LR test show that SDM is a reasonable model and does not need to be degenerated into SAR and SEM models.
p < .01. **p < .05. *p < .1.
Interestingly, the growth of OFDI in the province also had a significant positive spatial spillover effect. M. Liu and Qian (2021) worries that this effect may even causes OFDI to exceed the level allowed by economic fundamentals, thereby triggering an irrational OFDI bubble. In contrast, the growth of IFDI in the province has a positive but insignificant spatial spillover effect. One possible reason for this is that IFDI in provinces had a crowding out effect on domestic investment, with one province attracting more IFDI and crowding out domestic investment to surrounding provinces (Denisia, 2010; Jude, 2019; Kurtović et al., 2022). This result led to increased competition between domestic investment and IFDI in the neighboring provinces and thus indirectly inhibited the growth of IFDI in the surrounding provinces. This situation ultimately meant that the growth of IFDI did not have the expected significant positive spatial spillover effect on the surrounding provinces. In addition, for IFDI, economic development, industrial scale and imports could significantly promote IFDI, while technological progress and fiscal revenue were not significant. In contrast, OFDI is significantly promoted by the province, with technological progress and fiscal revenue having a negative impact.
Our results show that the spatial influence on InIFDI is not significant. This could be due to the fact that IFDI competes with domestic investment. To assess this, we conducted an additional evaluation. We further verify the effect of China’s FDI on domestic investment using the spatial autoregressive model. Moran’s I and Geary’s C index of provincial domestic investment suggest a positively significant correlation in all years, and it deem reasonable to use the spatial model. The specific equation is as follows.


In Eqs. (16) to (17), DI represents domestic investment in each province measured by cumulative investment. Equation (16) controls for several variables, including total population, total social consumption, urban road area per capita, number of students in colleges and universities, carbon dioxide emissions, technological progress and tax revenue. In order to avoid endogeneity, technological progress and tax revenue were excluded from equation (17) and investment in industrial environmental protection was added compared to equation (16); the remainder corresponds to equation (16). All the variables were transformed in natural logarithms. νi was the time dummy variable, and
Table 6 reports the impact of FDI on domestic investment. The results indicated that regardless of whether the spatial impact was considered, IFDI had a significant negative impact on domestic investment, indicating that an increase in IFDI would crowd out domestic investment, which is consistent with Poulis et al. (2012) on the competition between foreign and domestic enterprises for resources. This outcome further explained the reason why the positive effect of the autoregressive coefficient of IFDI was not significant (Table 5). This contrasts with OFDI, which has a positive effect on domestic investment, indicating that an increase in OFDI could lead to an increase in domestic investment. Therefore, domestic investment could supplement the investment vacancy created by OFDI, supporting the view that outward investment generates reverse technology spillovers and expands domestic production capacity (Pan et al., 2020).
Regression Results of Two-way FDI on Domestic Investment.

Note. The values in brackets are the standard errors of clustering at the provincial level. The SAR model used an inverse geospatial weight matrix.
p < .01. **p < .05. *p < .1.
The spatial autoregressive coefficient of domestic investment was negative significantly, which means that the growth of domestic investment in a province has a significant negative impact on the surrounding domestic investment. This outcome was also because IFDI-induced crowding in one province intensifies competition for limited resources in adjacent regions. However, OFDI mitigates this effect, as its positive impact on DI reduces inter-provincial competition. This mechanism helps explain why IFDI’s spatial spillover is insignificant: its crowding-out effect offsets potential positive spillovers, a finding not addressed by Younsi et al. (2021) that focuses solely on direct effects.
Robustness Test
The condition for the validity of the RDD estimation was that the running variable (t−c) was not subject to self-selection (Hijzen et al., 2017). Nevertheless, we argue that there is no problem with self-selection because provincial governments do not control the timing of the adoption of the BRI, which is a national-level policy. Second, for the RDD estimation to be valid, it was necessary that the control variables are not significantly affected by the policy dummy variable (RD) (Gonzalez, 2021). Otherwise, it would not be appropriate to attribute all treatment effects to the analyzed policy effects at the time of discontinuity. Therefore, to ensure this, we regress RD on each control variable (acts as dependent variables) to check on the relationship. Table 7 contains the results of the validity test, which show that the coefficients of each control variable were not significant, meaning that each control variable was not significantly affected by the BRI.
Results of the Validity Test.
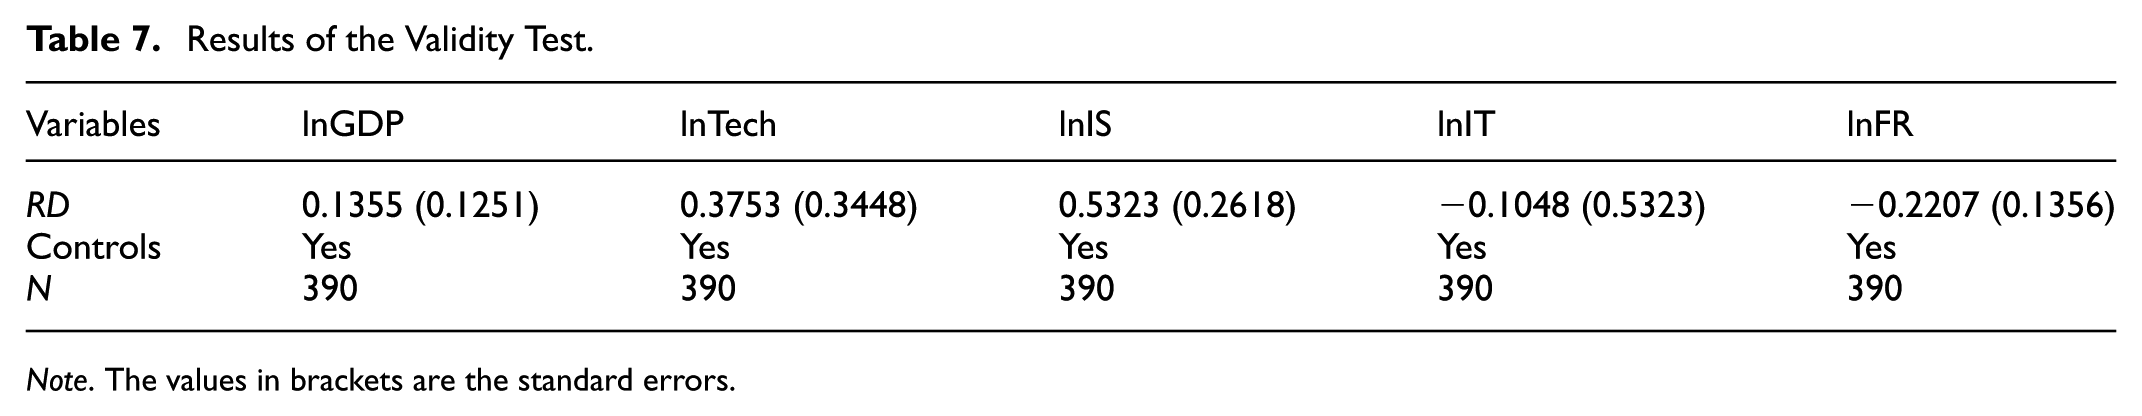
Note. The values in brackets are the standard errors.
Secondly, we check the heterogeneity because China has a huge territory, and the economic development of different regions is very different. In this paper, the sample was divided into eastern, central and western regions to analyze the heterogeneity of the impact of BRI on FDI and its coordinated development. Table 8 presents the results of the heterogeneity analysis, which show that the BRI promoted FDI and coordinated development in the provinces only in the eastern region. However, the expected promotion effect was not seen in the central and western regions.
Results of the Heterogeneity Test.

Note. The values in brackets are the standard errors of clustering at the provincial level.
p < .01. **p < .05. *p < .1.
To further test the credibility of the RDD results, we used three different approaches. First, the stock was replaced by the flows of IFDI and OFDI in China and the coupling coordination index (CSI1) was recalculated. It was then included in the RDD equation, with other control variables unchanged. Secondly, the research period was changed as 2008 to 2018 and 2009 to 2017. Third, for the robustness test of spatial RDD, a spatial weighting matrix was created by changing the calculation method of the spatial distance between the two provinces by squaring the spatial distance. Regardless, subjecting the robustness test, the results showed that the coefficient of the RD remained positively significant (Tables 9 and 10). In addition, it was also found that the coefficients and spatial coefficients of RD were always significantly positive, and the sign of the coefficient and the significance of the autoregressive coefficient α did not change significantly (Table 11). Therefore, it supports our conclusion that BRI is critical for China’s development.
Results of Robustness Test of Flows.

Note. The values in brackets are the standard errors of clustering at the provincial level.
p < .01. *p < .1.
Results of Robustness Test of Different Timing Selection.

Note. The values in brackets are the standard errors of clustering at the provincial level.
p < .01. *p < .1.
Results of Robustness Test on Different Spatial Weight Matrix.

Note. The values in brackets are the standard errors of clustering at the provincial level.
p < .01. **p < .05. *p < .1.
Conclusions and Implications
The aim of this study was to evaluate the impact of BRI on IFDI and OFDI in the Chinese provinces and over time. Specifically, the direct and spatial effects of BRI on China’s FDI and the direct effects on the coordinated development of China’s FDI were analyzed using panel data for 30 provinces in China from 2007 to 2019. The results indicate that the coordinated development of FDI in China’s 30 provinces has reached a moderate level of coordination. However, there is still a significant balance required for China to achieve the level of high-quality level of coordinated development with regard to direct investments. The coordinated development of foreign direct investment in the eastern, central and western regions shows a similar trend to that of China as a whole. In addition, China’s provinces with higher IFDI and OFDI are clustered in the eastern region, while provinces with lower levels are located in the northwestern region.
Secondly, after the implementation of the BRI in 2013, provinces’ bidirectional FDI and their coordinated development level increased significantly. In addition, the BRI had a positive spatial spillover effect on the growth of two-way FDI in China. The direct and spatial positive spillover effects of BRI on OFDI growth were higher than IFDI, facilitating entry into higher levels of IDP theory. Interestingly, the growth of OFDI also had a significant positive spillover effect on the growth of OFDI in the surrounding provinces. In contrast, IFDI growth showed a positive but non-significant effect due to the crowding out of domestic investment by IFDI. The growth of FDI could boost the growth of domestic investment, which would mitigate the crowding-out effect of FDI growth. In addition, China’s two-way FDI could promote each other, and the promotion effect of IFDI on OFDI was greater than that of OFDI on IFDI.
Third, the positive effect of BRI was only significant in the eastern region, while it was not significant in the central and western regions. Indeed, understanding the heterogeneous nature of the policy effect would reveal why the policy was not effective in the central and western regions. This investigation would require an in-depth examination of the effectiveness of the policy, which we will leave to future study. The results of this study were robust despite replicating the estimates using different time periods and proxies. Therefore, Chinese provincial governments should strengthen the formulation and implementation of BRI-related policies to promote FDI growth and the aim for coordinated development. Finally, other factors were also crucial in promoting China’s two-way FDI. For IFDI, economic development, industrial scale, and import trade could significantly promote its growth; for OFDI, technological progress and tax revenue could significantly promote its growth. In addition, economic growth, technological progress, and industrial scale are likely to drive FDI growth further if these factors are significantly improved, as they are currently positive but not significant. Similarly, it is important to understand why technological progress and fiscal revenues have not helped drive IFDI growth. Such an investigation requires further research. To ensure a coordinated two-way development of China’s FDI, China needs to further recognize the limits of policy impact and heterogeneity.
While this study focuses on China, its findings may offer insights for other developing and developed economies, particularly in the context of global investment cooperation and policy-driven development initiatives. For developing countries, especially those participating in the BRI or similar international cooperation frameworks, our results highlight the potential of policy initiatives to stimulate two-way FDI and its spatial spillovers. However, the uneven regional effects observed in China underscore the importance of tailoring policies to local conditions—such as infrastructure endowments, industrial bases, and institutional capacity—to avoid widening internal disparities. For developed economies, the mutually reinforcing relationship between IFDI and OFDI in China suggests that fostering balanced two-way investment could enhance global value chain integration. Additionally, the role of complementary factors (e.g., technological progress, industrial scale) in amplifying FDI effects may inform strategies to leverage foreign investment for sustainable growth.
It is important to note that contextual differences—such as institutional quality, geopolitical dynamics, and stage of economic development—will shape the transferability of these findings. Future cross-country studies could further clarify how policy design and local conditions interact to influence FDI coordination and spillovers in diverse national settings.
Footnotes
Funding
The authors disclosed receipt of the following financial support for the research, authorship, and/or publication of this article: This research was funded by the High-Level Talent Research Start-up Fund of Xiamen City University, supporting the project “The Path and Mechanism of Enterprise Digital Intelligence Transformation on the Coordinated Development of Two-Way FDI.”
Declaration of Conflicting Interests
The authors declared no potential conflicts of interest with respect to the research, authorship, and/or publication of this article.