
Abstract
This study estimates the long-term impact of Chinese RMB exchange rate movements on the trade balance between China and the Eastern African Belt and Road Initiative countries. The Pedroni cointegration analysis and the fully modified and dynamic OLS techniques are applied to the dataset from UNComtrade and China Statistical Yearbook 2019. Some specification novelties are the use of imports and exports as independent variables. By so doing, the paper proposes an alternative measure of the trade balance. We find that the RMB exchange rate movements are stable during the sample period and slightly affect the trade balance between China and the Eastern African BRI countries. Additionally, the study does not find evidence supporting the J-curve effect in China-East Africa trade balance. The empirical results suggest that the Eastern African BRI countries would gain much more trading collectively with China than individually. Therefore, the study strongly recommends that the East African Community accelerate its integration process and establish Export Quotas for trade outside the bloc.
Plain Language Summary
Purpose: estimate the long-term impact of Chinese RMB exchange rate movements on the trade balance between China and the Eastern African Belt and Road Initiative (BRI) countries. Methods: We use the Pedroni cointegration analysis along with the fully modified and dynamic OLS techniques. Conclusions: The RMB exchange rate movements are stable during the sample period and slightly affect the trade balance between China and the Eastern African BRI countries. Limitations: The study uses an experimental approach of assessing the trade balance instead of the traditional approach. The study only investigate the long-term impact of RMB exchange rate movements and does not investigate the short-run impact. The study only applies the model to RMB, slightly applies the model to USD but does not apply the model to significant foreign currencies such as the European Euro and the British Pound.
Introduction
The Chinese government launched the Belt and Road Initiative (BRI) to attain long-term financial growth and increase international collaboration. This project has five key goals: expanding trade flow, fostering policy coordination, improving connectivity, achieving financial integration, and strengthening people-to-people ties (Shang Huping, 2019). While Chinese attractiveness to trade is not solely a function of currency stability and cheap labor costs, it is undeniable that this strategy has significantly affected its exports by terming them less expensive (Zhang & Song, 2001).
Chaisse (2018) asserted that the Belt and Road Initiative could also aid China’s long-term aspirations to globalize its currency, the yuan or RMB, by expanding its use in cross-border transactions. Among the advantages are experts who think that broader currency acceptance will help Chinese government-owned firms trade internationally and reduce the country’s currency risk. Recently, China has taken many initiatives to enhance the yuan’s international use. The initiatives include bilateral swap arrangements between its central bank and other central banks and reserves; making the currency accessible to other countries (Liao & McDowell, 2015). The International Monetary Fund included the yuan in its elite Special Drawing Right basket of commodities in 2016 to acknowledge its rise as a global currency (Gentle, 2016). China’s central bank has also recently improved its foreign payments clearance system, allowing for yuan payments across all regions during regular working hours.
While the literature on the short and long-run effects of RMB exchange rate movements on international trade is numerous, the relationship has only been marginally explored in the case of trade between China and Africa, particularly the East African countries. Some empirical studies on the short and long-run effects of RMB on international trade include Hilland and Devadoss (2013), Jitaru and Dumitrasciuc (2019). The primary purpose of the BRI is to boost trade between China and East Africa and stimulate economic growth, as demoted by De Soyres (2018). However, in international trade, exchange rate movements have always been a major challenge that countries face. Hence, it is essential to understand how the RMB exchange rate movements could affect trade between China and the East African BRI countries, that is, the China-East Africa trade balance. This paper then aims to bridge this gap by providing insights on this topic through empirical studies, as discussed below.
This paper endeavors to answer the following research question: What is the impact of the RMB exchange rate movements on the China-East Africa trade balance? Addressing this critical question would help formulate proper policy for successfully implementing the Belt and Road Initiative.
The contribution of this paper is twofold. To the best of our knowledge, this paper is the first to investigate the issue of Sino-East Africa trade from the perspective of RMB exchange rate movements. While much attention is focused on the effects of exchange rate movements on the US-Sino trade balance (Weber & Shaikh, 2021), the effects of RMB exchange rate movements on China-Africa trade, particularly China-East Africa, have yet to be investigated. Our study then sheds light on the China-East Africa trade balance under the background of RMB internationalization and enriches the literature in this regard. By establishing critical empirical evidence on the long-term effect of RMB exchange rate movements, this study contributes to the literature on exchange rate movements and international trade from the global perspective.
This paper also introduced some novelties in our approach that produced better results than the mixed empirical findings of the effects of exchange rate movements on international trade, as denoted by Broll and Eckwert (1999). Amongst the novelties are the use of Chinese imports and exports rather than the East African countries’ incomes and China’s income. By doing so, this paper also proposes a new alternative measure of the trade balance.
The rest of the paper is structured as follows. Section 2 introduces some empirical studies on the exchange rate and international trade. Section 3 presents and describes the data and variables we used to explore the main question. Section 4 explains the methods adopted. The results from the Pedroni cointegration test, the FMOLS, and the DOLS are presented in Section 5. Section 6 concludes and discusses the different empirical results and formulates policy recommendations.
Empirical Studies and Theoretical Hypotheses
Empirical Studies on the Exchange Rate and Trade
Macroeconomic and international commerce theories have traditionally explained the complex linkages between exchange rates and international trade volumes. A decline or increase in trade flows is related to currency appreciation or devaluation (Cheung et al., 2012). Theoretical and empirical studies support the assumption that exchange rate movements significantly affect macroeconomic metrics, mainly trade flow. Currency depreciation lowers the cost of exports and raises import costs affecting international trade directly and indirectly by boosting the real exchange rate in the foreign exchange market. An increase in the exchange rate, for instance, leads to increased demand for imports and decreased supply of exports (Arize, 1998). Theoretically, when the sum of price elasticities of import and export demand exceeds unity, as Marshall-Lerner denoted, the home currency’s devaluation improves the trade balance. However, this will not happen if there is a huge trade imbalance and fewer exports (Huchet-Bourdon & Korinek, 2011).
McGee et al. (2020) denoted that the effect of exchange rate fluctuation varies greatly depending on the sector and the market’s direction. The exchange rate fluctuations result from the exchange market pressure, which Olanipekun et al. (2019) and Olanipekun and Olasehinde-Williams (2022) found to be also related to economic policy uncertainty in emerging market economies. The US economic policy uncertainty is also found to granger causes exchange market pressure in the panel of African countries, including Egypt, Ethiopia, Ghana, Kenya, Libya, and South Africa (Olasehinde-Williams & Olanipekun, 2022). The authors advocate that the rise in economic policy uncertainty, consumer price index, trade openness, and financial openness increase the severity of the exchange market pressure in the long run. Other international trade economists have also used sectorial data to investigate the influence of exchange rate movements on bilateral international trade (Byrne et al., 2008). They discovered that the exchange rate fluctuation has a robust and negative effect across sectors. For instance, Chowdhury (1993) found that the exchange rate movements could even cause the market participants to change their distribution of goods across the sector. The exchange rate movements are also established in empirical literature to negatively impact trade in the short term (Sercu & Vanhulle, 1992). Subhan et al. (2021) indicate that an overvalued exchange rate had made India’s firms unable to export following the country’s independence.
Cui et al. (2021) point out that because of their multiple sources of information, the exchange rate has long been a touchy subject in international trading. First, the exchange rate is an endogenous variable determined by a complex combination of macroeconomic, monetary, and trade drivers (Devereux et al., 2004). On the other hand, currency movement is an exogenous variable in the economic model. Second, the uncertainty and costs associated with exchange rate fluctuations may affect a single trading partner. Asymmetric costs are often imposed on the actual economy by deviations from the equilibrium and volatility, depending on the types of trading partners and economies. According to empirical evidence, international trade and monetary interactions have experienced more than one phase of tension throughout history. The most recent financial upheaval denoted the exchange rate is a transmission belt of economic instability and monetary and quantitative easing (Aloui, 2021).
All over the first decades of the twenty-first century, and in the wake of the global economic crisis in 2008, the argument concerning exchange rates and their influence on trade switched from price volatility to appreciation or devaluation and currency mismatch. Currency and trade misalignments have two significant direct implications for international trade. The first is price indications, which can directly affect trading patterns. The second is currency mismatch, which impacts investment decisions and creates a resource shift between non-tradable and competitive economic sectors (Ramírez-Rondán, 2019). On the other hand, these direct consequences depend on various elements that Keynesian economics has helped to identify. Prices are entirely flexible in the long run, according to neoclassical economics. At the same time, trade balance is different in the short run since prices in the economy require time to respond to any new policy. It is established that the exchange rates can affect the market value and allocation of resources between marketable and non-competitive products and international trade flow (Willett, 1986). As a result, nominal devaluation of the domestic currency leads to real exchange rate depreciation, implying that imported products are more expensive for consumers who purchase domestic items (Bahmani-Oskooee & Miteza, 2002).
Currency depreciation, on the contrary, promotes domestic industries to import less. This means that currency depreciation leads imports to decrease and exports to increase (Alexander, 1952). Several researchers have found specific, consistent trends in the connection between exchange rate fluctuations, misalignment, and trade flows. Exchange rates are linked to export and import volumes through pricing trade items (Wilson & Takacs, 1979). If export prices are fixed in local currency, the impact of currency devaluation will be reflected in lower export prices assessed in the exchange rate. Researchers from the London Business School investigated the relationship between exchange rates and exports and imports. They indicate that exchange rate appreciation negatively affects Chinese manufacturing enterprises’ export prospects, which are weaker in sectors whose inputs are imported in larger quantities. A devaluation and depreciation of the home currency increase economic activity by raising the trade balance relative to domestic items. The flow of foreign commodities shifted, increasing domestic goods, which helps maintain the trade balance while also meeting increased demand in the economy. As a result, currency devaluation lowers export prices and increases import prices.
Some researchers have also looked into the global link between the exchange rate and regional trade. They investigated two primary issues: the influence of exchange rate instability on trade flows (Ketenci & Uz, 2011) and the effect of exchange rate mismatch on export performance (Sauer & Bohara, 2001). Exchange rate fluctuation, as a result, has a detrimental influence on trade, as denoted by Yu et al. (2019). They claimed that multiple factors, including the availability of hedging tools, the structure of production, and the degree of integration between countries, determine the impact. On the other hand, they discovered that exchange rate imbalances had a short-run influence regarding price rigidities
Further research has indicated that exchange rate movements negatively impact international trade in East Asia (Hayakawa & Kimura, 2009). Because the electronic component is the region’s largest trading good, exchange rate movements mainly affect high-tech and moderate exports (Thorbecke, 2008). Using monthly data from January 2001 to May 2020, Alam et al. (2020) found that oil prices are negatively related to the actual exchange rate between the dollar and rupee in the long term but positively related in the short term.
Numerous empirical studies have also investigated the impact of exchange rate movements on international trade in Sub-Saharan Africa, focusing much on CFA and non-CFA countries (Omojimite & Akpokodje, 2010). The authors concluded that the exchange rate movements have a more significant impact on non-CFA countries. One possible explanation is with Adam et al. (2001), who argued that the institutions of the CFA zone might have succeeded in reducing inflation. This has induced a misalignment of the real exchange rate in those countries. However, empirical literature pointed out that the CFA zone countries suffer frequent shocks in their terms of trade (Sissoko & Dibooglu, 2006). A flexible exchange rate could lessen the costs of these external shocks considering that the CFA zone countries adopted the fixed exchange rate regime with the Euro. (Devarajan & Rodrik, 1992). Regarding the exchange rate regimes, Güngör et al. (2019) found that the level of financial development for a given country determines its choice of foreign exchange rate regime.
Compared to the CFA countries in West and Central Africa, the literature on the impact of exchange rates on trade in East Africa is very limited. This might give some importance to our study. Among the few existing pieces of literature, Hunegnaw and Kim (2020) suggest that the real exchange rate depreciation positively affects the trade balances of two sectors, manufacturing and mining, while hurting the agricultural sector.
This paper analyzes the impact of exchange rate movements on the trade balance between China and Eastern African BRI countries, filling a significant literature vacuum. First, China’s trade surplus has continued to rise dramatically since the exchange rate reform in 2005, raising widespread suspicions of currency manipulation in the international community (Staiger & Sykes, 2010). The feasibility of a J-curve outcome concerning China and its BRI trading partners in East Africa is investigated. For that, we admit the J-curve effect as an interim rather than a long-run impact.
For decades, researchers have tested the J-curve phenomenon in developed countries. However, only one study has investigated the issue in African nations (Bahmani-Oskooee & Arize, 2020). For the first time in the literature, the same authors also assessed the J-curve phenomenon in the bilateral trade balance between Africa and the US (Bahmani-Oskooee & Arize, 2019). Our paper investigates that phenomenon in the China-East Africa trade balance through the impact of RMB exchange rate movements, which makes our paper the first in this regard. The long-term effect of exchange rate movements on the trade balance between China and its main African trading partners has received little attention in the past literature. This work uses the panel cointegration analysis, the fully modified OLS, and the dynamics OLS techniques to explore this critical issue. The study’s findings help determine the influence of RMB exchange rate movements among the Eastern African Belt and Road Initiative countries.
Given the above literature, we posit two hypotheses:
China-Africa Trade Patterns and Trend
Over recent years, the Belt and Road Initiative, which includes 46 African countries, has changed the shape of China-Africa trade, making China the continent’s largest trading partner. For instance, the total value of China-Africa trade in 2019 was USD 192 billion, compared to USD 185 billion in 2018 and USD 11.53 billion in 2002. Between 2002 and 2019, the value of China-Africa trade has meaningfully increased by 1565%.
Figure 1 displays the trend of China-Africa Trade from 2002 to 2019.
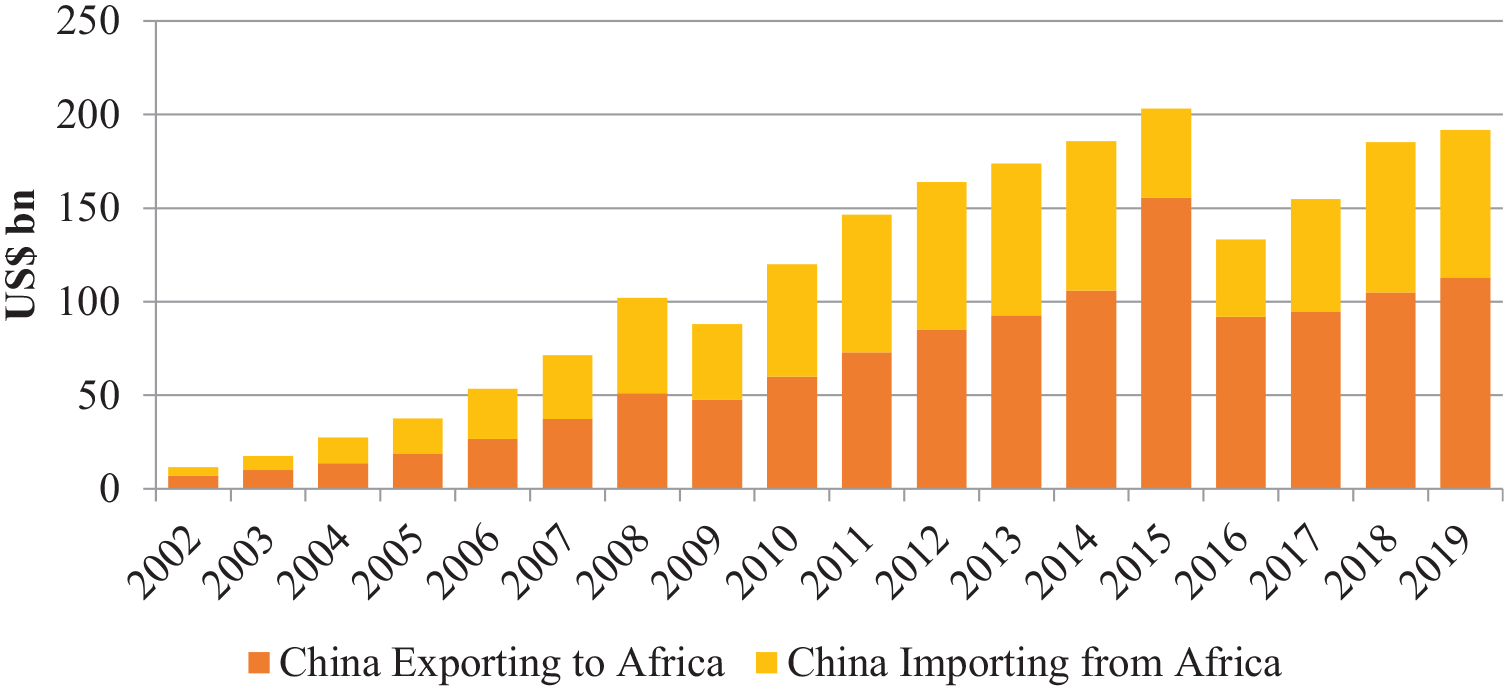
China-Africa trade (2002–2019).
In 2019, the total value of China’s exports to Africa was USD 113.05 billion compared to USD 104.95 billion in 2018. This value was only USD 6.92 billion in 2002, representing an increase of USD 106.13 billion in China’s exports to Africa between 2002 and 2019. China’s imports from Africa increased by USD 74.07 billion within the same period, from USD 4.61 billion in 2002 to USD 78.68 billion in 2019.
In 2019, the total value of Angola’s exports to China was USD 23.30 billion, making it the largest exporter to China from Africa, followed by South Africa with USD 9.6 billion and Congo with USD 5.93 billion. In 2002, Sudan was the largest exporter to China from Africa with USD 1.16 billion, followed by Angola with USD 1.08 billion, and South Africa with USD 450 million. Therefore, between 2002 and 2019, Angola dramatically boosted its exports to China by 2,057%. However, the volume of Chinese goods and services exported to Angola has experienced a dramatic increase. From USD 61.31 million in 2002, Angola imported USD 20.57 billion worth of Chinese goods in 2019, an increase of 3,556% over the same period. Figure 2 shows the evolution of the U.S-Africa trade and China-Africa trade.

U.S.-Africa trade versus China-Africa trade (2002–2019).
In 2008 the value of China-Africa bilateral trade had reached for the first time, U.S.-Africa bilateral trade, and was set to USD 102 billion, of which USD 51 billion for imports and USD 51 billion for exports. Since then, the value of China-Africa trade has been steadily increasing and has even been four-time the value of U.S.-Africa bilateral trade in 2015. In that year, the value of the China-Africa trade was USD 203 billion, while the value of the U.S.-Africa trade was USD 52 billion.
Between 2016 and 2019, the value of the China-Africa trade has been three times higher than the value of the U.S.-Africa trade for the same period. One of the key characteristics of U.S.-Africa bilateral trade is that since 2002, the U.S. has been importing more goods from Africa than exporting to Africa. At the same time, China has been exporting more goods to Africa than importing from Africa. As a result, between 2002 and 2019, the total value of goods imported by the U.S. from Africa was USD 904 billion, compared to USD 879 billion for China. And the total value of goods exported by the U.S. to Africa was USD 423 billion, compared to USD 1189 billion for China for the same period.
The African exporting nations have an aggregate positive trade balance of USD 481 billion with the U.S. and an aggregate negative trade balance of USD 310 billion with China for 2002 to 2019. While African exporting nations recorded a positive trade balance annually with the U.S. since 2002, the trend and bilateral trade patterns between Africa and China indicated several possible impacts, as denoted by Onjala (2010). Between 2002 and 2011, the Africa-China aggregate trade balance fluctuated around zero value, perfectly describing China’s “win-win” partnership. At an aggregate level, this corresponds to any gains and losses for both sides.
Figure 3 displays the trade balance trend for Africa with the U.S. and China.

Africa-U.S. trade balance versus Africa-China trade balance (2002–2019).
However, since 2012 the Africa-China trade balance has been negative and hit bottom in 2015 when the aggregate trade balance was set to USD −108 billion. Meanwhile, the African exporting countries to the U.S. recorded their highest trade-related gains over the past 18 years, with the U.S., for about USD 65 billion in 2012. Although the Africa-China trade balance has significantly improved since 2015, African exporting countries to China still have to strengthen their export. The balance was USD −34 billion in 2019, compared to USD −6 billion in 2012 and USD −3 billion in 2003. One possible explanation for the negative China-Africa trade balance is the weak prices of commodities that occurred since 2014, which could have significantly impacted the value of African countries’ exports to China.
While the aggregate negative trade balance might sound like a loss for African countries, this is different at the national level. Ademola et al. (2009) concluded trade-related gains and losses from Africa-China trade relations. Obuah (2012), on his part, stated that there is a dichotomy in China-Africa trade relations regarding who might be called net-winner African countries and net-loser African countries. The author sees the same pattern in China-Africa trade, just like in U.S.-Africa trade and UE-Africa trade, in that they are all dominated by prosperous and resource-rich African countries.
From a different perspective, the top five African exporting countries to China have experienced strong economic growth over the past few years. This is indubitably a result of an increase in their exports.
However, it is essential to note that Libya and Angola have experienced a decrease in their level of gross domestic product since 2012 and 2014, respectively. The second civil war that occurred in 2014 as a direct consequence of the 2012 election results could explain the dramatic dropoff in Libya. On the other hand, the instability observed in the international oil price has negatively impacted Angola’s export, meaningfully falling from USD 71.6 billion in 2012 to USD 22 billion in 2020.
However, by trading with larger partners such as China and India, the African nations could diversify their export products and boost their exports. For instance, export remains the key growth driver in most African countries. As long as the continent has an opportunity to export its products, this should be a positive contributing factor to the continent’s economic development.
Recently, international organizations such as the World Bank and the IMF have called on African countries to increase their intra-African exports as an alternative to improve their negative trade balance with China. According to the UNCTAD, Africa has an untapped export potential of USD 21.9 billion, representing 43% of intra-African exports. This potential can be used by fully exploiting the African Continental Free Trade Area (AfCFTA) opportunity, which the UNCTAD believes could boost productivity, reduces poverty and inequality, and spur sustainable and inclusive growth in the continent. Regissahui (2019) also suggests intra-African trade as a diversification solution and proposes more intra-industry trade between Africa and China.
Data and Variables Definition
Variable Description and Data Sources
The study uses data from the United Nations International Trade Statistics Database (UNComtrade) and China Statistical Yearbook 2019. The China Statistical Yearbook contains annual indicators for about 20 years, running from 1999 to 2019. It includes information on the general survey, population, national accounts, employment and wages, prices, population’s living conditions, government finance, resources and environment, energy, investment in fixed assets, foreign trade, and economic cooperation. The latter is the one we mainly use in this study as it provides information such as the value of imports and exports by country (region) of origin/destination. On the other hand, UNComtrade is the largest depository of international trade data and does contain trade data recorded since 1962.
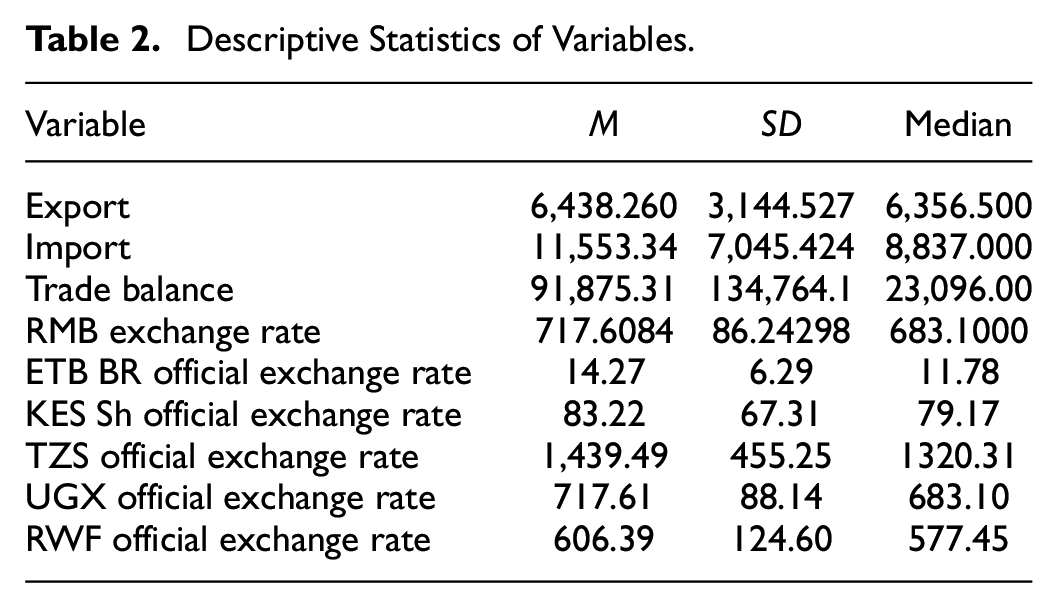
In this paper, we want to estimate the long-term impact of RMB exchange rate movements on the China-East Africa trade balance. To this end, we use four variables: three independent, and one dependent. The independent variables are the value of Chinese exports to individual nation of the region, the value of Chinese imports from the respective nation of the area, and the RMB exchange rate. The dependent variable is China-East Africa trade balance.
We used the UNComtrade database to collect data on China’s exports to Africa and its imports from Africa for 2000 to 2019. We also did the same for the U.S. exports to Africa and their imports from Africa for the same period. We covered all 54 African nations with their exports to the U.S. and China, and their imports from the U.S. and China widely available in a million USD. From those data, we have been able to compute the Africa-U.S. trade balance and Africa-China trade balance for 2002 to 2019.
Similarly, in this study, we want to estimate the impact of RMB and USD exchange rate movements on the individual trade balance for East African BRI countries with China. Therefore, we also collected from the World Bank Open Data the official exchange rate (LCU per US$, period average) for the selected five currencies. Those currencies are the Ethiopian Birr (ETB Br), the Shilling Kenyan (KES Sh), the Tanzanian Shilling (TZS), the Ugandan Shilling (UGX), and the Rwandan Franc (RWF).
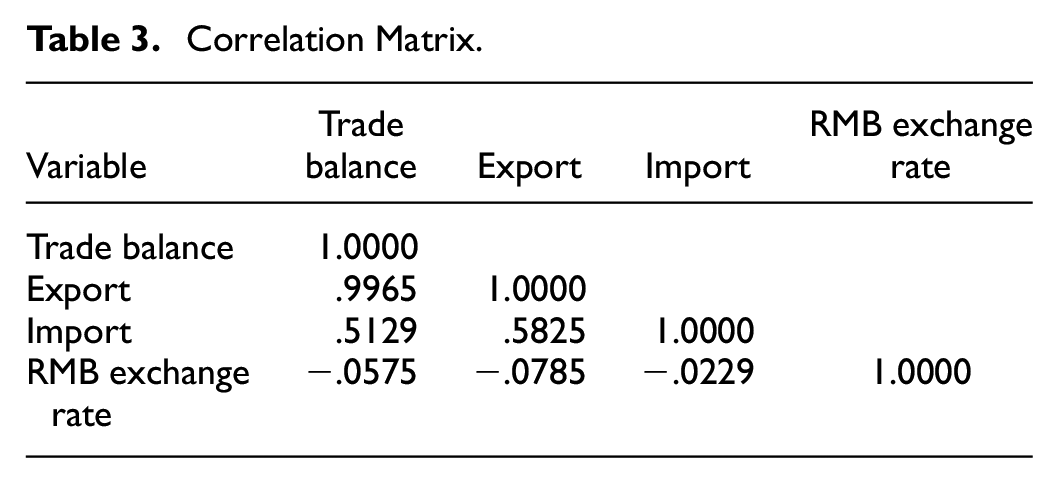
Correlation Matrix
The table 3 above suggests that the RMB exchange rate movements negatively affect the China-East Africa trade balance. It is also negatively correlated with exports and with imports. International trade theories advocate that an increase in the exchange rate (appreciation), leads to increased demand for imports and decreased supply of exports. The huge trade imbalance between China, and East Africa could explain the positive correlation between RMB exchange rate movements and China-East Africa trade balance. It means that East Africa BRI countries import more goods from China than they export to China. The table 3 also shows that both China’s exports to East Africa and its imports from East Africa significantly correlate with the China-East Africa trade balance.
Methods
This paper estimates the long-term impact of RMB exchange rate movements on the trade balance between China and the Eastern African Belt and Road Initiative countries. For this purpose, we follow several steps: the model specification, the Pedroni cointegration test, the estimation of the model coefficients by mean of the Fully Modified OLS (FMLOS) and the Dynamic OLS (DOLS), and finally, some robustness tests.
Model Specification
Bahmani-Oskooee and Brooks (1999) proposed a widely used model that researchers use to evaluate the effects of currency exchange rate fluctuation on a country’s trade balance. The model is specified as follows:

In the model,

Pedroni Cointegration Test
We use the Pedroni cointegration test to examine the relationship among the variables. The Pedroni cointegration test has eleven outcomes or coefficients. When most of these coefficients are statistically significant (less than 5%), we conclude that a relationship exists between the different variables. However, when the majority are not statistically significant, there is no relationship among the variables. The results can come out with varying significance levels, mainly 1%; 5%; 10%; but this test’s most commonly accepted level is 5%. Then every probability with a value not greater than 5% would mean that the associated variable is significant.
Coefficients Estimation
When dealing with a dynamic panel, it is necessary to perform the model coefficient estimation using the Fully Modified and Dynamics OLS technique. The purpose is to determine whether a long run relationship exists among the variables to confirm the analysis from the Pedroni cointegration test. The FMOLS and DOLS techniques also help determine the independent variables that most affect the dependent variable. The FMOLS and DOLS techniques also provide the results from the estimation with different levels of significance, mainly 1%, 5%, and 10%.
Results Analysis and Tests
Pedroni Cointegration Test and Coefficients Estimation
In Tables 1 to 4, LLC stands for Levin, Lin & Chu t*; IPS for Im, Pesaran, and Shin W-stat, ADF for ADF—Fisher Chi-square; and PP for PP—Fisher Chi-square
The results in Table 4 indicate that all the variables of the study become stationary after being converted to the first difference, meaning that the cointegration analysis can be performed.
Variables Description and Data Source.

Note. We also collected data related to currencies from China Statistical Yearbook 2019 for 2000 to 2018. Although the Chinese RMB does have an exchange rate with each of the Eastern African countries’ currencies, one primary reference widely accepted for the RMB is the US Dollars. For this purpose, we collected the reference exchange rate of the Renminbi from the China Statistical Yearbook. The reference exchange rate expresses the annual average value of RMB for 100 US Dollars. We are willing to share this dataset in excel with those who wish to replicate the results of this research.
Descriptive Statistics of Variables.
Correlation Matrix.
Panel Unit Root Test.

p < .10. **p < .05. ***p < .01.
The Pedroni cointegration test summarized in Table 5 clearly shows that the Chinese RMB exchange rate fluctuations affect the regional trade balance between China and the Eastern African Belt and Road Initiative countries. This observation shows the Chinese RMB exchange rate movements could somehow affect the China-East Africa trade balance in the long run.
Pedroni Cointegration Test.

p < .10. **p < .05. ***p < .01.
Results Analysis of Fully Modified OLS (FMOLS) and Dynamics OLS (DOLS)
Table 6 reports the results from estimating the long-run parameters using FOLS and DOLS. The results confirm that, in the long run, the values of exported and imported goods and services somehow affect the trade balance between China and the Eastern African BRI countries. Based on the FMOLS estimates, the results reveal that a one-percentage-point change in the RMB exchange rate drives, in the long run, the volume of regional trade balance between China and the Eastern African BRI countries by 0.015245% (FMOLS) and by 0.009712% (DOLS). However, the FMOLS estimates are statistically more significant than those from the DOLS, and we can say that a 1% change in the level of the RMB affects the regional trade balance by 0.0015245%.
FMOLS and DOLS.

p < .10. **p < .05. ***p < .01.
Table 7 shows the impact of RMB exchange rate movements on the regional trade balance between China and the Eastern African Belt and Road Initiative countries. In this Table 7, we set the RMB appreciation as an increase in percentage change for its value regarding the USD. Similarly, we also set the RMB depreciation or devaluation as a decrease in percentage change for its value regarding the USD. Therefore, Table 7 shows the impact of RMB movements on the China-East Africa trade balance for any scenario and thus allows us to conduct a scenario analysis, mainly RMB appreciation, RMB depreciation, and RMB devaluation.
Impact of RMB Exchange Rate Movements on the Regional Trade Balance.
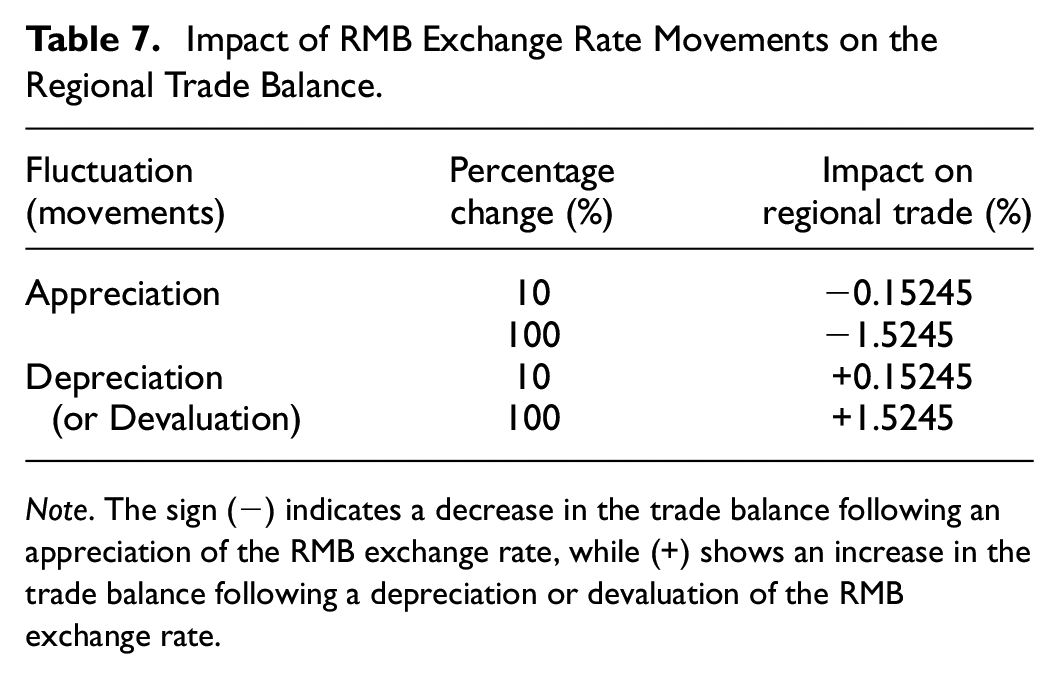
Note. The sign (−) indicates a decrease in the trade balance following an appreciation of the RMB exchange rate, while (+) shows an increase in the trade balance following a depreciation or devaluation of the RMB exchange rate.
Table 7 shows that in the long run, a 10-percentage point increase in RMB exchange rate leads to a 0.15245% regional trade balance decrease, while a 10-percentage point decrease in RMB exchange rate leads to a 0.15245% regional trade balance increase. Similarly, a 1-percentage point increase in RMB exchange rate leads to a 0.015245% long run regional trade balance decrease, and a 1-percentage point decrease in the RMB exchange rate leads to a 0.015245% long run regional trade balance increase. These results are similar to those of a previous empirical study investigating the effects of exchange rates on 10 Eastern African countries (Hunegnaw & Kim, 2017).
The regional level suggests that the China-East Africa trade balance is slightly exposed to RMB exchange rate movements for the sample period of study. Therefore, the RMB exchange rate appreciation, depreciation, or even devaluation, has a lower impact on the regional trade balance between China and the Eastern African BRI countries for the sample period of study. This finding is supported by the empirical result of Joshua (2019). He found that exchange rate movements have a lower negative influence on trade performance in East Africa, especially in the Belt and Road Initiative countries. Our finding indicates that the RMB exchange rate depreciation or devaluation slightly improves the regional trade balance between China and the Eastern African BRI countries in the long run. Similarly, in the long run, the RMB exchange rate appreciation slightly deteriorates the regional trade balance between China and the Eastern African BRI countries.
We also estimate the individual country’s long-run coefficients to determine the impact of RMB exchange rate movements on the China-East Africa trade balance.
Table 8 presents the results from estimating the long-run coefficients using FMOLS for an individual trading partner. The results show that the RMB exchange rate movements negatively and slightly affect the individual trade balance in the Eastern African BRI countries. Therefore, a 1-percentage point increase of the RMB exchange rate leads to a 0.000059%; 0.000030%; 0.000018%; 0.000009%, and a 0.000007% long-run individual trade balance decrease for Ethiopia, Kenya, Tanzania, Uganda, and Rwanda, respectively. Here, Ethiopia is the country that exhibits more sensitivity to RMB exchange rate movements.
Long-Run Coefficients Estimate Using FMOLS for an Individual Trading Partner (RMB).

p < .10. **p < .05. ***p < .01. The values in parentheses represent the probabilities.
The primary outcome suggests that the RMB exchange rate appreciation, depreciation, or devaluation, has a lower impact on the Eastern African BRI countries’ trade balance with China. This indicates that the RMB exchange rate depreciation or devaluation slightly improves the trade balance in respective Eastern African BRI countries in the long run.
The symmetry assumption implies that if an x% depreciation improves the trade balance by y%, an x% appreciation will hurt it by y% (Bahmani-Oskooee & Nouira, 2021). Consequently, the RMB exchange rate appreciation slightly deteriorates the Eastern African BRI countries’ trade balance with China in the long run. These results contradict the main conclusion of an empirical investigation, which pointed out that the trade balance deteriorates with increasing exchange rate depreciation in major East African countries (Genemo, 2017).
Overall, the long-run coefficients for the regional trade balance are more impactful than those for the individual trade balance. It means the Eastern African Belt and Road Initiative countries would gain much more trading collectively with China than individually.
We also examine the effect of USD exchange rate movements on the China-East Africa trade balance for consistency and robustness. The results are reported in Table 9.
Long-Run Coefficients Estimate Using FMOLS for an Individual Trading Partner (USD).

p < .10. **p < .05. ***p < .01.The values in parentheses represent the probabilities.
Table 9 presents the estimation of the long-run parameters using FMOLS for an individual country with USD as the reference currency. Once again, the results show that the USD exchange rate movements negatively and slightly affect the China-East Africa trade balance for the sample period of study. The results are consistent with a recent study that evaluated for the same period that we used (2000–2018) the effect of exchange rate movements on Intra-East Africa Community Regional Trade (Mosbei, 2021). The results from that study also revealed a slight impact on the exchange rate (β = −.0008 and p = .000). In our case, we found those coefficients to be −.00016; −.000457; −.000051; −.000019, and −.000010 for Ethiopia, Kenya, Tanzania, Uganda, and Rwanda, respectively.
Kenya is more sensitive to the USD exchange rate movements than any other country with the USD exchange rate. Individually, the Eastern African Belt and Road Initiative countries are slightly more exposed to the USD exchange rate movements than the RMB exchange rate movements, even though the difference in exposure to the two currencies appears relatively very low. These findings also suggest the USD exchange rate appreciation, depreciation, or devaluation has a lower impact on the Eastern African BRI countries’ individual trade balance with China.
This indicates that the USD exchange rate depreciation or devaluation slightly improves the trade balance in individual Eastern African BRI countries in the long run. This improvement is relatively less significant than in the case of RMB exchange rate depreciation or devaluation. Similarly, based on the symmetry assumption, the USD exchange rate appreciation slightly deteriorates the individual trade balance between China and Eastern African countries in the long run. This deterioration is more important than in the RMB exchange rate appreciation case.
Robustness Tests
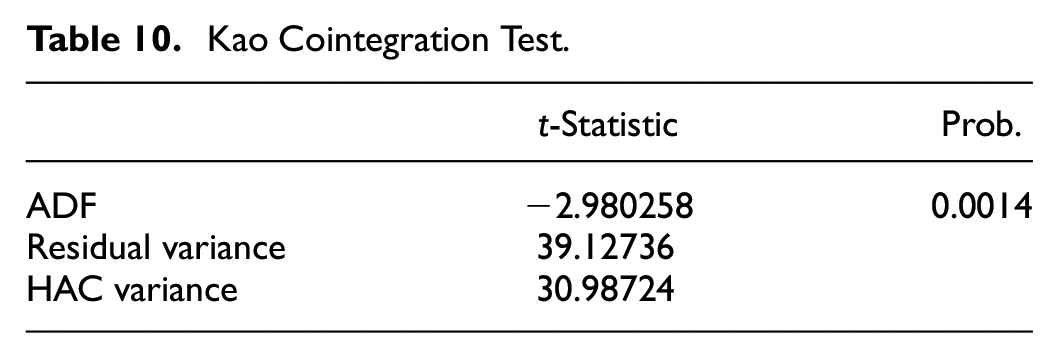
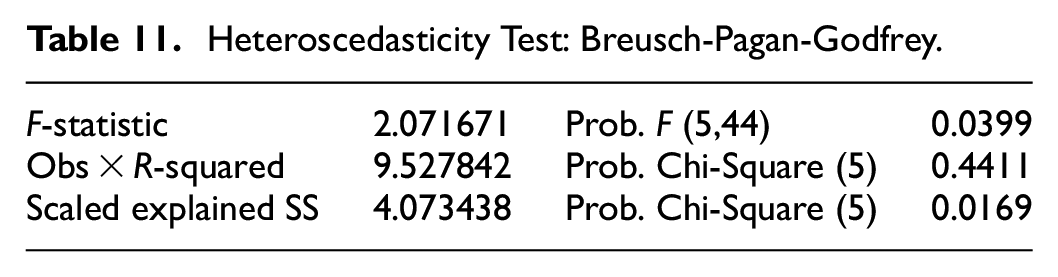
We perform the Kao cointegration test to double-check the cointegration of the variables. In addition, we check the model heteroscedasticity by applying the Breusch-Pagan-Godfrey test. Table 10 presents the Kao cointegration test result (see Table 11).
Kao Cointegration Test.
Heteroscedasticity Test: Breusch-Pagan-Godfrey.
The Kao cointegration test shows that the variables are cointegrated, as the probability (0.0014) is less than 5%.
The model is not heteroscedastic as the probability value of the Chi-Square (0.4411) is higher than the 5% level.
Conclusion and Discussion
This paper estimates the long-term impact of the Chinese RMB exchange rate movements on the regional and individual trade balance in the Eastern African Belt and Road Initiative countries. The paper also estimates the long-term impact of USD exchange rate movement on the individual trade balance for East Africa BRI countries with China. The study makes several significant contributions. First, we evaluate the regional and individual trade balance sensitivity between China and its Belt and Road Initiative trade partners in Eastern Africa. Today the RMB internationalization is more pronounced than it has ever been and is one of the economic importance of the Belt and Road Initiative.
The international community is growing concerns about the Chinese authorities’ choice to keep the currency’s value under its equilibrium worth. Although the extent of RMB undervaluation differs, it is clear that this misalignment of the exchange rate distorts economic fundamentals, negatively influencing the international economic system and macroeconomic performance. In these conditions, RMB internationalization has sparked several debates in several nations, particularly over the impact on international trade (Groenewold & He, 2007; Xiangqian & Guoqiang, 2005). On the one hand, Chinese exports with progressively technical content deal directly with trade items in which Eastern African countries have a comparative advantage, such as raw agricultural production. On the other hand, several governments and political leaders claim the need for more extensive collaboration between these countries and China to function the trade balance between them properly. This study then contributes to these debates by establishing empirical evidence on the impact of RMB exchange rate movements on the trade balance between China and the Eastern African Belt and Road Initiative countries. We demonstrated that the RMB exchange rate movements would slightly affect the Eastern African BRI countries’ regional and individual trade balance, should it be appreciated, depreciated, or devaluated.
Second, this paper evaluates and compares the impact of US Dollar exchange rate movements on the trade balance between China and individual Eastern African Belt and Road Initiative country. We found that in the long-term, the US Dollar exchange rate movements also slightly affect China-East Africa trade balance, even though the impact remains somewhat higher than in the case of the RMB exchange rate. For many years, the effect of USD exchange rate movements on trade has received considerable attention from scholars worldwide (Viaene & De Vries, 1992). The empirical evidence regarding the USD exchange rate movements on trade has, at best, been inconclusive (Dellas & Zilberfarb, 1993). In recent years, the share of the RMB in global official foreign exchange reserves has increased. However, the RMB cannot compete with the US Dollar and the Euro in trade, finance, and commodity transactions. Therefore, this study also contributes to this critical and growing literature by demonstrating that the Eastern African Belt and Road Initiative countries are slightly less exposed to USD exchange rate movements in the long run.
Over the last two decades, China has played an increasingly prominent role in bilateral trade. The effects of the RMB exchange rate movements on major global trade are a policy discussion subject. This study looks at how China’s currency rate policy influences the trade patterns of the Belt and Road Initiative countries in Eastern Africa. Over the sample study period, the analysis finds that the RMB exchange rate fluctuations slightly affect the individual and regional trade balance between China and the Eastern African BRI countries in the long run. The study also concludes that the USD exchange rate fluctuations slightly affects the individual trade balance between China and the Eastern African BRI countries in the long run. We do not find evidence of the J-curve effect in the trade balance between China and the Eastern African BRI countries.
Policy Recommendation
The outcome of this study has many important policy implications for governments and policymakers in the Eastern part of Africa. The primary purpose of the Belt and Road Initiative for East African countries is to improve their individual and regional trade balance with China. The study shows that the long-run RMB exchange rate depreciation or devaluation will not significantly affect the individual trade balance for East African countries. Most importantly, those countries would gain much more trading collectively with China than individually.
The first policy implication is that to benefit trade with China, the East African Community (EAC), including Tanzania, Kenya, and Uganda should speed up its integration process by facilitating Ethiopia, Rwanda, and Burundi. The latter two countries became fully-fledged members of the EAC in July 2007. Ethiopia is not yet part of the community. Still, the other members should integrate that country into the community, given its economic potential, which can drive regional growth significantly.
The primary strategy of the EAC to facilitate inter-and intra-regional trade in goods among its members is through the formation of a Customs Union enshrined in Article 5 (2) of the Treaty establishing the EAC. That strategy seems efficient since the region has increased inter-and intra-regional trade and has even witnessed an increase in intra-EAC Foreign Direct Investments (FDI) and FDI from outside (Penev & Marušić, 2014). Many empirical studies have confirmed that Customs Union’s positive effect on inter-regional trade growth (Buigut, 2016; Kirkpatrick & Watanabe, 2005). However, other researchers recommend that the bloc include a regional trade liberalization that should be nondiscriminatory and consistent (DeRosa et al., 2003). The Customs Union has four major elements: (1) the Common External Tariff (CET); (2) the Rules of Origin (RoO); (3) the internal elimination of tariffs for goods meeting the RoO criteria; (4) the elimination of Non-Tariff Barriers (NTBs). The outcome of this study strongly recommends the EAC go far beyond those four major elements by including a fifth element: (5) the establishment of Export Quotas (EQ) for trade outside the bloc.
The main idea behind the EQ is the implementation of a regional trade rule, which consists of placing a specific limit on the quantities of the same good that some members of the EAC produce and which may be legally exported to a trading partner from outside, especially China, USA, and the European Union. The rule also implies that the EAC has the full power to set the minimum price of commodities produced within the region for outside trade. By doing this, the member countries of EAC would mitigate the risk associated with foreign exchange rate volatility, mainly USD, Euro, GBP, and RMB. The main issue with the Customs Union implementation is that it has generated disproportionate impacts on inter-and intra-regional trade for individual member countries (Eberhard-Ruiz & Moradi, 2019). Therefore, implementing the EQ policy would also help address this critical issue that might threaten the effectiveness and the long-term impact of the Customs Union.
Limitations and Future Research
We used an experimental approach instead of the conventional and comprehensive approach of assessing the trade balance. Although the approach produced meaningful results, it could be the first limitation of our study. When estimating the effect of the exchange rate on the trade balance, researchers usually recommend analyzing the J-curve (Akbostanci, 2004; Onafowora, 2003). In this study, we do not include an extensive analysis of the J-curve. Our results show that the RMB, even the USD exchange rate movements, slightly affects East Africa’s individual and regional trade balance for the sample period.
Another essential gap of this study is that we have not analyzed the short-term impact of the RMB and USD exchange rates on individual and regional trade balance between China and its Eastern African Belt and Road Initiative countries. Given the importance of such analysis, future research that could explore this issue is recommended.
This study misses applying the model to significant foreign currency exchange rates such as the European Euro and the British Pound. In 2020, the largest trading partner for the African countries was the European Union, with 28% of both exports and imports. Simultaneously, the Euro is the world’s second-biggest reserve currency, with an estimated USD 2.94 trillion in central banks globally (Trávníček et al., 2021). Implementing the model in such a context would have provided a better figure of the impact of the Euro exchange rate volatility on the trade balance in East Africa.
Note: This research was conducted while Ibrahim Sakouba was at the School of Management, Hefei University of Technology. He is now at FASEG, Université de Parakou and may be contacted at
Footnotes
Declaration of Conflicting Interests
The author(s) declared no potential conflicts of interest with respect to the research, authorship, and/or publication of this article.
Funding
The author(s) received no financial support for the research, authorship, and/or publication of this article.
Data Availability Statement
Data sharing not applicable to this article as no datasets were generated or analyzed during the current study.