
Abstract
Using the data of 40 host countries during 2010 to 2017, we investigate whether the Belt and Road Initiative (BRI) has brought new opportunities to countries along the routes to participate in global value chains (GVCs). We employ a difference-in-differences (DID) method with propensity score matching (PSM) to solve the self-selection bias problem. The results indicate that BRI has a significant positive effect on promoting the countries along the routes to participate in GVCs, and the effect is lagging and fluctuant. Specifically, we find that the promotion effects are particularly significant in the second year of the BRI’s implementation. The heterogeneity analysis of Belt and Road (BR) countries shows that there remains a significant positive effect on developing BR countries as before, while the opposite is true for developed BR countries.
Keywords
Introduction
Due to an imbalanced industrial structure, a lack of infrastructure, inadequate regional integration, imperfect business environments, and insufficient innovation capabilities, most emerging economies are facing challenges in promoting their participation in global value chains (GVCs). Absorbing relocated industries and transferred capital and exploring international markets play an important role in integrating emerging countries into GVCs. In particular, the Belt and Road Initiative (BRI), which is based on the principles of consultation, contribution, and shared benefits, is in line with the needs of the countries along the routes to accelerate domestic economies and promote their status in GVCs. Described as China’s grand connectivity (Chung, 2017) or a project to foster international cooperation (W. D. Liu & Dunford, 2016), BRI was first announced by President Xi in 2013 and aims to boost regional economic cooperation. However, some researchers criticized BRI as being the largest and most ambitious global infrastructure project. They noted that BRI aims mainly to sustain China’s domestic economic growth and increase its global influence instead of ensuring the economic development of countries along the routes (Padilla, 2017; Scobell et al., 2018). Others have argued that with the continuous implementation of BRI, the cooperative projects along the Belt and Road (BR) countries continuously yield fruits (Pan, 2017), and the integration of economy with BR countries especially in Central and West Asia, Western Europe, and Russia has reached new heights (Huang, 2016). The total import and export trade volume between China and BR countries has exceeded 6 trillion dollars, and foreign direct investment (FDI) from China to BR countries exceeded 80 billion dollars during 2013 to 2018 (Peters, 2019). In terms of facilities connectivity, unimpeded trade, and financial integration, BRI has effectively increased the economic and trade cooperation between China and BR countries. Consequently, the question is whether BRI would have brought new opportunities for BR countries to participate in GVCs.
As a prominent feature of global production and trading systems (Cheng et al., 2016), GVCs have received great attention for their significant influence on economic development. Tong (2017) found that developing countries have an opportunity to create and capture higher value added by participating in GVCs. Gurgul and Lach (2018) noted that emerging and developing countries are all expected to improve efficiency in building their comparative advantage within the GVC framework. As countries continue to realize the importance of GVCs, Mayer and Phillips (2017) claimed that it is time to think much more carefully about the centrality of politics in a GVC world, particularly the role of states in the creation and maintenance of it. However, this article explores the effect of BRI on BR countries’ participation in GVCs from an economic geography perspective (Krugman et al., 1995), which is more of what Beeson (2018) called a geoeconomic approach. In this way, all political influence can be eschewed to look at all the countries along the routes, whether they are participating or not. Hence, this article would provide deeper insights to obtain a greater overall knowledge of BRI and help BR countries implement corrective action.
Recently, there have been increasing studies on BRI, focusing mainly on fundamental connotations, practical obstacles, and the implementation of the initiative (C. L. Cai et al., 2015). As a significant and noteworthy matter of academics, policy executors and makers, there is a body of literature focusing on the impact of BRI. Many researchers proposed that the international cooperation of BRI in different fields has emerged and increased significantly, such as energy (Han et al., 2018; Sarker et al., 2018; Shi et al., 2018; Xu et al., 2017; Yuan et al., 2018, 2019; Zhang et al., 2019), environment (Ascensão et al., 2018; X. Cai et al., 2018; Dong et al., 2015, 2017; Saud et al., 2019; Solmecke, 2017), infrastructure (He, 2016; J. Li et al., 2017; Y. H. Liu, 2012; J. J. Wang & Yau, 2018), and finance (Chhibber, 2015; Gabusi, 2017; Hafeez et al., 2018; Weng, 2016). In addition, a wealth of studies found that the development of BRI contributes to the integration into GVCs from a single-country perspective. Selmier (2019) and H. M. Liu et al. (2016) noted that BRI catalyzes the development of Kazakhstan as an integrated transport complex, thus promoting the formation of a more complete supply chain. Irshad (2015) and Arrfat (2020) considered that the BRI and China–Pakistan Economic Corridor (CPEC) projects provide ample opportunity for Pakistan to integrate its industry and trade with the GVCs of China. Participating in BRI benefits the integration of Russia’s transportation system into the logistics network of the Eurasian region (Makarov & Sokolova, 2016) and the infrastructure development of India (Banerjee, 2016).
In addition, theoretically, a few studies have investigated the overall impact of BRI on the economic development of all countries along the routes. Lai et al. (2018) illustrated that BRI can build a cohesive spatial economic network integrating the multinational region on China’s unique experience with its economic development and free trade zones. Silin et al. (2018) found that the mutual benefit within the framework of BRI involves mainly international cooperation based on mutual benefits for all participants, the promotion of economic growth and welfare, and the development of modern infrastructure through joint investment. Unimpeded trade as one of the cooperation priorities of BRI is regarded as a significant driver of economic prosperity and regional cooperation among BR countries (Song et al., 2017, 2018).
However, little empirical research has explored the impact of BRI on BR countries’ participation in GVCs. We consider BRI as a quasi-experiment, because this policy naturally divides the world into two groups: BR countries and non-BR countries, which can be regarded as the treatment group and control group, respectively. By collecting the data on GVCs before and after the implementation of BRI, this condition enables us to apply the difference-in-differences (DID) approach to identify the impact of BRI on BR countries’ participation in GVCs. Nevertheless, we cannot simultaneously observe two statuses of one country as BR country or non-BR country. There will be selection bias if we directly compare the participation of BR countries and non-BR countries in GVCs. To avoid this problem, we employ the propensity score matching (PSM) method with DID to evaluate the impact of BRI on the participation of countries along the routes in GVCs. In addition, we investigate the dynamic effect and the economic development heterogeneity effect of BRI on the participation of BR countries in GVCs. Also, we do a robustness test to ensure the reliability of the research results. The estimates first show that BRI has a significant positive effect on promoting the participation of BR countries in GVCs, and the effect is lagging and fluctuant. In particular, in the second year of the implementation of BRI, the promotion effects are particularly significant. The heterogeneity of economic development of BR countries also has an impact on the BR effect, and the heterogeneity analysis shows that a significant positive effect on developing BR countries remains as before, while the significant effect on developed BR countries disappears.
Our contributions to the literature are threefold. First, to the best of our knowledge, this is the first study on BRI’s effect on the participation of BR countries in GVCs from the perspective of policy evaluation. Second, this study adds to the literature on the determinants of BR countries’ participation in GVCs and enriches the research on the relationship between BRI and GVCs. Finally, we examine the heterogeneous impact of BRI on participation in GVCs by distinguishing the different economic development levels of the BR countries.
The remainder of the article is organized as follows. The following section presents the literature review on the participation in GVCs and BRI. The next section details the data, measure, and methodology, followed by presenting the estimation results and robustness analysis of the study. Finally, the “Conclusion” section summarizes the research results and analyzes the pertinent limitations and recommendations for future research.
Literature Review
Since the 1990s, the GVCs, which are the main mode of the international division of labor, have become the most prominent feature of world economic development (Johnson & Noguera, 2012). Meanwhile, BRI, as an essential open cooperation policy, has received much attention. However, relevant empirical studies about the effect of BRI on countries’ participation in GVCs are rare. This article refers to the relevant studies measuring participation in GVCs and the impacts of various policies on GVCs.
Participation in GVCs
Many of the studies on participation in GVCs focus on the measurement of GVC participation and the impacts of embedding in GVCs on other aspects. Krugman et al. (1995) initially put forward the concept of GVCs, which means a sequence of production activities that are spread across more than one country (Kaplinsky & Morris, 2003). GVCs highlight mainly the relative value of those activities that are required to bring a product or service from conception through the different phases of production (involving a combination of physical transformation and the input of various producer services), delivery to final consumers, and final disposal after use (Gereffi et al., 2001). Existing research does not clearly define the concept of participation in GVCs; we consider that participation in GVCs refers mainly to the degree and nature of the interaction of one country with its main economic partners and reflect whether a country is better integrated in international production networks (Bullon et al., 2015).
There are macro- and micro-approaches to measuring GVCs (Johnson, 2018). The micro-methods are used mainly to measure the participation of specific industries or firms in GVCs, whereas the macro-methods are generally adopted to measure participation in GVCs at the country level. There are some widely used methods to measure countries’ participation in GVCs. The earliest method was put forward based on the data on the broad economic categories (BECs) classification in the United Nations Commodity Trade Statistics Database (UN COMTRADE) by Yeats (1998), which has the most countries involved and covers the longest period. Participation in GVCs was expressed as the portion of the sum of import and export intermediate goods in total trade. Then, Hummels et al. (2001) proposed two measures of “vertical specialization” (VS and VS1) from the import and export perspectives, respectively. VS is expressed as the portion of imported intermediate input to gross exports, whereas VS1 is expressed as the portion of exports used by another country for producing export goods to its gross exports. Daudin et al. (2011) presented the Daudin, Rifflart and Schweisguth (DRS) method, which refers to the value of the goods that are exported by one country and imported by other countries around the world to produce the final goods that are sent back to the original country. Based on previous studies, Koopman et al. (2010), Johnson and Noguera (2012), and Koopman et al. (2014) found that vertical specialization measures were not applicable when the production process occurs in several different countries. Based on previous studies, Koopman et al. (2010, 2014) proposed the Koopman, Wang and Wei (KWW) method, which was expressed as the portion of the sum of the foreign value added (FVA) share and indirect domestic value added (DVX) share to gross exports on the basis of world input–output tables. This method can calculate participation in GVCs for only some of the countries in certain years.
GVCs With Policies
There is a growing interest in the relationship between various policies and GVCs, and some of these studies indicate that policy makers should provide different effective development strategies and consistent policy approaches to facilitate dynamic participation in GVCs (Abe & Proksch, 2017). The relevant policies to improve participation in GVCs in the existing studies are classified mainly as seven kinds: trade policies (such as trade agreements; Amendolagine et al., 2019; Orefice & Rocha, 2014), competitiveness and development policies (Cattaneo et al., 2013), non-tariff policies (Organisation for Economic Co-Operation and Development [OECD] et al., 2013), investment policies (such as FDI policies; Amendolagine et al., 2019), industrial policies (Kaplinsky & Morris, 2016), innovation and skill policies (Kergroach, 2018) and contract or property rights policies (OECD et al., 2014). It is essential to research the effect of systemic BRI that involves trade, investment, and other aspects of participation in GVCs. Scholars have conducted extensive and in-depth studies on the impacts of BRI, and they consider that BRI has significant effects on the cooperation of BR countries (Fu et al., 2018; W. D. Wang & Picciau, 2018) and all types of investment in BR countries (Du & Zhang, 2018; H. M. Liu et al., 2018). However, existing academic studies have not focused on the effect of BRI on participation in GVCs.
Data Description and Measurement
Variable Measurements
Participation in GVCs
This article investigates whether BRI influences the participation of countries along the routes in the GVCs by 2010 to 2017 data. Accurately measuring the dependent variable
Main explanatory variable
The main explanatory variable in this article is the implementation of BRI. To measure the explanatory variable, we need to consider two dimensions of whether a country is the BR country and whether it is time to implement BRI. The samples are screened and processed, and in the end, we obtain 105 countries. Among these sample countries, 40 are BR countries in the treatment group
Control variables
We select market size
Main Variables and Indicators.

Note. GDP = gross domestic product.
Data Source and Description
BRI is an open policy, so there is no limit to the number of participating countries. Referring to the existing results of M. Li (2015), R. Peng et al. (2017), C. Peng et al. (2017), Pencea (2017), Hu and Pan (2017), and Chen et al. (2019), the BR countries are generally set to the 65 countries along the BRI routes, defined geographically containing the Silk Road Economic Belt and Maritime Silk Road. 2 Regardless of whether the countries have signed cooperation agreements or memorandums of understanding (MoUs) with China, grouping countries according to the ancient Silk Road is more random and can help to clarify the net effect of BRI. The non-BR countries refer to the countries in the world that are not along the BRI routes. However, non-BR countries can still join BRI by signing cooperation agreements or MoUs. Therefore, I would like to stress that to ensure the reliability and unbiasedness of this research, the control group in this article does not include non-BR countries that have signed cooperation agreements or MoUs with China during 2015 to 2017, such as Madagascar, New Zealand, and South Africa. 3 Non-BR countries that have signed the cooperation agreements or MoUs with China since 2018 will not affect the research, so they will not be processed. According to the availability of the data, this article chooses 40 BR countries as the experimental group and 65 non-BR countries as the control group for the natural experiment by using data from 2010 to 2017. The data used mainly come from UN COMTRADE, the World Bank (WB), the OECD, the International Monetary Fund (IMF), International Financial Statistics (IFS), and the Balance of Payments (BP) databases. To eliminate heteroscedasticity, we use the natural logarithm values of all variables for the regression. The descriptive statistics of the variables are detailed in Table 2.
Descriptive Statistics of Variables.

Method
From the perspective of policy evaluation, this article investigates the effect of BRI on the participation of countries along the routes in GVCs. To control for sample bias, this article will apply the DID method with the PSM method to estimate the effect of BRI on the participation of countries along the routes in GVCs.
PSM
As an open cooperation policy, BRI can be regarded as a natural or quasi-natural experiment. By comparing the GVCs of BR countries and non-BR countries before and after the implementation of BRI, this article can dissect the impacts of BRI on the participation of countries along the routes in GVCs. However, there may be selection bias in direct contrast to the GVCs between BR countries and non-BR countries. On one hand, is the determination of BR countries random or not? According to Lien et al. (2012), there may be an embedded signal within the decision to participation in BRI. On the other hand, are the differences in GVCs between BR countries and non-BR countries caused by other unobservable and time-invariant factors? To avoid the influence of both deviations on the final research results, before the analysis of DID, we apply the PSM method proposed by Rosenbaum and Rubin (1983) to process the sample data.
The PSM method aims to construct the counterfactual outcome of the BR countries. First, this article selects the market size

where
DID
DID is currently the most popular method of policy evaluation. It can effectively separate the “time effect” from the “policy processing effect” and eliminate deviations caused by unobservable time factors (Dalgıç et al., 2014). According to the division of the treatment group and control group, the DID model is specified as

where
PSM-DID
There may be selection bias in using the DID method alone, and there may be time effect by using the PSM method alone. Thus, we combine DID with PSM and set the empirical model as

All variables have the same meaning as above. First, the PSM method is applied to obtain comparable control groups with similar characteristics to the treatment group from the original control group. Then, DID is used to compare the participation in GVCs of the treatment group and the comparable control groups. This first step can address the selection bias, and the second step can solve the time effect. By adopting the PSM, countries with similar economic development situations can be identified and matched, and then, only matched countries can be compared by the DID method. The combination of PSM and DID produces more reliable and objective results.
Empirical Results
Sample Matching Results Test
Common support test
A common support hypothesis is the premise of the PSM method (Heckman et al., 1997). Its test methods include the receiver operating characteristic (ROC) curve, empirical density function graph, and common support domain bar graph. After one-to-three matching, most of the 591 observations were within the common support range. All the data in the control group are in the common support range, and only six observations of the treatment group are not in the common support range. The kernel density function graph is shown in Figures 1 and 2. By calculating the propensity score, we can know that the one quarter standard deviation of propensity score is 0.0446. To ensure the matching process, we conservatively use 0.03 for one-to-three matching within caliper. Both results are consistent, so they are not too distant neighbors.

The kernel density of PSM in the treatment group and the control group before matching.

The kernel density of PSM in the treatment group and the control group after matching.
Figure 1 shows that before one-to-three matching, there is a certain range of non-coincidence in the common support range between the control group and the treatment group. The distribution of the control group is left-leaning and scattered, and the probability density of the propensity score value between the two groups is quite different. After the one-to-three matching, the probability density of the propensity score value between the two groups is consistent (see Figure 2). Therefore, we can conclude that the data for the sample have passed the common support test.
Balancing test
In addition to the common support hypothesis, a balancing test for the matching process is also necessary. This article uses the method proposed by Smith and Todd (2005) to test the balancing in the matching process, and the test results are shown in Table 3. The table shows that the standard bias dropped dramatically to less than 12.3% after matching. According to the research of Rosenbaum and Rubin (1983), we find that matching variables and the matching method are all reasonable. In addition, after matching the t-value, there is no obvious difference between the treatment group and the control group. In addition, the likelihood ratio (LR) value and ps R2 value were significantly reduced to 3.83 from 79.79 and to .100 from .006, respectively, and the R value was 0.52 in the interval [0.5, 2]. All the balancing test results indicate that matching is effective.
Balancing Test for Propensity Score Matching.
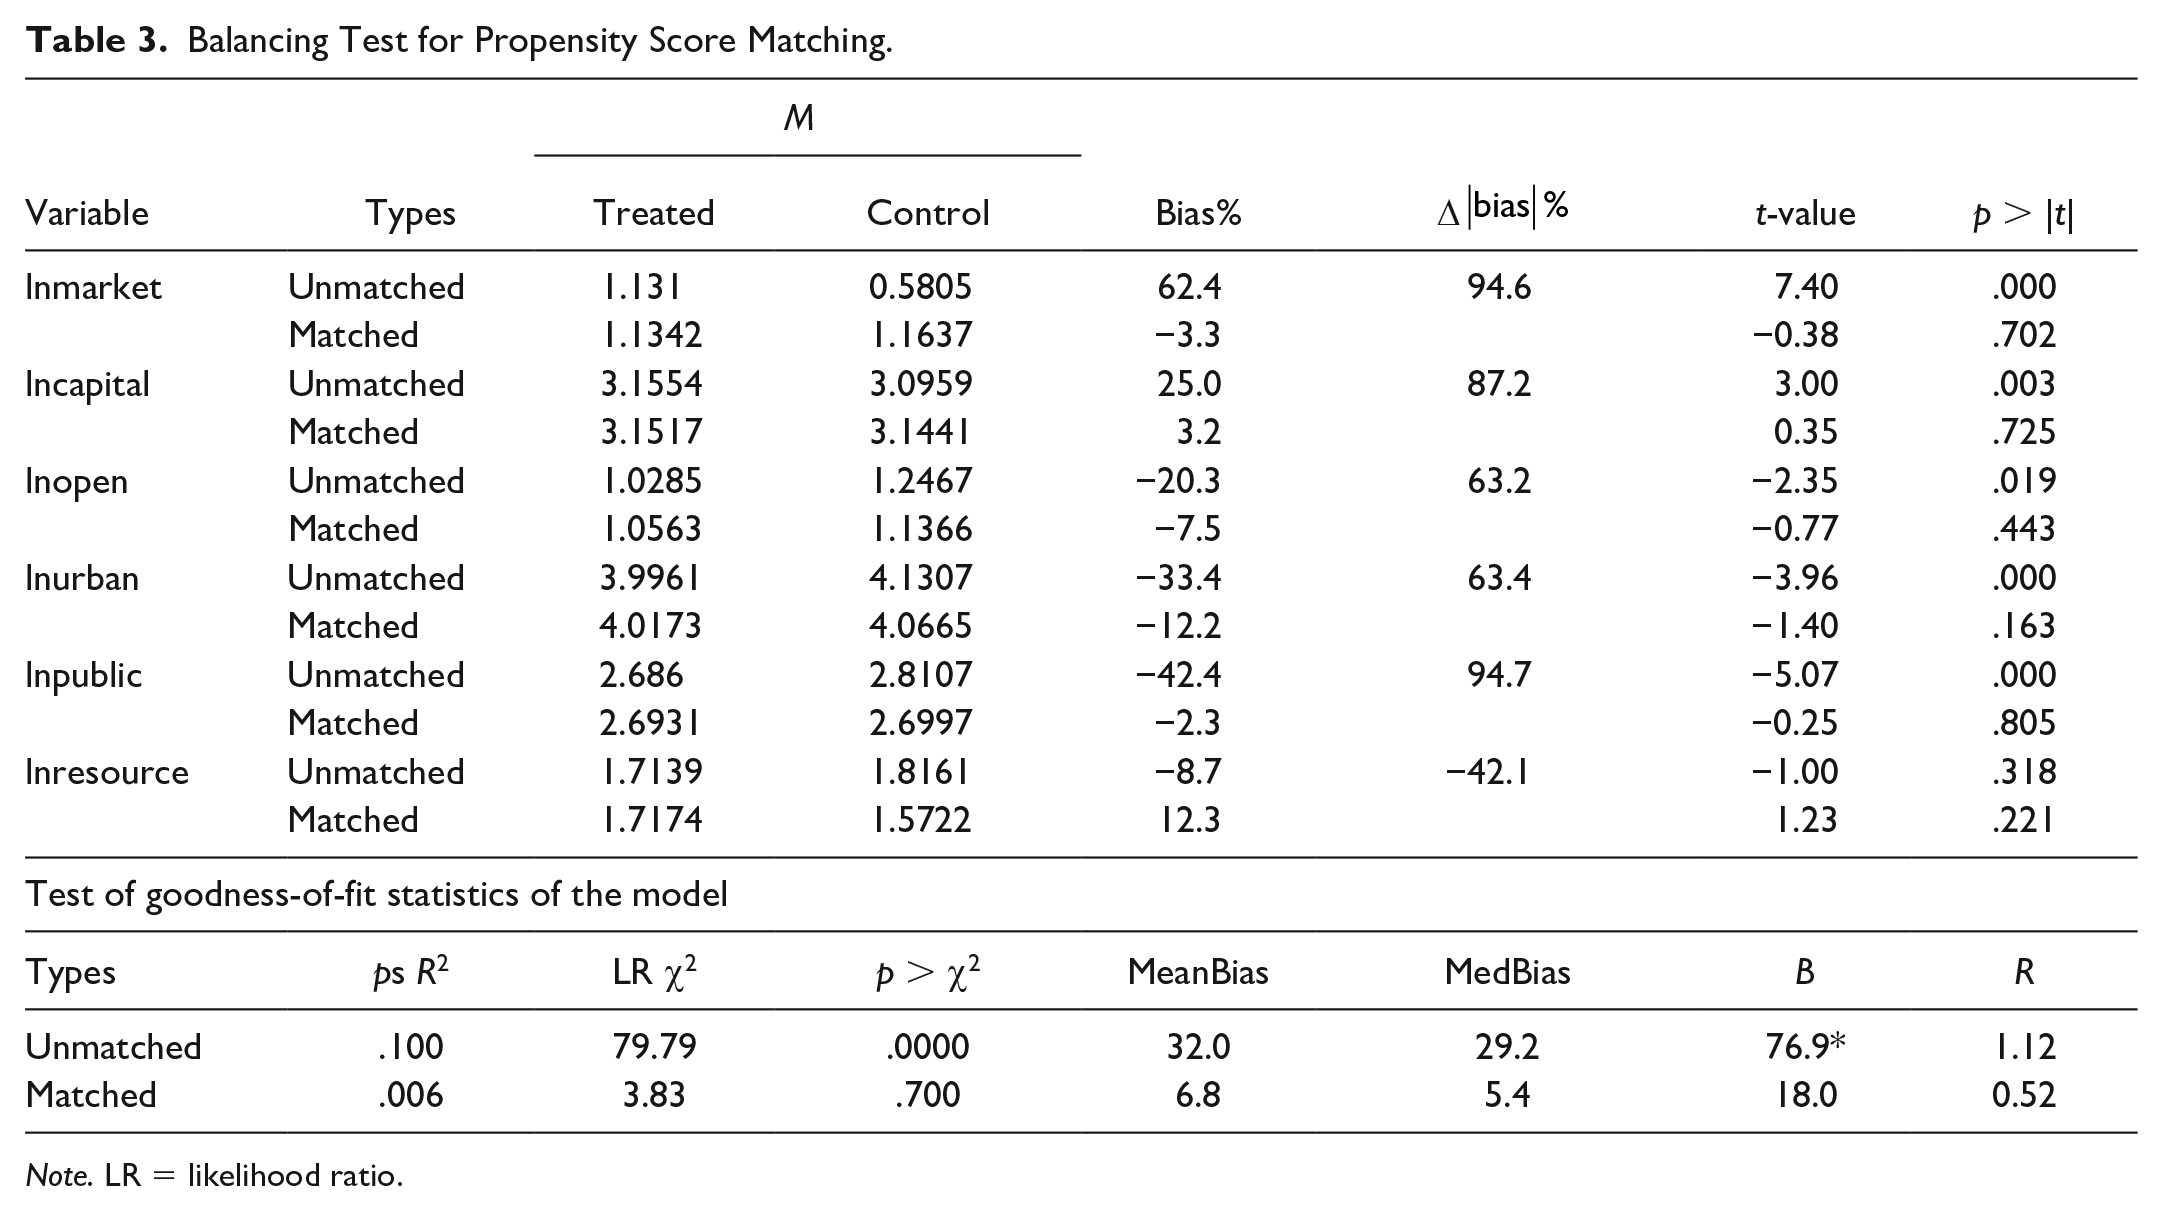
Note. LR = likelihood ratio.
Baseline Empirical Results
Using Equation 3, this article estimates the effect of BRI on the participation of countries along the routes in GVCs and applies the cluster robust standard error in the regression. Table 4 presents the regression results, and to enable comparisons, the table also shows the estimation results of unmatched data. Columns (1) and (2) reveal the estimation results for unmatched data, and others display the regression results for matched data. Columns (1) and (3) describe the baseline results only without any control variables, and columns (2) and (4) add the main explanatory variables to columns (1) and (3), respectively.
The Basic Effect of BRI on the Participation of Countries Along the Routes in GVCs.

Note. The t-values are shown in parentheses. BRI = Belt and Road Initiative; GVCs = global value chains; DID = difference in differences; PSM = propensity score matching.
, **, and *** indicate that the regression coefficient is significant at the statistical level of 10%, 5%, and 1%, respectively.
The coefficient of
Market size, economic openness, and public service all have a significantly negative effect on the participation of countries along the BR in GVCs. According to the study by Kowalski et al. (2015), the larger size of the domestic market means the lower backward engagement and the higher forward engagement of one country. The results first indicate that when market size grows in BR countries, the backward linkage will decrease proportionally more than the increase in the forward linkage. In addition, the results also show that capital inflows brought about by economic liberalization do not increase the trade volume of intermediate goods, and may be used mainly for infrastructure construction and natural resource exploitation. However, urbanization and natural resource abundance both have a significantly positive effect on the participation of BR countries in GVCs, which can be explained by the fact that BR countries participate in GVCs mainly through urbanization and the development of natural resources.
In particular, there is a significant decrease in the significance of natural resource abundance under the PSM-DID specification, which indicates that countries with abundant natural resources are more likely to participate in BRI. Material capital does not show significance.
The Dynamic Effect
Because BRI is a sustainable continuous initiative, it is essential for us to research the dynamic effect of BRI on the participation of BR countries in GVCs. We add the interaction terms of

where
The Dynamic Marginal Effect of BRI on the Participation of BR Countries in GVCs.

Note. The t-values are shown in parentheses. BRI = Belt and Road Initiative; BR = Belt and Road; GVCs = global value chains.
, **, and *** indicate that the regression coefficient is significant at the statistical level of 10%, 5%, and 1%, respectively.
Economic development heterogeneity effect
BRI involves many countries that are all at different levels of development. Thus, we combine the PSM-DID method with economic development heterogeneity to estimate the different effects of BRI on the participation of developed and developing BR countries in GVCs. Specifically, we divide the BR countries into two groups according to the level of economic development, and build two new dummy variables
The estimated results illustrate that in the current study, the heterogeneity of the level of economic development of BR countries can influence the effect of BRI on BR countries’ participation in GVCs. The implementation of BRI has only a positive impact on the participation of developing BR countries in GVCs, which is consistent with our expectations. On one hand, BRI can identify the comparative advantages in resources and markets or other aspects of developing BR countries. On the other hand, the investment in BRI projects focuses mainly on infrastructure construction, which fits in with the state of weak infrastructure in developing BR countries.
Robustness Test
Based on the panel data for 40 BR countries from 2010 to 2017, we prove that BRI can enhance the participation of BR countries in GVCs. To test the reliability of the research results, we transform the matching method to the caliper matching method, which has a similar principle as one-to-three matching. First, the caliper matching method is applied to match the samples, and then we use DID to estimate Equation 3 based on the matching results. The regression results are consistent with the previous results and are not shown here.
Conclusion
In the context of BRI, the cooperation between China and countries along the routes is being strengthened. Against this background, using panel data from 105 countries, we employ a DID method with PSM to investigate the effect of BRI on the participation of BR countries in GVCs. The empirical results are as follows:
BRI has a significantly positive effect on promoting the participation of BR countries in GVCs.
The positive effect is lagging and fluctuant, which is especially significant in the second year of the implementation of BRI.
The heterogeneity of economic development in BR countries influences the effect of BR. The significant positive effect on the developing BR countries remains as before, while the significant effect on developed BR countries disappears.
Our findings contribute to the debate about the significance of BRI in explaining part of the enhancement of participation of BR countries in GVCs. They demonstrate evidence that BRI matters. The implications of the study include the following. First, it is important to encourage countries to actively participate in BRI and actively integrate into the international division of labor by virtue of their own advantages, such as abundant resources. Second, BR countries should pay more attention to the cultivation of the absorptive and control capacity over the investment to ensure that the inflows effectively promote participation in GVCs. During the process of cooperation, BR countries need to focus on learning advanced technology, knowledge, and management skills. Furthermore, the effect of BRI on developing BR countries and developed BR countries differs, indicating that BRI can alleviate the imbalance in the international division of labor between developing and developed countries. However, future cooperation in the context of BRI should also focus on the differences between developing countries and developed countries.
There are some limitations that should be addressed in future research. On one hand, we select some characteristics of country as the main explanatory variables, so the model does not account for other possible factors. On the other hand, we use the data from various data sources that have a certain missing value. We will apply more abundant data in our future research.
Footnotes
Declaration of Conflicting Interests
The author(s) declared no potential conflicts of interest with respect to the research, authorship, and/or publication of this article.
Funding
The author(s) disclosed receipt of the following financial support for the research, authorship, and/or publication of this article: This research was supported by National Social Science Foundation of China (Grant No. 16FJY008), Natural Science Foundation of Shandong Province (Grant No. ZR2016FM26), and Postgraduate Science and Technology Innovation Foundation of Shandong University of Science and Technology (SDUST; Grant No. SDKDYC170228). The interpretation of the findings does not necessarily reflect the views of the funding agency.