
Abstract
This study presents an attempt to scrutinize whether the Belt and Road Initiative (BRI) promotes environmental degradation in BRI countries using panel data of 130 countries during the period 1990 to 2018. For this, we used carbon emission as a proxy variable to estimate environmental degradation. Taking BRI as a quasi-natural experiment this paper used a difference-in-difference approach to estimate the impact of the Belt and Road Initiative (BRI) on environmental degradation. The finding consistently shows that BRI has a significant impact on environmental degradation. Furthermore, economic growth shows a negative correlation with carbon emission and square term of GDP per capita presents that there is no evidence for the existence of the environment Kuznet curve hypothesis, however, this study established a U-shaped association between economic growth and
Introduction
The Belt and Road Initiative (BRI) become a “global grand strategy” (An et al., 2021) which supports strengthening the physical infrastructure, improving regional development, reorganizing the relationships with neighboring countries, and restructuring the economic activities (Beeson, 2018). The BRI originates from China and runs through Eurasia and bridging the Asian and Western economies through their adjacent seas by creating synthesized connectivity network in more than 65 countries which accounted for 30% of the world gross domestic product, 35% of the world trade, 39% of the global land, 64% of the world population, 54% of the world
The ambition of the Belt and Road Initiative differs sustainability from the environmental perspective, due to its large-scale operation; it needs a huge amount of energy and material. For the last few years, the growth rate of

Distribution of carbon emission in the world.

Trends of carbon emission in China.
China is a world leader in greenhouse gas emissions, generating together with India and other Asian countries almost half of the total world carbon dioxide emissions (Levi, 2015). Chinese academics also recognized that environmental concerns might be a possible obstruction to BRI’s ambitions (Chen, 2015; Zhang, 2017). The ASEAN POST published, a piece of news on its front page on December 24, 2019, that China’s BRI negatively impacts the environment. As per Jun et al. (2019) an increase in economic productivity due to the Belt and Road Initiative will lead to an increase the pollution, waste, and greenhouse gases. According to Peng et al. (2017) Chinese financiers have invested in 240 coal power plants in 65 belt and road countries during the period from 2001 to 2016 and these coal power plants affect the environment quality. Similarly, the reconnecting Asia database identified 22 fossil fuel power plants being constructed in Southeast Asia and China as the major agent and finally, the relocation of the polluting industries from China to those BRI economies having weaker labor and environmental standards also considered another environmental concern.
In response to the above views and environmental concerns, this study going to empirically examine whether the Belt and Road Initiative promotes environmental degradation. For this
The contribution of this study can be assessed as when comparing the current study to the existing studies, it is found that many researchers (Abban et al., 2020; Ahmad et al., 2018, 2020, 2021; Anwar et al., 2021; Li et al., 2021; Liu & Hao, 2018; Mahadevan & Sun, 2020; Muhammad et al., 2020; Saud et al., 2020; Shujah ur, Chen Saud, Bano, et al., 2019; Rauf et al., 2018; Sun et al., 2019) mainly studied the effects of economic growth, financial development, renewable and nonrenewable energy consumption, income level, trade openness, foreign direct investment, international trade, urbanization, and globalization on carbon emission and nexus among bench of independent variables in various belt and road countries but the specific study on the proposed topic titled “an impact evaluation of Belt and Road Initiative on environment degradation” has not been evaluated in the prior research. However, the 13th goal of the SDGs of the UN 2030 agenda mainly focused to take action to combat the climate change by regulating the emissions and China’s BRI also integrated with this goal proposing the green “Belt and Road.” Therefore, consider the importance and practical implication of the BRI, this study going to empirically evaluate the environmental effects of the BRI policy. For methodological point of view, existing empirical studies used numerous econometric techniques including POLS, FMOLS, DOLS, System GMM, Difference GMM, POLS, PMG modeling, cross-sectional dependence test, panel unit root tests, panel co integration test, panel causality test including granger causality tests, and many other short-run and long analysis. So, taking the BRI policy as a quasi-natural experiment this study used difference-in-difference (DID) approach to examine the environmental effects of Belt and Road Initiative treating the BRC counties as a treatment group and non-BRC countries as a control group and to validate the results of the DID approach this study used parallel trend test. Furthermore, many countries gradually joining the BRI for one another and a total of 140 BRI countries are listed in the online portal of the BRI, however existing studies explored maximum 65 BRI countries, and the rest of the counties remained unexplored so the current study tried to reduce this gap and it used data of 89 BRI counties. The authors created visual images using the “Quantile or Equal Frequency” method of data distribution and visualization in the study. Overall, the results of the study indicate that BRI promotes environmental degradation and this study found negative correlation between economic growth and carbon emission and square term of GDP turn negative to positive as a result this study established U-shaped curve and negate the existence of the ECK hypothesis. These findings contribute to the literature on the long debate of the presence and reliability of the EKC hypothesis in BRI countries. Furthermore, this study also provides new insight for policy implications.
The key objective of the current study is to explore the role of Belt and Road Initiative on environmental degradation and the research question of this study is tightly focused on the environmental sustainability policies and this study seeks answers to research questions. Does Belt and Road Initiative promote environmental degradation? Do Belt and Road Initiative demonstrate the environment Kuznet curve to demonstrate the economic growth carbon emission hypothesis? Does economic growth significantly decrease/increase carbon emission? Does energy consumption decrease/increase carbon emission? Does financial development increase/decrease carbon emission? For empirical analysis, this study used the DID model and the result of the study indicates that the “Belt and Road Initiative” promotes carbon emission as a result environmental pollution increased and the rest of the study is organized as Section 2: literature reviews, Section 3: variables and data source, Section 4: methodology, Section 5: results, and Section 6: conclusion and policy implications.
Literature Review
The Belt and Road Initiative (BRI) first introduced by the Chinese President Mr. Xi Jinping during his state visit to Kazakhstan in September 2013 centered on the “New Silk Road Economic Belt” and one month later in Indonesia, Mr. Xi Jinping announced the “21st Century Maritime Silk Road” connecting China with Southeast Asia, Middle East, Africa, and Europe (Nazarko & Kuźmicz, 2017; Zhao, 2019). These 02 proposals are jointly termed as the One Belt One Road (OBOR) or Belt and Road Initiative (BRI), where “Silk Road Economic Belt” is a land-based development project which includes rail, roads, pipelines, and associated infrastructure and Maritime Silk Road is a sea-based road which involves ports, maritime infrastructure, and shipping routes (Yang et al., 2019). In November 2013, the initiative was approved and written into the reform blueprint as a key policy priority at the third Plenum of China’s 18th National Congress. According to the National Development and Reform Commission (NDRC) in March 2015 the Ministry of Foreign Affairs, and Ministry of Commerce with State Council weization, with approval from the State Council several government departments jointly released the “Vision and Action on Jointly Building Silk Road Economic Belt and 21st Century Maritime Silk Road” (Vision and Action, NDRC, 2015), which provided more specific plans and explanations for the BRI.
According to the Vision and Action (NDRC, 2015), the BRI aims to link Asia, Europe, and Africa through five routes. The Silk Road Economic Belt will: (1) connect China with Europe through Central Asia and Russia; (2) link China to the Persian Gulf and the Mediterranean through Central and West Asia; (3) bring together China and Southeast Asian, South Asia and the Indian Ocean. The 21st Century Maritime Silk Road will: (4) start from China’s coastal ports to the Indian Ocean through the South China Sea, and extend to Africa and Europe; (5) connect China’s coastal ports with South Pacific Ocean through the South China Sea. It is ever conceived most aspiring infrastructure development and regional integration (Chen et al., 2019). It is a vast collection of investment and development initiatives that stretched from Asia to Europe to strengthen the trade and investment partnership; importantly it is expanding China’s political and economic influence. The BRI, promotes mutual learning, economic prosperity, and world peace by improving human capital, financial and physical connectivity across the continents. Almost more than 100 countries are involved with BRI and the estimated investment is 1 trillion US$ to 8.5 trillion US$ (Lechner et al., 2018). To strengthen this cooperation, China wants to construct 06 economic corridors announced by Vice Premier Mr. Zhang Gaoli in 2015 at the Asia-Europe Economic Forum. The major aims of BRI are policy coordination, facility connectivity, unimpeded trade, financial integration, and people’s connectivity.
After the commencement of BRI in 2013, the concerns about the environmental effects of the Belt and Road Initiative are rife (Ascensão et al., 2018; Tracy et al., 2017). Some environmentalists worry that China’s ongoing internal environmental crisis is unmatched with its sheer scope when it is measured in terms of water and air pollution (Economy, 2014; Silk, 2013). According to Lechner et al. (2020) Chinese overseas direct investment participates in primary and secondary industries such as construction, energy, and mining and most of the Chinese overseas investment is relatively less pollutive tertiary industries in BRI counties. Greenhouse gases from fossil fuels and anthropogenic emissions are considered the major contributor to world climate change which has already become an environmental and ecological issue in the world (Davis & Caldeira 2010).
Many researchers believe that financial sector development can enhance the speed of economic growth if financial markets invite foreign direct investment and look for higher investment in research and development (Frankel & Romer, 1999). Some, of the researcher, thinks that financial development can keep the environment less polluted, production and manufacturing of the economic friendly products resultantly, increase sustainable development, at the regional, national, and global level (Birdsall & Wheeler, 1993; Frankel & Rose, 2002). It is blamed that financial development may cause in raising the
Shujah ur, Chen et al. (2019) investigated the influence of financial development and globalization including energy consumption on environmental degradation in 16 Central and Eastern European countries of the BRI for the period 1980 to 2016. Various econometric techniques including cross-sectional dependence, panel unit root test, panel cointegration test, panel causality test, and dynamic seemingly unrelated co-integration tests were used. Their finding confirmed the existence of the environmental Kuznets curve hypothesis in the region. Furthermore, two and one-way causality among the variables have been found. Financial development has not had a significant effect on carbon emission whereas energy utilization has a significant effect on carbon emission and globalization increases the quality of the environment. Saud et al. (2020) examined the effects of financial development and globalization on the ecological footprint in 49 BRI countries for the period 1990 to 2014. Pooled mean group model has been used for long-run estimation and their finding showed that 1% increase in financial development ecological footprint sparks off by 0.0211% whereas 1% increase in globalization mitigates the ecological footprint by 0.0038%. Saud and Chen (2018) studied the role of financial development on energy demand in China including globalization from 1980 to 2016. For empirical analysis, they employed an autoregressive distributed lag model and the finding showed that financial development enhance the energy demand, whereas globalization has negative and significant effect on energy demand in China. Saud et al. (2019) examined the nexus among income level, financial development, and environment in 18 central and eastern European countries from 1980 to 2016 under the prospect of BRI, for empirical analysis they used FMOLS, DSUR and Dumitrescu-Hurlin test for causality. Their result concluded that income and financial development negatively affect the environment, energy utilization decreases environment quality. Further, they also found the presence of the environment Kuznet hypothesis. Finally, another study conducted by Shujah ur, Chen et al. (2019) investigate the effect of financial development, energy utilization, and economic growth by incorporating the bio-capacity and human capital in the study in 16 central and eastern European economies over the period 1991 to 2014. For empirical analysis, they employed the DSUR model and for robustness checking they employed FGLS and GMM modeling in the study and their result confirmed the N-shape curve in the region. Energy consumption and financial development increased environmental degradation and they also found two and one causality among the variables.
Ahmad et al. (2021) evaluated the dynamic association among financial globalization, economic growth, urbanization, economic innovation and ecological footprint in G7 countries over the period (1980–2016). Their finding indicates that eco-innovation and financial globalization lower the ecological footprint and association of economic growth and an ecological footprint found environmental Kuznet cure in the region, whereas urbanization promotes environmental degradation. Guo et al. (2021) evaluated the influence of green innovation and investment in the energy industry of China over the period 1995 to 2017. They employed CS-ARDL and AMG model and they found the existence of EKC hypothesis in China. Ahmad et al. (2020) examine the effect of foreign direct investment and financial development in BRI countries and they found the existence of ECK hypothesis. Furthermore, they also found that FD development destroys the environmental quality and FDI improves the environmental quality.
Energy utilization can lead to an increase in economic growth as a result of environmental pollution increased. Energy usage produces combustion goods that are mainly related to
Sarwar (2019) examined the influence of urban income and expenditure on carbon emission and used a data set of 30 provinces of China from 2005 to 2015. His finding reported that both the industrialization and urbanization are the leading cause of carbon emission and forest management is useful to overcome the emission. Lv et al. (2018) examined the effect of urbanization on the energy intensity in 30 provinces of China from 1990 to 2015. Their results showed that urbanization has a positive and significant association with energy intensity, however, a higher level of urbanization portraits a negative effect on energy intensity. Similarly, another study was conducted by Sarwar and Ibrahim (2019) to evaluate the effects of urbanization and urban income on
Global warming has become an important environmental problem, that is, mainly attributed to carbon dioxide emissions. There are various studies relating to carbon emission. Some studies used granger causality between the economic growth and carbon emission by employing vector error correction and multivariate co-integration approaches such as Ang (2007) and Soytas and Sarı (2009) and some studies used the environment Kuznet curve. Since the theory behind the environment Kuznet curve originated in the 1990s, initially this idea was presented by Kuznet (1955). Several economists and researchers focused their concentration on the environment linkages under the framework of the environment Kuznet curve in their empirical and theoretical analyses (Brock & Taylor, 2004; Grossman & Krueger, 1991; Shafik & Bandyopadhyay, 1992) and it was supported by many researchers in their empirical studies (Selden & Daqing, 1994; Vincent, 1997). Carbon emissions are closely related to economic development. As per the environment Kuznet curve theory at the early stage of economic development, environmental pollution, increased but it’s tended to reverse at the income turning point (Grossman & Krueger, 1991). There are three stages of the environment Kuznet curve which showed that initially economic growth deteriorates the environment quality at the threshold level, after reaching the maximum point then curve moves downward so, the carbon emission and economic growth relationship is negative (Jun et al., 2021) Many scholars tested environment Kuznet curve in their studies like ) Mrabet and Alsamara (2017), Rafiq et al. (2016), and Charfeddine and Mrabet (2017), they confirmed the presence of the environment Kuznet curve while Ozturk and Acaravci (2013) and Al-Mulali et al. (2015) rejected the existence of the environment Kuznet curve in the lower middle and low-income countries and confirmed the presence in high income and upper-middle-income countries. Acheampong et al. (2019) also confirmed the environment Kuznet curve hypothesis in the sub-Saharan countries. According to Salahuddin et al. (2018) and Farhani and Ozturk (2015) an environment, Kuznet curve study inveterate that an increase in GDP does not always reduce carbon emission. Whereas, Cicea et al. (2014) and Ibrahim and Law (2014) conducted a study on cross-sectional data and concluded mixed findings. Sarwar et al. (2019) studied the association among economic growth, health, education, and
Variables and Data Source
The purpose of this study is to empirically investigate the effects of Belt and Road Initiative on environment degradation. For this, we used carbon emission as a proxy variable to capture the environmental effects of BRI. To measure the effect of belt and road we used 03 dummy variables as a major regressor of interest, that is (BRC, Post, and BRC × Post), whereas the database of World Bank indicators provides GDP per capita, energy consumption, trade openness, population, and carbon emission, whereas data of financial development is extracted from International Monetary Fund. The summary statistics are portrayed in Table 1.
Summary Statistics and Description of the Variables.

Figure 3 presents the distributions of trade openness, GDP development in 130 countries of the world. Data has been classified into four major classes using the “Quantile or Equal Frequency” method of data distribution and visualization. This method divides the total number of data values by the number of classes and ensures that each class contains the same number of data values. Figure 3 shows that the first class has zero range of values as there is no data about some countries which are not part of our study. It has been shown with the lightest shade of the blue color. The second class having range 0.001 to 56.014 is shown with light blue color while the third category ranging from 56.015 to 88.273 has a darker shade of blue color and the fourth and last category which ranges from 88.274 to 2,282.205 has been shown with the darkest shade of blue color in the image and it shows the highest value for trade openness variable. Similarly, Figure 4, shows the distribution of GDP per capita, and Figure 5, presents the distribution of energy consumption in 130 countries’ along with their respective classes.

The distribution of trade openness.

Distribution of GDP per capita.
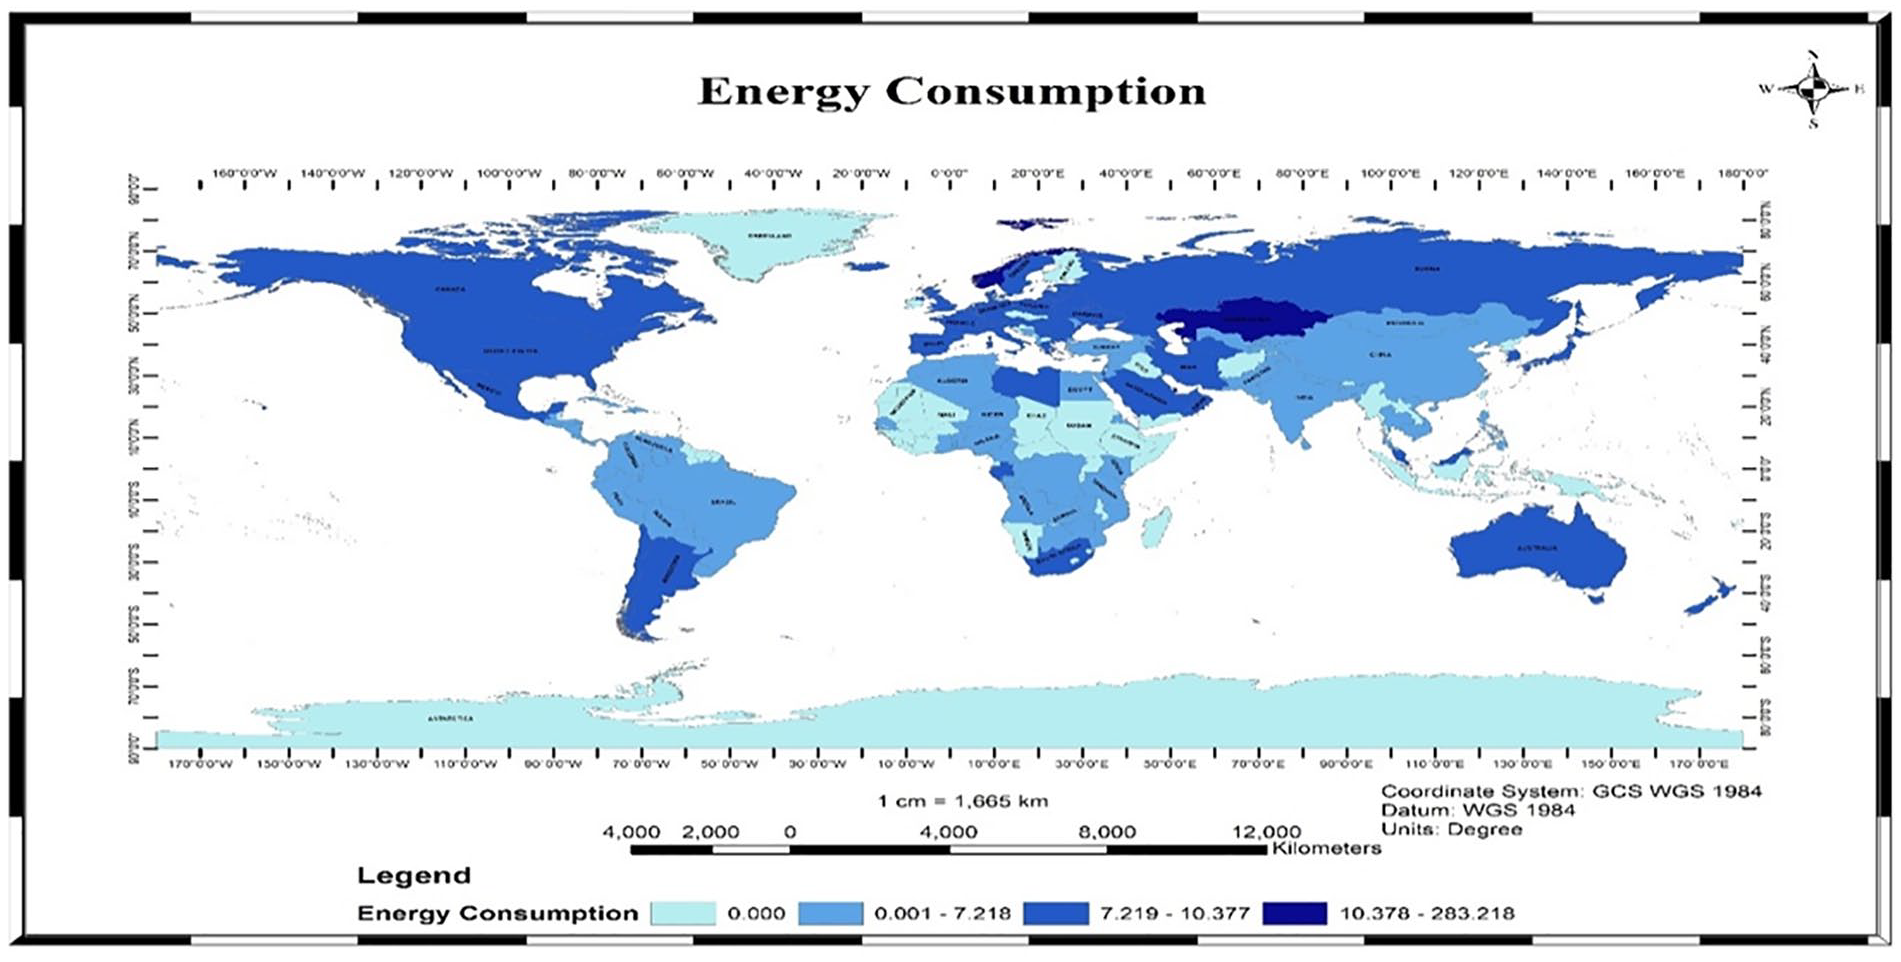
Distribution of energy consumption.
Methodology
Before estimating the formal regression analysis we check the rationality of the model. For normality of the data we used a kernel distribution plot, Figure 6 illustrates that data is normally distributed. Table 2, presents the coefficient estimates of the correlation matrix. The outcome of the matrix indicates that there is no sever correlation among the variables, further this study used variance inflation factor to examine whether multicollinerity exist or not in the model and the average variance inflation factor score is 5.32 which is lower than 10 which indicate that model is free from the multicollinearity problems. We used Breusch-Pagan/Cook-Weisberg test Table 3 to detect the heteroskedasticity problem in the data our null hypothesis is H0; constant variance which is rejected by Breusch-Pagan test because p-value is less than level of significance of 5%, that is (0.0000 < 0.05) so, to overcome this problem we used regression analysis with robust command.
Correlation Matrix.

Breusch-Pagan/Cook-Weisberg Test for Heteroskedasticity.


Kernel distribution plot.
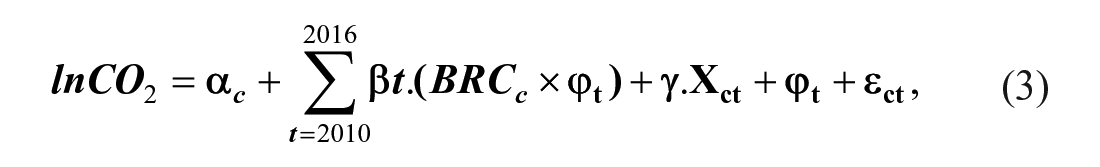
The “Belt and Road Initiative” (BRI) can be considered as a policy experiment. Therefore, this study used the difference in difference approach to examine the environmental effects of China’s Belt and Road Initiative. This technique requires dividing the sample into two groups, that is, the control group and treatment group depend on whether or not these counties respond to the “Belt and Road Initiative”. As many economies respond to BRI as one and other as of January 2021, there are listed 140 countries on the online portal of the BRI but we excluded in the sample all those countries that joined the BRI after 2018. So we are left with balanced panel data for 130 countries during the period 1990 to 2018, where 89 countries are BRCs and 41 countries are non-BRIs. To quantitatively investigate the impact of the BRI on environmental degradation to BRCs, we employ a standard difference-in-differences (DD) approach and estimate the following regression model:

where
The control variables include regressor domestic product per capita, energy consumption, financial development, trade openness, and population and hence variables are selected based on existing studies, such as Jun et al. (2021), Li et al. (2021), Mahadevan and Sun (2020), Liu and Hao (2018), Muhammad et al. (2020), and Ahmad et al. (2018) Our major explanatory variables is (BRC × Post), which captures the differences in before and after treatment changes of the dependent variable between BRCs and non-BRCs. Our control variables include logarithm of gross domestic product (constant US$ 2010), Square term of the logarithm of gross domestic product is used to determine the EKC hypothesis, logarithm of energy consumption (kg of oil equivalent per capita), trade openness (percentage of GDP), total population in million, and financial development index are used as control variables, whereas data has been collected from the database of the World Bank Indicators and International Monetary Fund.
To proceed with the DD approach as the identification strategy we employ BRC as the treatment variables, allowing BRC as treatment group whereas, non-BRC as a control group because belt and road was launched on September 07, 2013, so, we use the years in and after 2013 as the post-treatment period. The coefficient value of
For robustness of the baseline findings, regardless of a vector of country explicit characteristics are controlled in equation (1) there remains concerns about the exclusion of important factors that can influence on environment degradation such as unobserved factors. As a remedy to address the potential issue bias, we generalize the standard DD approach through estimating the following fixed-effect model, for the robustness check of the results.

where
For the identification of the difference-in-difference (DID) approach, parallel trend assumption (PTA) is needed, Parallel trend assumption required that outcome changes should follow the same trend between BRC and non-BRC before the initiation of the Belt and Road Initiative. If this identifying assumption is met, it is sensible to expect that outcome should continue to change in parallel between BRC and non-BRC if the Belt and Road Initiative had not been implemented. In such a case, the differences in outcome changes after the implementation of the belt and road initiative can be attributed to the causal impacts of the Belt and Road Initiative. To investigate the parallel trend assumption and lagged effects of BRI we estimate the following model.
where
Results
Table 4 reports the estimated result of equation (1) using
The Effects of BRI on Carbon Emissions.

Note. Robust t-statistics in parentheses.
p < .1. **p < .05. ***p < .01.
However, our major regressor of interest (BRC × Post) in column (3) is positive and insignificant but it turns out to be significant and positive at the 1% in column (4). It advocates that the Belt and Road Initiative asserted a significant impact on carbon emission and the result seems to be not a counter initiative at the first glance, as we do observe substantial growth in carbon emission between China and Belt and Road countries 8% and 5%, respectively. However, when we do a casual inference on the impacts of BRI we need before and after treatment like (before and after 2014) outcome of carbon emission of BRC group exceeds that of the non-BRC group to reach a significant and positive impact of the BRI on carbon emission to BRCs. The finding of DD estimation supports this requirement implying, that BRI increases carbon emission in belt and road countries on average and our findings are very close to Ascensão et al. (2018).
As regard control variables, the coefficient value of GDP is negative and highly significant. So, economic growth can reduce carbon emission and this result is in line with Liu et al. (2018) that upgrading the economic structure can assist to reduce carbon emission. To capture the nonlinear environment Kuznet curve hypothesis association between GDP per capita and carbon emission the squared term of GDP per capita is showing highly significant and positive in all the models. The coefficient value of GDP and GDP2 turn out negative to positive and there is no certain evidence for the presence of the EKC for carbon emission. These findings contribute to the literature on the long debate of the reliability and presence of the EKC employing the multinational data such as Liu and Hao (2018), Stern (2004, 2017), Chow and Li (2014), Ozturk and Acaravci (2013), and Al-Mulali et al. (2015), while energy consumption has a positive and significant effect on carbon emission. Moreover, financial development and trade openness may reduce
For baseline result, we again test the equation (1) using ln
The Effects of BRI on Composition of Carbon Emissions.

Note. Robust t-statistics in parentheses.
p < .1. **p < .05. ***p < .01.
Robustness Check
For robustness of the baseline findings, regardless of a vector of country explicit characteristics are controlled in the equation (1) there remains concerned about the exclusion of important factors that can influence on environment degradation such as unobserved factors. As a remedy to address the potential issue bias, we generalize the standard DD approach through estimating the following fixed-effect model, and for the robustness check of the results.

where
Robustness Check Through Fixed Effect Model.
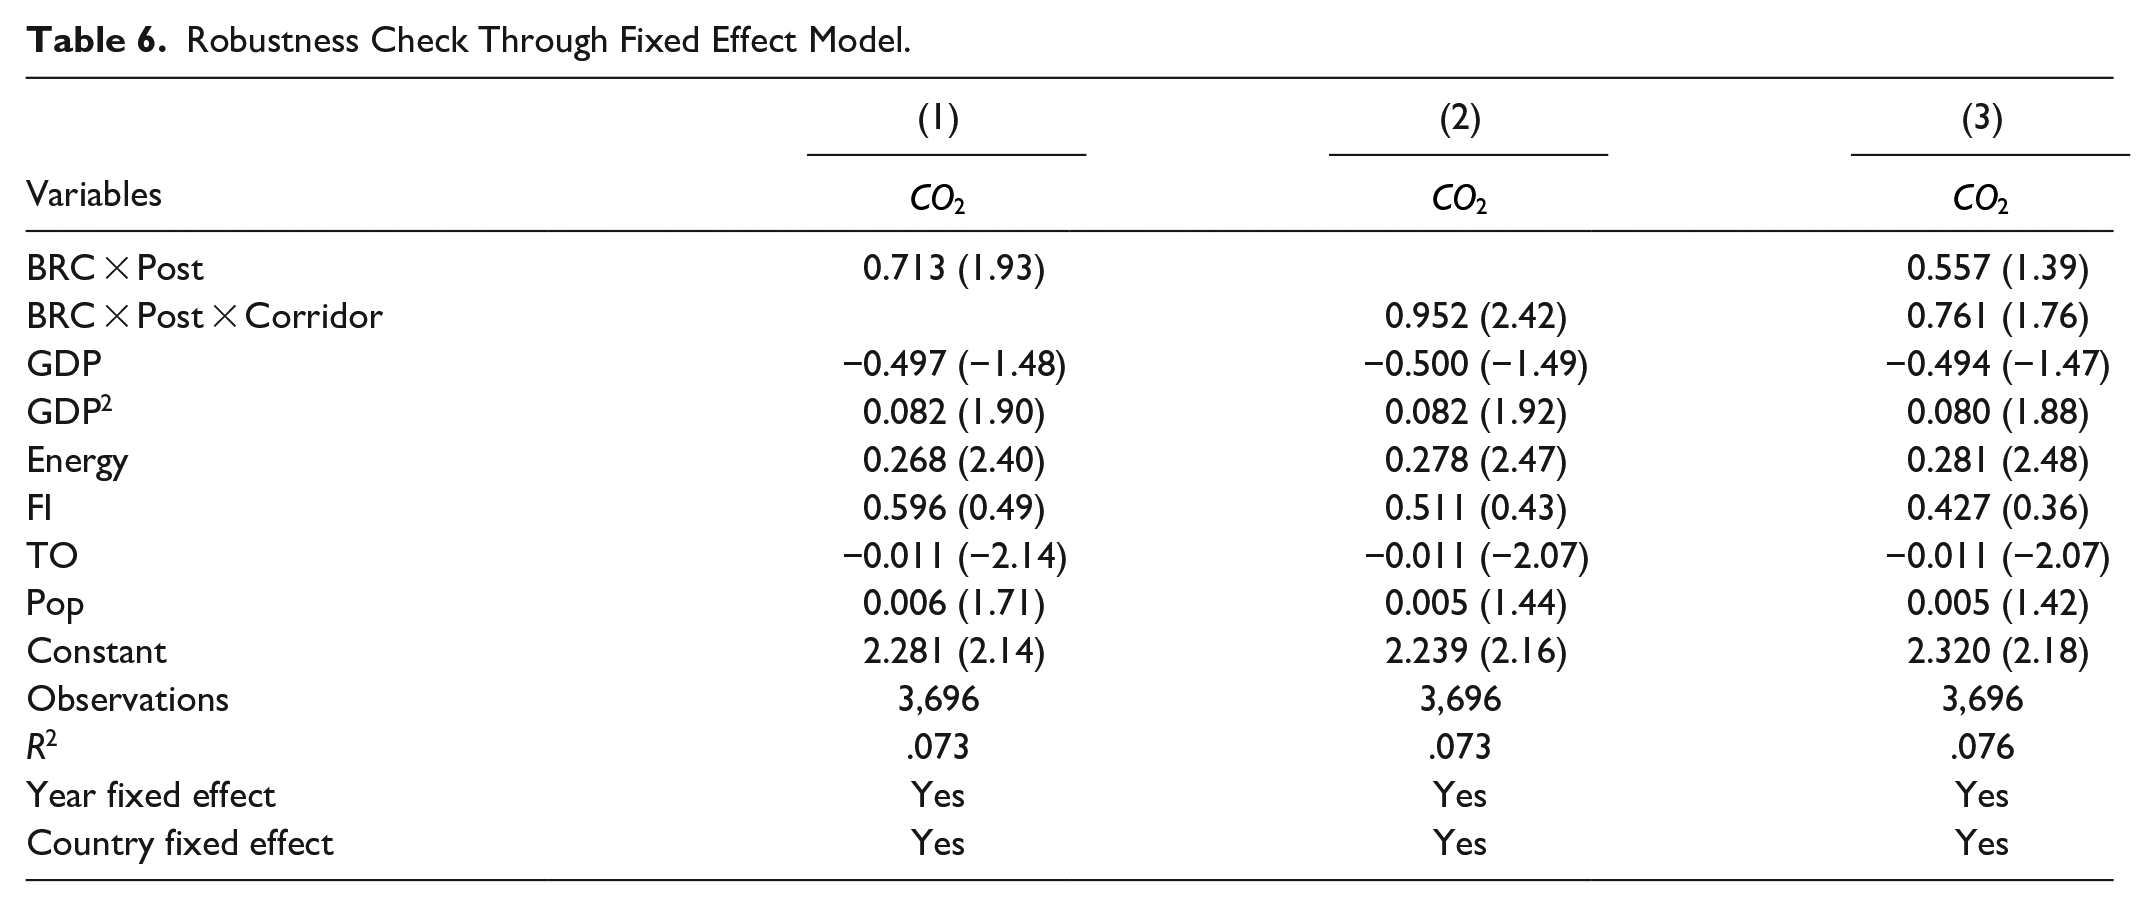
Finally, for more rigorous the finding we used the composition of the carbon emission by including country fixed effect and year fixed effect in the fixed-effect model. Table 7, column (1) to (4) shows that the estimated coefficient on the interaction term
Robustness Check by Incorporating Year and Country Fixed Effects.

Results of Parallel Trend Test
Table 8 presents the estimated results of the parallel trend test and the results show the estimated result of the logarithm of carbon emission. The coefficient of interaction terms (BRI*Year2010, BRI*Year2011, BRI*Year2012, and BRI*Year2013) are statistically insignificant suggesting that trend in carbon emission in BRI and non-BRI countries was similar before the launch of the BRI in 2013. Moreover, the estimated coefficients (
Parallel Trend Estimation.

Figure 7 indicate that the estimated coefficients of

Parallel trend hypothesis.
Additionally, we check the impact of BRI on carbon emission in belt and road economic corridor countries, because these counties are considered more closely attached to BRI, so we identify a subset of the BRCs along with the 06 economic corridors of the BRI. For this, we define ‘corridor’ as a dummy variable, which takes value = 1, for countries along the BRI corridors otherwise zero. Further, we introduced an interaction term, that is (BRC × Post × Corridor) in the fixed-effect model of equation (4), similarly, results of Table 9, column (1) to (4) shows that the impact of BRI on carbon emission is positive to BRI economic corridor countries which is consistent and robust with baseline results.
Robustness Check for Countries Along the BRI Economic Corridors.
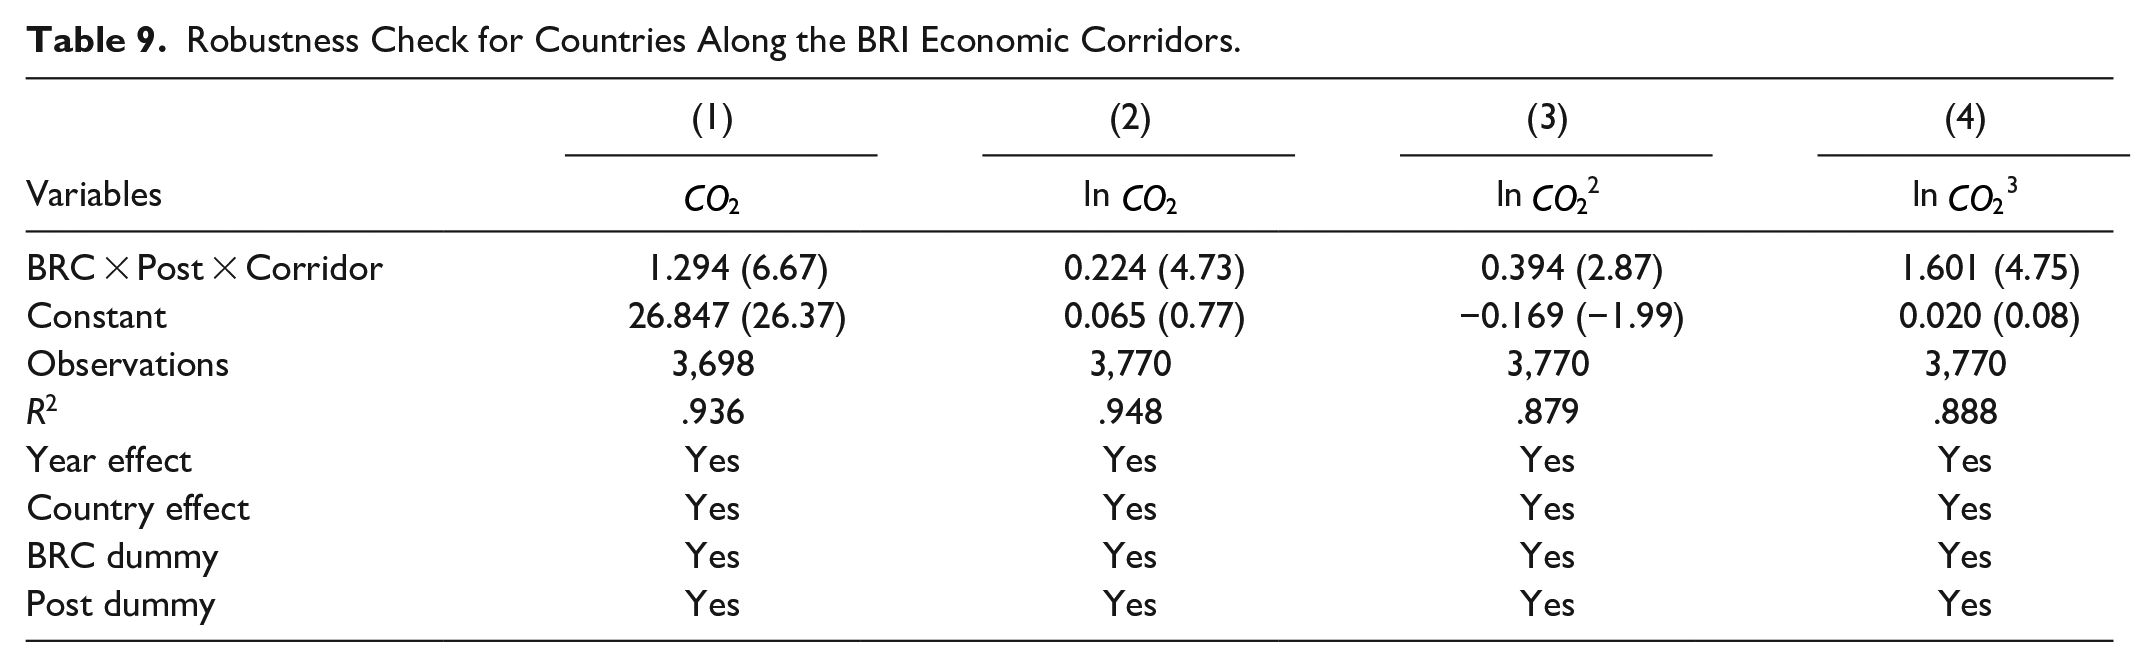
Table 10 presents the additional check on the presence of the environment Kuznet curve and it concludes that there is no evidence for the existence of the EKC because GDP and square term of GDP turn negative to positive. Furthermore, we also check an additional test in Table 11 by sequentially introducing the control variables by using carbon emission and the natural logarithm of carbon emission as the outcome variables and the result seems robust with the estimation approaches.
Additional Robustness Check for Environment Kuznet Curve.

Adpoditional Robustness Check Impact of BRI on Emissions.

Note. Robust t-statistics in parentheses.
p < .1. **p < .05. ***p < .01
Conclusion and Policy Implications
This research study presents an attempt to empirically examine whether the BRI promotes environmental degradation in BRI countries, for this, we take a study period from 1990 to 2018 from 89 BRI countries and 41 non-BRI countries. Carbon emission is the dependent variable, that is, used as a proxy to represent environmental degradation. Our major explanatory variable of interest is the interaction term, that is (
As the result of study showed that China’s BRI promote carbon emissions in BRI participating countries. To combat with carbon emission along the BRI route various efforts have been seen by the Chinese Government to mitigate climate change, reduce ecological effects, and protect the environment through building the green Belt and Road Initiative as per the Paris agreement and UN Sustainable Development Goals of 2030. The Chinese Government issued various circulars to all their Government departments regarding awareness and to protect the environment such as “Guidance on Promoting Green Belt & Road.” Similarly, the Ministry of Ecology and Environment of China also issued a policy document titled “Plan for Cooperation in Ecological and Environmental Protection for Belt and Road Initiative” (Cheng et al., 2017), whereas, Asia Infrastructure Investment Bank also issued a document title “Environmental and Social Assessment” which provides a safeguard measure for the environment. Some belt and road countries also strengthen their local regulations such as the Pakistani Government taking necessary measures to save and to protect the environment by imposing environmental regulation on burning the agricultural waste and initiating the Billion Tree Tsunami in all provinces. Still, there exist large gaps and they are needed to take necessary measures to protect and improve the quality of the environment in BRI countries. So, this study proposed some policy guidelines.
It is suggested that the Chinese government should follow the same guidelines and policies which are implemented in China for its overseas infrastructure projects in the BRI host country. Finance such as banks and financial institutions can provide a practicable approach to instigate the high-level policy such as Asian Infrastructure Investment Bank (AIIB, 2016) has a sustainability policy that might be adhered to and that involve mandatory environmental impact assessment (EIAs) before the financial approval of development loans which may minimize the various potential effects of economic development on environmental degradation. Similarly, the Chinese Government, Chinese commercial banks, Chinese development banks, and Governments of the BRI host country’s should jointly establish and implement the environment protection standard internationally which may discourage the financial institution from their borrowing and lending to high energy utilization and high pollution industries.
The exploitation of natural resources along the BRI route has substantially increased and it also requires strict regulations to protect the environment. Similarly, the effects of the transportation supply chain for constructing the roads and railway line along the BRI route also needed close scrutiny to tackle the issue of environmental degradation, so efficient energy transportation system is needed. Moreover, an environmental protection agency should be established jointly by the Chinese governments and BRI host countries to monitor and exchange the discussion about the environmental effects of the BRI and provide solutions to protect the environment. However, the quality of the environment can also be increased at the regional level like the block of SAARC countries and other regional groups of the BRI countries can reduce carbon emission by signing the global cooperation by subsidizing and promoting the green energy investment project and by implementing the environmental regulations to overcome environmental pollution. China and BRI countries should also move their investments on green innovation by switching their industries to renewable energy. Clean energy and clean water is also the sustainable development goal that the China and BRI countries should also need to focus. Therefore, integrated efforts and solutions are also needed to achieve the agenda of SDGs 2030.
Furthermore, some of the BRI participating countries are developing countries. They are facing serious economic challenges and some of them facing energy short fall. These economies also needed stable economy and to mitigate the environmental management challenges. Therefore, Governments of all the BRI countries should take some short and long term planning to address the energy issue and to mitigate the carbon emission by considering the alternative source of green energy such as production of bioenergy from plant biomass, bio-gas, waste water treatment plants, green coal energy, and many others. Furthermore, Governments should also take necessary measures to boost prosperity, and economic growth by promoting the green trading, introducing the tax free zones and promoting the business ideas that leads to discourage the fossil fuel energy consumption. Optimization and upgradation of the industrial structure is also imperative for industrialization process to overcome energy consumption. The Governments of all BRI countries in collaboration with China should also promote green technology environment-friendly energy consumption and supportive energy infrastructure, to tackle the issue of environmental degradation by educating the peoples to invest in green projects, green technologies and renewable energy projects such as solar panel, electric vehicles, wind power, biomass, hydro power, etc.
The limitation of this study is that a total of 140 BRI counties are listed in the online portal of the BRI but the current study only explored 89 BRI countries and the rest of the countries are still unexplored. Further study can be conducted to evaluate this policy by employing the similar DID model and using the data of all BRI countries by extending the control group or further study can be conducted by employing different econometric techniques and different dependent and control variables to evaluate the BRI policy on environmental degradation. Propensity score matching technique difference in difference (PSM-DID) model can also be used to evaluate this policy further.
Footnotes
Declaration of Conflicting Interests
The author(s) declared no potential conflicts of interest with respect to the research, authorship, and/or publication of this article.
Funding
The author(s) received no financial support for the research, authorship, and/or publication of this article.