
Abstract
The main aim here is the prediction of financial errors or fraud considering how effective Altman Z-Score and Beneish M-Score models are in determining financial statement errors or frauds without traditional coefficients. Therefore, these models have been utilized to assess whether a firm has indulged in financial manipulations using a random forest technique that employs the features for both models yet is devoid of the coefficients of either. This will offer greater accuracy in predicting the issue of financial manipulation. To test the efficiency of these models, we analyze those companies that were subject to an administrative fine by the CMB, assuming that in the year in which this fine was levied, and aldo in the previous year, these companies engaged in financial manipulation. The research focuses on firms operating in Borsa Istanbul between 2018 and 2022, those subject to administrative fines, and, for comparison, firms from the same sector that did not receive any penalties. This comparison aims to evaluate the consistency of the outcomes obtained from the models and assess whether such outcomes would correspond to the real findings. The novelty of this research is an integration of random forest analysis with the Altman Z-Score and Beneish M-Score variables to make a coefficient-free prediction about financial fraud, hence shedding new light on the use of these models in fraud detection.
Plain Language Summary
The main aim here is the prediction of financial errors or fraud considering how effective Altman Z-Score and Beneish M-Score models are in determining financial statement errors or frauds without traditional coefficients. Therefore, these models have been utilized to assess whether a firm has indulged in financial manipulations using a random forest technique that employs the features for both models yet is devoid of the coefficients of either. This will offer greater accuracy in predicting the issue of financial manipulation.
Introduction
In the dynamic landscape of financial markets, the ability to accurately predict and identify instances of financial fraud or errors is paramount for investors, regulators, and market participants. Fraudulent or errors occurring in financial indicators not only negatively influence the decision-making processes of companies and financial statement users, but also lead to a loss of trust and reputation for companies, as well as hindering an accurate assessment of their financial condition and performance. Moreover, companies prepare financial statements and disclosures with the primary objective of providing essential information to facilitate investment and financing decisions. As financial markets evolve, so do the challenges associated with maintaining transparency and integrity.
Since it would be of the utmost importance to management and the stakeholders of the company for them to be able to prepare for the possible financial crisis that would ultimately lead to bankruptcy, a company’s long-term survivability needs to be predicted. For that reason, financial statements have become one of the useful tools for bankruptcy risk assessment. It allows the stakeholders to see into the future, through analysis of financial statements and their ratios as presented by the company. This view is supported by Delen et al., 2013; Liang et al., 2016; Shalih & Kusumawati, 2019: 64). Financial statement manipulation refers to an act of intentional misrepresentation or changes within a company’s financial statement to show a fictitious picture of its financial status or performance. Various techniques have been thoroughly examined to detect the manipulation of financial statements. One widely used and simple approach to identifying fraud is ratio analysis (Kaminski et al., 2004; Kanapickienė & Grundienė, 2015; Omar et al., 2014), which involves scrutinizing key financial ratios, such as liquidity, profitability, and solvency indicators, to identify anomalies or deviations from historical trends (Kliestik et al., 2020; Serrano-Cinca et al., 2019). The application of ratio analysis serves not only in the identification of fraudulent activities (Somayyeh, 2015) but also in the evaluation of the financial health of companies sharing analogous structural characteristics. A financial health model must be formulated to proactively assess a company's financial stability, enabling timely measures to mitigate the factors that may lead to bankruptcy. This precedes bankruptcy and can be detected in advance through the application of a specific model (Shalih & Kusumawati, 2019). Several models are essential for ensuring the timely implementation of the measures required to mitigate the adverse consequences of this unfavorable situation. Bankruptcy prediction models are mathematical functions that utilize financial ratios to forecast whether a commercial enterprise will either persist or cease its operations. One prominent methodology in this regard involves the combination of five financial ratios referred to as the Altman Z-Score (Altman, 1968). Alternatively, the Springate S-Score is only one of several bankruptcy prediction models, and its accuracy may vary depending on the specific context and the data used (Springate, 1978). Springate initially employed 19 widely recognized financial ratios. Nevertheless, following retesting, he ultimately selected four specific ratios as the criteria for classifying companies into the categories of healthy or potentially bankrupt companies (Shalih & Kusumawati, 2019: 64). The other well-known bankruptcy prediction model is the Ohlson (1980), also known as the Ohlson O-Score, developed by James Ohlson in 1980. According to this model, four fundamental factors - the company size, financial structure indicators, performance metrics, and current liquidity measures—were analyzed using a logit model to assess their impact on the likelihood of bankruptcy. Nine financial ratios were used to represent these factors (Begley et al., 1996: 273). The Ohlson O-Score model assigns importance levels as in all other models, which are combinations of financial indicators, to these financial indicators or ratios, and combines them into a single score (Turk & Kurklu, 2017: 3). Fulmer's solvency prediction model stands out because it incorporates a broader range of indicators than any other existing method does, making it widely recognized for its enhanced reliability. Additionally, this model considers company size to be a significant factor in its predictions (Fulmer et al., 1984; Kasilingam & Ramasundaram, 2012: 67–68).
In the literature, there are various models similar to these that utilize different financial indicators to determine financial distress, financial health or bankruptcy; these models have a wide range of numerical values (Fachrudin, 2020; Kliestik et al., 2020; Sehgal et al., 2021; Taffler, 1983; Zmijewski, 1984). It is expected that businesses with poor financial health are more prone to financial manipulation. Therefore, some studies have also assessed whether businesses engage in financial manipulation while examining their financial health (Almubarak et al., 2023; Aviantara, 2023; Llobet-Dalmases et al., 2017; Svabova et al., 2020). Moreover, studies concurrently addressing the control of financial distress and financial manipulation are present in the literature (Akra & Chaya, 2020; Knežević et al., 2021; Kukreja et al., 2020; MacCarthy, 2017; Mahama, 2015; Mavengere, 2015; Nyakarimi, 2021; Ofori, 2016).
Financial analysts, investors, and creditors all frequently employ several models to develop comprehensive financial analyses so as to obtain an accurate diagnosis of a company's level of financial health and chance of bankruptcy. (Altman & Hotchkiss, 1993; Halteh & Tiwari, 2023; Handoko et al., 2020; Horváthová & Mokrišová, 2018; Liodorova & Voronova, 2020; Platt & Platt, 2006; Safiq & Seles, 2019; Srikanth, 2021; Vavrek et al., 2021). It is not possible to estimate financial distress with high probability using one model. Anticipating financial distress would require a predictive tool or model to identify the possibilities of bankruptcy.
Therefore, in practice, analysts often incorporate the combination of these models and other qualitative and quantitative factors to reach a broad perspective on the financial condition of a company and the associated risk of distress.
Financial fraud and errors might have widespread effects on the stability of markets, investors' confidence, and even economic welfare in general. Traditional fraud detection methods clearly cannot handle such complexities inherent in modern financial markets. Advanced machine learning techniques, such as random forest, hold a very promising avenue for extending the accuracy of fraud prediction models. In the literature, there are studies using machine learning techniques to detect financial fraud (Achakzai & Peng, 2023; Bao et al., 2020; Cecchini et al., 2010; Goel & Uzuner, 2016; Kleinman et al., 2020; Li & Wang, 2020; Lin et al., 2015; Lokanan & Sharma, 2024; Ma, 2019; Ozdağoğlu et al., 2017; van der Heijden, 2022; Xu et al., 2022a, 2022b; Zhang & Min, 2016). Financial irregularities and misstatements have the potential to destabilize markets, diminish investor trust, and, in severe cases, affect overall economic well-being. Conventional fraud detection techniques, such as simple ratio analyses or static warning indicators, are often insufficient to detect the intricate and multidimensional patterns underlying modern fraudulent practices. Consequently, an increasing number of studies have examined advanced machine-learning (ML) approaches especially ensemble algorithms like Random Forests (RF) as effective tools for identifying fraud. Cecchini et al. (2010) were among the pioneers to demonstrate that support-vector machines significantly outperform traditional ratio-based methods on U.S. datasets. Building on this, Goel and Uzuner (2016) integrated sentiment analysis derived from narrative sections of annual reports, while Lin et al. (2015) compared decision trees, neural networks, and expert-rule systems for Taiwanese firms, concluding that ML approaches generally outperform human judgment. Within the Turkish context, Ozdagoglu et al. (2017) showed that RF models can successfully flag manipulated statements, though they cautioned about overfitting risks when sample sizes are small. Although not directly focused on fraud detection, Zhang and Min (2016) illustrated how RF can effectively model complex, nonlinear interactions, a property later leveraged in financial anomaly studies. Recent literature emphasizes both the strengths and weaknesses of these models: Li and Wang (2020) found that ensemble methods produce more accurate distress predictions than single-model baselines for Chinese companies, while Kleinman et al. (2020) associated audit failures with the neglect of ML-based anomaly detection. Xu et al. (2022a, 2022b) introduced hybrid models and novel feature-selection approaches but reported declining recall when the proportion of fraudulent firms was minimal. van der Heijden (2022) revealed that high-dimensional industry-related variables can challenge the standard configuration of RF models, and Achakzai and Peng (2023) mitigated this by designing a dynamic ensemble capable of adjusting to changing data patterns. Most notably, Lokanan and Sharma (2024) highlighted that RF performance deteriorates in sparse, high-dimensional accounting data unless robust feature-pruning and resampling strategies are applied an observation that underpins the coefficient-free RF framework adopted in this research.
The study hereby focuses on two widely accepted financial indicators: the Beneish M-Score and Altman Z-Score. The Beneish M-Score, developed by Professor Messod D. Beneish, represents a quantitative measure regarding the likelihood of financial statement manipulation. On the other hand, the Altman Z-Score is an aggregate measure developed by Professor Edward I. Altman, depicting the condition of the financial health of an enterprise concerning the possibility of bankruptcy. The integration of established indicators using the predictive capabilities of the random forest model enables this study to achieve a reliable framework in pinning possible cases of financial fraud or errors in the Istanbul Stock Exchange.
The case of the Istanbul Stock Exchange, standing at the junction of Europe and Asia, is particularly captivating. As a platform where different industries and international investors meet, exchanges epitomize the complexity of a global financial world. This study adds not only to the sum of knowledge about financial fraud detection but also provides some useful insights for the benefit of stakeholders in navigating the labyrinthine nature of the Istanbul Stock Exchange. The following article discusses the choice of the random forest model and the integration of the Beneish M-Score and Altman Z-Score indicators. As we go deeper into the details of this analytical approach, the ultimate goal will be to provide market participants with an enhanced toolset for mitigating the risks associated with financial fraud and errors in the context of the Istanbul Stock Exchange. Moreover, these errors and fraud lead to incorrect judgments concerning the financial position and results of companies.
This study introduced a coefficient-free approach in fraud detection by integrating Beneish M-Score and Altman Z-Score variables with the random forest algorithm. Unlike previous studies, this method eliminates dependency on predefined coefficients, offering a more flexible and scalable predictive model. The objective of this study is to evaluate the effectiveness of a hybrid model that integrates Beneish M-Score and Altman Z-Score variables within a Random Forest algorithm to detect financial fraud. The study focuses on firms listed on Borsa Istanbul that received administrative fines between 2018 and 2022 from the Capital Markets Board (CMB) of Turkey. This study seeks to address several key questions related to the detection of financial fraud in the context of Borsa Istanbul. First, it investigates whether the Altman Z-Score and Beneish M-Score models, when used individually, are capable of classifying firms with financial misconduct. Second, it explores whether integrating these indicators into a Random Forest model enhances classification performance. Finally, the study examines the practical limitations of applying such models within the unique regulatory and market structure of Borsa Istanbul.
In line with the literature and study objectives, the following hypotheses are proposed:
In the second part of the research, the mathematical definition and historical development of the Altman Z-Score model and the Beneish M-Score model are presented together with an in-depth look at the logic and historical background of the random forest algorithm. The third section covers the dataset of the study, including information obtained from the CMB, Altman Z-Scores, and Beneish M-Scores of companies, decisions and comparisons obtained from these models. Also, the findings obtained from random forest models are presented in this section.
Research Methodology
This study aimed to utilize the random forest method for a comparative analysis of well-established and easily interpretable scoring models used to assess the financial distress or manipulation of companies listed on the BIST. For this purpose, the Altman Z-Score, Beneish M-Score, and the random forest method will be briefly mentioned.
Altman Z-Score
Altman first used multivariate discriminant analysis to predict the financial distress level of any company with five financial indicators (Altman, 1968). The five financial indicators of the Altman Z-Score model, as presented in Table 1, are used to predict the financial distress level of a company. According to this score, companies with a score higher than 2.99 are classified in the safe zone, companies with a score between 1.81 and 2.99 in the gray zone, and companies with a score less than 1.81 in the distress zone (Altman, 1968).
Financial Indicators of the Altman Z-Score Model.

Source. Altman (1968).
The Z-Score works on a threshold level, wherein a score lesser than the threshold level indicates heightened risk of financial distress, whereas a score above the same threshold indicates a lower risk thereof. This predictive tool is now essential for investors, analysts, and creditors in making reasoned decisions about the financial feasibility of businesses across various financial environments (Alareeni & Branson, 2013; Almamy et al., 2016; Cındık & Armutlulu, 2021; El Khoury & Al Beaïno, 2014; Elewa, 2022; Ko et al., 2017; Mamo, 2011; Ng et al., 2011; Sareen & Sharma, 2022; Swalih et al., 2021). The Altman Z-Score is a model of choice for recognizing and evaluating potential financial difficulties because of its flexibility and efficiency, regardless of industry or geographical location. Through the years, there have been several modifications to the Altman Z-score, each using different variables or coefficients for different types of organizational structures (Altman, 2000; Altman et al., 1995; Altman & Hotchkiss, 2006).
Beneish M-Score
The Beneish M-Score, also known as the Beneish Model, is a financial model developed by Professor Messod Beneish. The Beneish M-Score is widely used by investors, analysts, and auditors as a tool for assessing the quality of a company's financial statements and detecting possible manipulation of financial statements by companies. The M-Score is calculated using a combination of financial ratios and other accounting metrics (Beneish, 1999) mentioned in Table 2. The Beneish M-Score functions as a probabilistic model, which implies that one of its limitations is the lack of 100% accuracy in detecting fraud (Tarjo & Herawati, 2015).
Financial Indicators of the Beneish M-Score Model.

Then these ratios have their scores combined as in the bottom line of Table 2, and the result is the M-Score. The larger the M-Score the larger is the probability of earnings manipulation or financial statement fraud.
The Beneish M-Score is one of the most efficient tools in financial analysis, which is designed to evaluate signs of financial fraud. However, it is not recommended to use this scoring system alone. In order to get a more complete assessment of financial health, it is necessary to include not only the Beneish M-Score but also other financial indicators and methods of analysis. This approach facilitates a more robust and reliable financial assessment (Dimitrijević et al., 2018; Miharsi et al., 2024).
The Beneish M-Score model has been used in numerous studies to detect financial statement manipulation in various countries’ stock markets, such as Adoboe-Mensah et al. (2023), Günlük (2023), Lotfi & Aghaei Chadegani (2018), Sabli et al. (2023), and Sylwestrzak (2022). Under the scope of the Beneish model, versions and modifications have been performed with a view to using it in different national environments or specific corporate groups. Notably, the study by Küçüksözen (2005) adjusted the Beneish (1999) model to develop a model capable of revealing financial information manipulation practices common in Turkish companies. From the results of the study, 6 out of the 9 explanatory variables in the developed model were significant and helpful in detecting or predicting financial information manipulation.
The combined use of the Beneish M-Score and Altman Z-Score has caught the attention of researchers in recent academia. Individually, these are established tools, with Beneish M-Score used to detect earnings manipulation, while Altman Z-Score is known for corporate bankruptcy prediction. Recent studies recommend that the integration of both models will increase the efficiency of financial distress prediction. By marrying the strengths from both models, this hybrid model provides a more holistic and sophisticated insight, thereby improving risk assessment within a corporate setting (Bhavani & Amponsah, 2017; Lokanan, 2021; Lotfi & Aghaei Chadegani, 2018; MacCarthy, 2017).
Random Forest Algorithm
The Random Forest algorithm is one of the popular machine learning algorithms, which was proposed by L. Breiman in 2001. RF has been widely applied in the field of solving classification and regression problems by Breiman (2001), Du et al. (2015), Pal (2005), Rodriguez-Galiano et al. (2012), Liaw and Wiener (2002). RF is an ensemble learning method, which combines the outcomes from multiple decision trees for making more accurate predictions. The algorithm trains each tree in the forest on a different subset of the data, and then aggregates the results to produce a final prediction (Biau & Scornet, 2016).
This method is widely used in various fields and applications such as classification (Cutler et al., 2007; Gislason et al., 2006), regression (Borup et al., 2023; Smith et al., 2013), future importance, anomaly detection (Bakumenko & Elragal, 2022; Zhang, 2022), image classification (Bosch et al., 2007; Sheykhmousa et al., 2020), natural language processing (Amato et al., 2021; Palomino-Garibay et al., 2015; Tong et al., 2020), recommendation systems (Hammou et al., 2019; Zhang & Min, 2016), biomedical data analysis (Heutte, 2017; Mohapatra & Mohanty, 2020; Olson et al., 2016), environmental science (Hu, et al., 2017; Pengcheng et al., 2020; Zhan et al, 2018), finance (Booth et al., 2014; Emir et al., 2016; Hasan et al., 2020; Jiang & Wang, 2021; Zou et al., 2015), customer churn prediction (Idris et al., 2012; Lalwani et al., 2022; Ullah et al., 2019; Xie et al., 2009), and marketing and targeting (Burez & Van den Poel, 2007; De Bock & Van den Poel, 2010; Ekelik & Şenol, 2021; Larivière & Van den Poel, 2005) due to its versatility and robustness.
Application
The study focuses on companies listed in Borsa Istanbul from 2018 to 2022, as this period includes significant economic fluctuations and regulatory changes, providing a comprehensive backdrop for analyzing financial fraud.
In this study, companies that received administrative fines and were suspected of engaging in possible financial statement manipulation, along with companies that did not receive any administrative fines, were examined based on weekly bulletins published by the CMB between 2018 and 2022 (https://www.spk.gov.tr/Bulten). A total of 343 weekly bulletins published during the study period were scanned, and companies that were deemed to be involved in financial statement manipulation and received administrative fines were included in the sample. The text scans were performed manually, and no text analysis program was utilized. It was found that 201 companies received administrative fines during this period. Among the companies that received administrative fines, only 77 were listed in Borsa Istanbul. Among the fined companies listed on Borsa Istanbul, 13 belong to the manufacturing sector and have different subsectors. The financial institutions, which constituted the largest portion of fined firms (41 out of 77), were excluded from the study due to their fundamentally different financial structures, regulatory frameworks, and reporting standards compared to non-financial firms. Therefore, to make comparisons and predictions, another 13 manufacturing sector companies listed in Borsa Istanbul without any administrative fines were included in the study's sample. The manufacturing sector was selected because it was the most represented group among the remaining fined firms and provides a relatively homogeneous basis for analysis. The subsector information of the companies included in the study sample, which are also in the manufacturing sector, along with the administrative fine dates they received from the CMB, are presented in Table 3.
Sample of the Study.

The Altman Z-Scores of the companies included in the sample, along with the decisions derived from these values, and the values obtained from the Beneish M-Score, along with the decisions derived from these values, are presented in Table 4.
Altman Z-Scores and Beneish M-Scores.

Table 3 indicates that C1, a company in the basic metal subsector, was fined by the CMB on October 31, 2019. According to Table 4, the same company was classified as a manipulator by the Beneish M-Score model for the years 2018, 2020, and 2021. Furthermore, it was found that the company was in the distress zone in 2018 based on the Altman Z-Score. The Altman Z-Score and Beneish M-Score values, along with their corresponding decisions, for other companies not included in Table 4 but part of the sample are available in Appendix Table A1.
The Altman Z-Score classifies financial distress into three different categories. Similarly, the Beneish M-Score identifies financial errors or fraud in three different categories, and the structure of these categories is logically derived. In other words, if a company classified as a safe zone using the Altman Z-Score cannot fall into the manipulator or possible categories, which represents companies not involved in fraud or errors in the other model, it can be said that the findings obtained from the two models are similar. Additional firm-level results of the Beneish M-Score analysis are provided in Appendix Table A2.
Out of the 26 companies in the sample, 130 unique situations were analyzed using the results from two models for five years. However, it is worth noting that C6's Beneish M-Score value couldn't be calculated due to missing financial data for the year 2016. Therefore, only 129 distinct situations were considered. Table 5 provides insights on how often the two models arrived at common conclusions and when their assessments differed.
Comparison of the Altman Z-Score and Beneish M-Score.
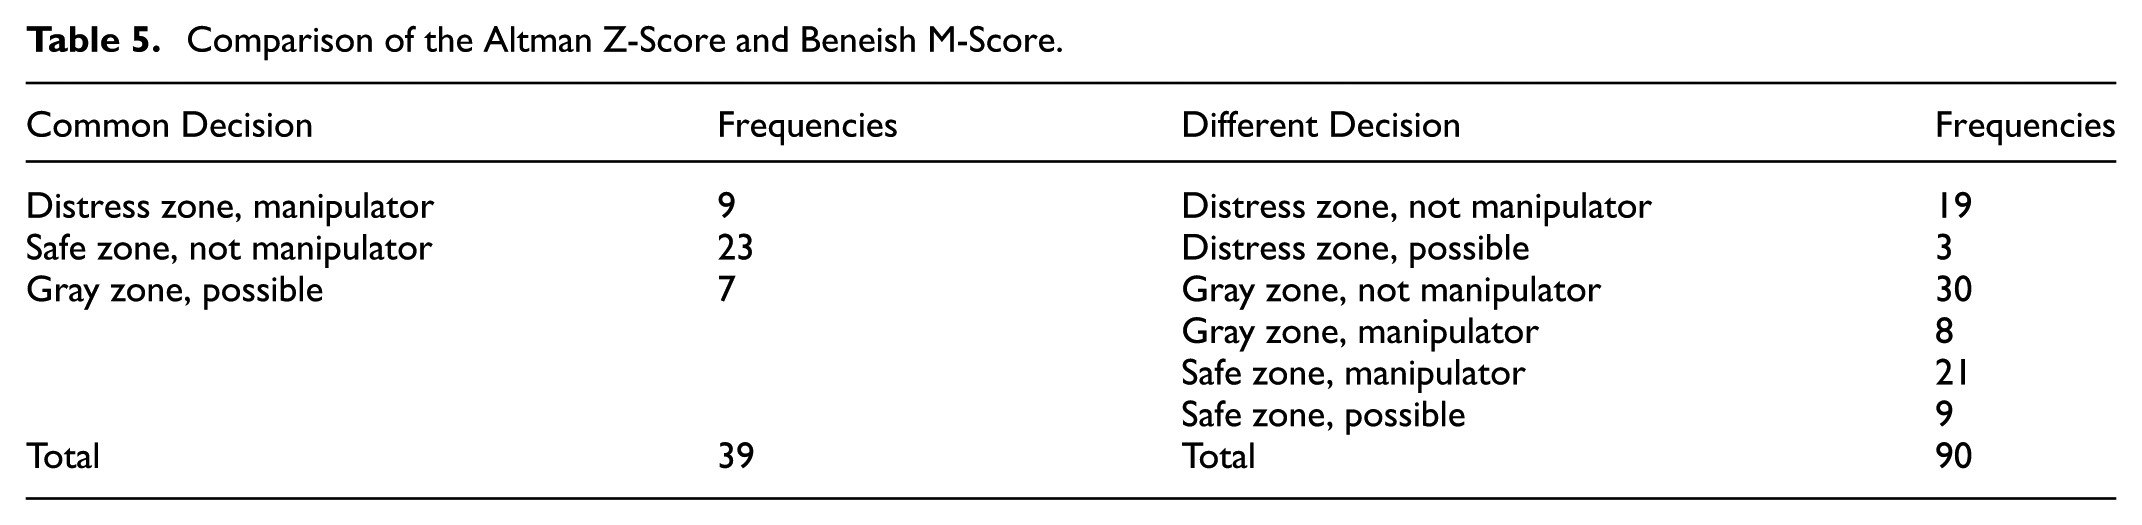
In Table 5, the term “common decision” refers to instances where the Altman Z-Score and the Beneish M-Score models yield conceptually consistent classifications, even if the specific category labels differ. Since both models operate with three-category classifications-Distress/Safe/Gray for Altman and Manipulator/Not Manipulator/Possible for Beneish- there are nine possible combinations in total. Among these, decisions were considered “common” when both models suggested a similar financial condition or risk profile (e.g., Altman's Distress Zone aligning with Beneish's Manipulator, or Safe Zone aligning with Not Manipulator). Conversely, decisions were labeled “different” when the two models produced incongruent classifications that implied conflicting interpretations (e.g., Altman's Safe Zone with Beneish's Manipulator). This categorization aims to capture conceptual agreement rather than exact label matching.
Based on the information gathered from Table 5, it is evident that they arrive at the common decision in 30% of the situations. One of the crucial assumptions of the study is to accept that in the year when CMB incurred an administrative fine, it committed financial errors or fraud both in the preceding year and in the year which it received the administrative fine. In this case, by comparing CMB with the Beneish M-Score and Altman Z-Score, it can be determined which model aligns most closely with CMB's decision.
Table 6 compares the CMB’s decisions with the classifications produced separately by the Beneish M-Score and the Altman Z-Score models. Unlike Table 5, which focuses on the conceptual alignment between the two model outputs, Table 6 evaluates each model’s alignment with the regulatory authority's decision. The CMB decisions are binary- either a firm received an administrative fine (Fine=CMB) or did not (No Fine)-while both the Beneish and Altman models operate with three possible classifications. As a result, six distinct outcome combinations arise for each comparison. It is also important to note that the total number of observations for the Beneish-CMB comparison is 129, one fewer than the Altman-CMB comparison (130), because C6’s Beneish M-Score could not be calculated due to missing financial data for the year 2016.
Comparison of the CMB with the Beneish M-Score and Altman Z-Score.

The analysis involved a comparison between the categories identified based on receiving administrative fines from the CMB and the categories derived from the Beneish M-Score, as indicated by the information gathered from Table 6. Among the 129 potential situations, in nine situations, the companies were classified as manipulators by both the CMB and Beneish M-Score, signifying common decisions. Moreover, in 59 situations, no administrative fine was imposed by the CMB, and according to the Beneish M-Score, the classification of not manipulator was determined. Out of 129 possible situations, having a common decision in 68 of them indicates that the two outcomes coincide by 52.71%. The same comparison was also conducted between the results obtained from the Altman Z-Score and CMB. Of the 130 possible situations, having a common decision in 58 of them indicates that the two outcomes coincide by 44.96%. These outcomes indicate that the Altman Z-score is less predictable in fraud detection compared to the Beneish M-score.
In the second part of the application, the categories formed by the CMB were predicted using the financial indicators related to the Altman Z-Score via the random forest method. We employed the random Forest R- package by Liaw and Wiener (2002). Seventy percent of the dataset was utilized as the training dataset, while the remaining part was used for testing. A similar analysis was performed using only the financial indicators related to the Beneish M-Score, Altman Z-Score and using both the variables related to the Beneish M-Score and Altman Z-Score, employing the random forest method. One of the purposes of using random forest is to make predictions independent of coefficients, given the consideration that the coefficients in these models may vary. The findings obtained from these three analyses are illustrated in Table 7.
Random Forest.
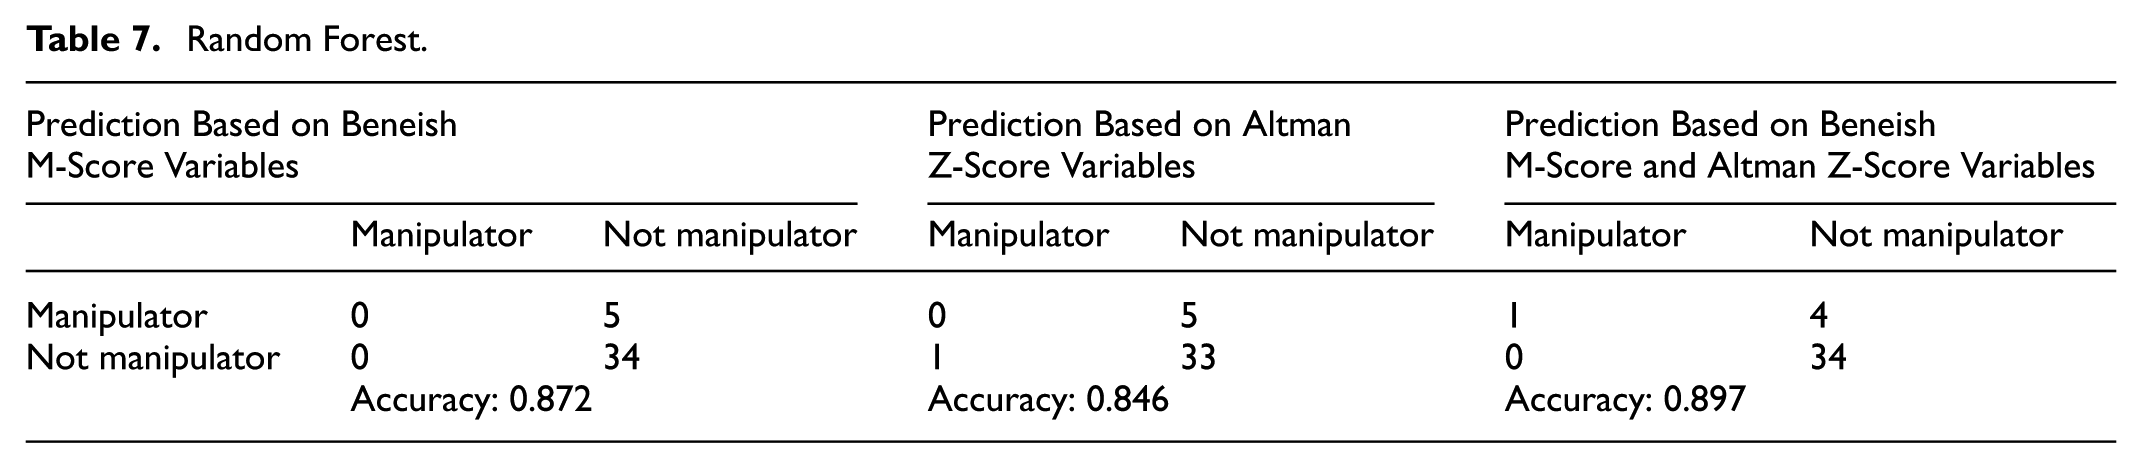
In our study, classification accuracy was used as the primary performance metric; however, since no comparative model analysis was conducted, statistical significance testing was not deemed necessary- an approach consistent with the classifier-based testing strategy outlined by Kim et al. (2016), where accuracy itself serves as an implicit proxy for testing distributional differences.
In random forest models, the predicted category (manipulator and not manipulator) is defined based on an event that has occurred, such as whether an administrative fine has been received from the CMB. Using the variables utilized in the Beneish M-Score model, the five manipulator companies in the test data were predicted and classified as nonmanipulator companies. Additionally, 34 nonmanipulator companies in the test data were predicted to be nonmanipulator companies. While these findings may seem indicative of the model's effectiveness, the primary concern lies in accurately identifying manipulator companies.
In the case of the Altman Z-Score prediction model for identifying manipulator companies, all were classified as nonmanipulator companies. In addition, a nonmanipulator company is predicted to be a manipulator. For this reason, the accuracy rate of the proposed model is lower than that of the Beneish M-Score prediction model. Although the accuracy rates obtained from these models are very high, these findings do not necessarily indicate effective results. The prediction of manipulator companies in the test data was achieved using only financial indicators derived from both the Altman Z-Score and Beneish M-Score models.
Conclusion and Discussion
The main goal of this study is to predict whether companies engage in financial fraud or error. The first step is to examine the CMB weekly bulletins from 2018 to 2022 to identify companies that have received administrative fines. This classification allows us to identify companies as either manipulators or non-manipulators. To be classified as a manipulator, a company must receive an administrative fine in a given year or the next year. Companies that receive administrative fines are designated manipulators for both the year in which the fine was incurred and the preceding year. While this regulatory-based labeling provides an objective and transparent criterion, it also introduces certain limitations. In particular, the absence of a fine cannot definitively indicate that a firm did not engage in manipulative behavior; it may simply reflect undetected or unpenalized misconduct. As such, the “non-manipulator” category may include firms that have committed financial fraud but were not officially sanctioned during the observed period. This potential label uncertainty should be taken into account when interpreting the classification results. Future studies may consider incorporating alternative fraud indicators, such as abnormal financial ratios, audit opinions, or external risk assessments, to enhance the reliability of fraud detection models.
To make the prediction, we employed two widely used scores from the literature: the Beneish M-Score, which determines whether there is financial fraud and/or error, and the Altman Z-Score, which assesses financial distress.
We employed a random forest model to estimate whether the company belonged to the manipulator or non-manipulator category, using exclusively the variables included in the Beneish M-Score, Altman Z-Score, or both. Integrating random forest with Altman Z-score variables, Beneish M-score variables, and a combination of both eliminates the need for the coefficients traditionally leading the variables in these models. Through comparative analysis, the efficacy of variables within each model in providing the most effective explanation is ascertained.
Although all three Random Forest (RF) specifications yield high overall accuracy, this metric alone masks substantial recall deficiencies. The Beneish-only model achieves perfect precision for non-manipulator firms yet fails to identify any of the five fraudulent cases in the test set. A similar pattern emerges for the Altman-only specification, which additionally produces one false-positive classification. Even when Beneish and Altman variables are combined, only one fraudulent issuer is correctly detected. These misclassifications are largely attributable to class imbalance, limited feature engineering and conservative hyper-parameter settings factors known to bias tree-based ensembles toward the majority class.
Future research should therefore explore imbalance-aware and higher-capacity algorithms, and critically assess the model’s external validity. Experiments with SMOTE-enhanced RF, gradient boosting, support-vector machines or deep neural networks may yield higher recall for rare fraud events. Moreover, while the present data set is confined to 26 manufacturing firms listed on Borsa Istanbul, the Beneish-Altman RF framework may be transferable to other sectors and emerging markets that employ comparable disclosure regimes. Sector-specific accounting conventions and regulatory environments are likely to affect model performance; thus, cross-industry and cross-exchange validations and where necessary, model recalibrations are required to establish broader applicability and robustness.
The other critical finding of this study highlights a 30% congruence in decisions between the Altman Z-score and Beneish M-score models, indicating a notable disparity between these two models. In contrast, the common decision rate derived from information obtained from Altman and CMB is 44.96%, whereas the concordance between Beneish M-score and CMB is observed to be 53.71%. The combined firm-level results of the Altman Z-Score and Beneish M-Score models across the 2017–2021 period are presented in Appendix Table A3.
The results show that the predictive power of Altman is not as strong within manufacturing companies, whereas Beneish tends to perform better in detecting financial manipulation. This result is consistent with the results obtained by Akra and Chaya 2020 in the case of industrial and real estate companies.
This might be a venue for future studies to explore the comparative effectiveness of models that incorporate the Beneish M-Score or Altman Z-Score with other approaches toward identifying financial distress. Such examinations may reveal the potential benefit of combining these methods for better predictive accuracy in identifying cases of financial distress.
The findings of the study provide useful insight to regulators, auditors, and financial analysts by offering a tool that is particularly helpful in the detection of financial manipulation. These can also be incorporated into regulatory systems to improve fraud detection methods in stock markets. Also, it is crucial to recognize a limitation that there might have been a difference in results had a different model, other than the random forest used for prediction, been used.
One notable limitation of this study is the modest sample size, consisting of 26 firms and 130 firm-year observations, all drawn from manufacturing subsectors listed on Borsa Istanbul. As such, the findings should be interpreted with caution and cannot be readily generalized to other sectors or broader financial markets without further validation.
Footnotes
Appendix
Altman Z-Scores and Beneish M-Score Values.

| Model | 2017 | 2018 | 2019 | 2020 | 2021 | |
|---|---|---|---|---|---|---|
| Not Manipulator C23 |
Beneish M-Score | −2.92 | −2.02 | −4.00 | −3.40 | −1.63 |
| Beneish Model Decision | Not Manipulator | Possible | Not Manipulator | Not Manipulator | Manipulator | |
| Altman Z-Score | 1.67 | 1.96 | 7.30 | 8.08 | 13.02 | |
| Altman Model Decision | Gray zone | Gray zone | Safe zone | Safe zone | Safe zone | |
| Not Manipulator C24 |
Beneish M-Score | −2.36 | −2.35 | −2.16 | −2.54 | −2.11 |
| Beneish Model Decision | Not manipulator | Not manipulator | Possible | Not manipulator | Possible | |
| Altman Z-Score | 3.56 | 3.51 | 2.83 | 4.12 | 4.14 | |
| Altman Model Decision | Safe zone | Safe zone | Gray zone | Safe zone | Safe zone | |
| Manipulator C25 |
Beneish M-Score | 15.90 | −4.38 | −2.30 | 1.64 | 11.54 |
| Beneish Model Decision | Manipulator | Not manipulator | Not manipulator | Manipulator | Manipulator | |
| Altman Z-Score | 0.75 | −0.27 | −1.30 | 0.75 | 0.74 | |
| Altman Model Decision | Distress Zone | Distress Zone | Distress Zone | Distress Zone | Distress Zone | |
| Not Manipulator C26 |
Beneish M-Score | −2.49 | −3.03 | −0.94 | −3.00 | −2.54 |
| Beneish Model Decision | Not manipulator | Not manipulator | Manipulator | Not manipulator | Not manipulator | |
| Altman Z-Score | 1.24 | 1.40 | 1.33 | 2.05 | 1.53 | |
| Altman Model Decision | Gray zone | Gray zone | Gray zone | Gray zone | Gray zone |
Ethical Considerations
This study relied solely on publicly available corporate financial data and involved no human participants, personal data, or animals; therefore, ethical approval and informed consent were not required.
Author Contributions
Çiğdem Özarı: Conceptualization, Methodology, Data Curation, Formal Analysis, Writing – Original Draft, Writing – Review & Editing. Esin Nesrin Can: Conceptualization, Methodology, Data Curation, Formal Analysis, Writing – Original Draft, Writing – Review & Editing. Özge Demirkale: Conceptualization, Methodology, Data Curation, Formal Analysis, Writing – Original Draft, Writing – Review & Editing.
Funding
The authors received no financial support for the research, authorship, and/or publication of this article.
Declaration of Conflicting Interests
The authors declared no potential conflicts of interest with respect to the research, authorship, and/or publication of this article.
Data Availability Statement
The data used in this study do not require special access or request and are available from public sources.