
Abstract
The irreversible trend of the aging phenomenon has made the call for active aging increase, which has raised concerns about promoting older adults’ adaptation to the digital wave. However, previous research has paid scant attention to examining Internet use (IU) in older populations. To fill this chasm, this exploratory study used a nationally representative sample of 1,607 older adults from the 2021 Chinese General Social Survey (CGSS) to examine the relationship between IU and related variables among older adults. Descriptive statistics displayed that the frequency of IU among older adults in China is not optimistic. Moreover, the multiple regression analysis, supplemented by dominance analysis (DA) revealed that personal education level (β = .244, deducation level = .1065, p < .001), family use of the Internet (β = −.234, dfamily members’ internet usage = .0810, p < .001), age (β = .227, dage = .0667, p < .001), learning frequency, (β = .158, dfrequency of learning = .0570, p < .001) and household registration (β = .137, dhousehold registration = .0517, p < .001) are the significant predictive variables affecting older adults’ IU (the above variable order was ranked as per relative importance derived from DA in descending order). On this basis, the author put forward relevant suggestions for older adults and proposed future research directions.
Introduction
Global demographic shifts have ushered in an era of population aging, with older populations increasing in both size and proportion (United Nations, 2022). By 2030, one-sixth of the global population will be aged 60 or above, rising to 1.4 billion (World Health Organization, 2022). In China, the aging population is especially pronounced, with the number of individuals aged 60 and above reaching 297 million by 2023 (National Bureau of Statistics, 2024). This trend underscores the growing need for active and healthy aging strategies. One promising approach is to encourage older adults to participate in IU, which may improve older adults’ physical and mental health (Zhang et al., 2023) and decrease depression and loneliness (Rikard et al., 2018). By maintaining cognitive and social engagement, IU could support active aging. However, studies on IU in older adults are limited, with existing studies mainly focusing on psychological processes (e.g., Fang et al., 2019; Liu & Wang, 2023) and rarely addressing broader factors that may influence IU. This gap highlights the need for further exploration of this important topic.
This study makes several key contributions. First, while extensive research (e.g., Özgür, 2016; Servidio, 2014) has examined IU in the general population (e.g., children and young adults), studies focusing on older adults are limited, and this work helps address this imbalance. Second, this study uses a large, nationally representative sample to explore the links between selected variables and IU, addressing the limitation of small, non-random samples in previous research, which may hinder the generalizability of the conclusion. Third, previous research on older adults’ IU is outdated due to societal changes, and this study incorporates updated socio-biographical and psychological variables. Fourth, China, with 1.032 billion internet users by 2021 (The Central People’s Government of the People’s Republic of China, 2022), potentially includes the largest number of older internet users, which offers a unique and profound context. Besides, this study, with IU as the focal dependent variable (DV), differs from the lots of extant national survey studies (e.g., Sun et al., 2023) that have used it as an independent variable (IV). Fifth, methodologically, this work marks an advance by using multiple regression supplemented by DA to quantify the rank-order determinants by relative importance.
Literature Review
Research on IU and Potentially Relevant Factors
Previous research on factors related to IU can be broadly divided into two categories: socio-biographical and psychological factors. The first research line focuses on rural groups. one example is Martínez-Domínguez and Mora-Rivera’s (2020) study which used Mexico’s National Survey on Availability and Use of Information Technologies in Households 2017 to identify the socioeconomic and demographic factors that stimulate Internet adoption and use among Mexico’s rural population within 12 and 70 years of age. In their article, they sorted out the potentially relevant variables related to IU into socio-economic variables (gender, age, education level, family wealth index, and personal occupation), social capital (i.e., IU of family and friends), and geographical location (e.g., urban or rural areas). Results displayed that the likelihood of using the Internet is higher for women, young people, and those with higher educational levels. Besides, individuals with favorable economic conditions are generally considered more likely to use the Internet. In terms of employment, those working in the business sector are more inclined to be Internet users. Moreover, there is a positive correlation between IU and an individual’s digital skills. Finally, people residing in northern regions near the U.S. border are more likely to access the internet, owing to geographical advantages and supportive policies.
Also focusing on the rural population, a more recent study, H. Li et al. (2019) used mixed methods to reveal the relationship between socio-biographical factors (gender, education level, occupation, ethnicity, family income, health accessibility, family size, age, health need factors, health accessibility) and IU related to health among 1,354 Chinese rural respondents (mean age = 44.54, SD = 10.22 years, 47.78% female). The logistic regression results displayed that variables associated with higher web-based health use include higher wealth, higher healthcare needs, and less geographic accessibility to quality services. Instead, older adults, low-income populations, and those with only primary education were significantly less likely to use the Internet for various health-related purposes.
These studies verify the potential linking of socio-biographical variables (e.g., gender, socio-economic status [SES], education level, etc.) with IU by exploring the determinants that affect IU. Accordingly, this paper proposes that socio-biographical factors should be considered when studying IU. These studies have paved the way for the selection of IVs in this research (see section Method for details). However, most of these types of studies have focused on rural populations. In addition, with the development of the research, some previously rarely studied variables (e.g., health) have also been found to have potential links with IU. Hence, in this study, the author will integrate a new set of variables based on previous literature.
The second line of inquiry has mainly concentrated on young adults. As proof, Wu et al. (2022) tested the association between depressive symptoms and IU in eighth-grade adolescents by analyzing the China Education Panel Survey (CEPS). The results of logistic regression showed that teenagers who spend 6 to 8 hr online every day, were found to have a higher risk of depression symptoms compared to those who spend less time online. This result highlighted the link between IU and psychological factors. However, with the same focus on depression, Thom et al.’s (2018) research has come to a different conclusion. Specifically, they assessed the association between patterns of IU and two mental health outcomes (depression and anxiety) by testing 126 healthy adolescents (aged 12–15). The linear regression showed that there was no relationship between use and depression, whereas IU may mitigate anxiety in adolescents with higher levels of baseline anxiety. In contrast, a recent study conducted by Guan and Tena (2025) used the CEPS dataset, revealing an interesting finding that IU is positively correlated with adolescents’ subjective well-being.
These studies highlight a potential connection between IU and psychological factors. However, there are notable limitations in this line of research. First, there is ongoing debate regarding whether the psychological effects of IU are predominantly positive or negative. Second, the majority of these studies focus on adolescents, often neglecting older adults as a sample population. Finally, while these studies have contributed to understanding the relationship between IU and psychological factors, shortcomings in data reporting are evident. For instance, prior researchers (e.g., Thom et al., 2018) frequently relied on p-values to interpret their findings. As Bowman (2017, p. 188) aptly noted, “p-values are only able to inform the binary decision as to whether or not a given treatment has an effect that is statistically significant from the null—they are unable to offer insight into the magnitude of the actual effect.”
In general, previous studies indicate that IU has a linkage to both socio-biographical factors and psychological factors. However, there are still some limitations to the extant literature. Firstly, with the continuous discussions of researchers, there are increasing variables found to be related to IU, while the variables used in previous studies are outdated, which hinders researchers from exploring this topic. Secondly, few studies comprehensively consider the impact of social-biographical and psychological factors on IU. To address these two problems, the author incorporates updated socio-biographical and psychological variables to provide a more holistic view of this topic. Thirdly, previous studies have mostly focused on the rural population or general population (e.g., young adults), with relatively less attention paid to older adults.
Research Related to IU and Older Adults
Previous research on IU and proficiency among older adults has generally been less optimistic (e.g., Ramón-Jerónimo et al., 2013). In such context, early studies have explored what factors may influence IU among older adults, treating IU as the DV, and more focused on the relationship between socio-biographical factors and IU in these researches. For instance, Chang et al. (2015) measured older adults’ IU with a self-administered written scale. They explored the links between IU and 8 initial IVs among 567 older adults (aged 60 or older) in Southern California. Bivariate analyses displayed that a total of seven (except gender) out of the initial eight IVs were statistically significantly associated with IU. Finally, the logistic regression revealed that only five IVs were found statistically significant in predicting the status of IU, with Internet access at home (p < .001, OR = 20.6) as the largest predictor, followed by job requiring IU (p < .001, OR = 6.29), ethnicity (p < .001, OR = 3.13), age (p < .001, OR = 2.66), and education (p = .012, OR = 2.43).
Another example is provided by Choi and DiNitto (2013), who employed face-to-face and telephone surveys to investigate IU among 980 individuals aged 60 and older in central Texas. Their findings revealed that only 17% of this age group were active Internet users, while 16% reported discontinuing their Internet use due to factors such as cost and disability. Moreover, never-users were significantly more likely to be Black (OR = 4.41, 95% CI [2.82, 6.91], p < .001) or Hispanic (OR = 4.69, 95% CI [2.61, 8.44], p < .001) and to have lower incomes (OR = 0.36, 95% CI [0.27, 0.49], p < .001). Similarly, discontinued users also exhibited a higher likelihood of being Black or Hispanic and having lower incomes.
Unfortunately, much of the existing research in this area is relatively dated, with many studies relying on outdated variables, predominantly focusing on socio-biographical factors. This narrow scope overlooks the potential impact of other important factors (e.g., psychological factors) on IU among older adults. Additionally, previous studies on this topic relied much on convenience sampling (e.g., Chang et al., 2015; Choi & DiNitto, 2013), which is not conducive to drawing general conclusions.
Recent studies on IU and older adults have focused on examining IU as an IV to explore its relationship with other factors (e.g., psychological factors). For example, Oh and Bae (2024) employed data from the Survey of the Elderly in 2020 conducted by the Korea Institute for Health and Social Affairs for quantitative analysis, investigating the relationship between the level of Information and communication technologies (ICT) usage (measured at a level that can utilize each function of the electronic device such as computers, the Internet, etc.) and healthy aging among 9,832 senior citizens (mean age = 73.41, SD = 6.53, female = 5,892). Their study has highlighted some important findings, namely, there is a significant negative correlation between ICT usage and older adults and depression (β = −.11, p < .001), and significant positive correlations with life satisfaction (β = .146, p < .001) and social participation (β = .243, p < .001).
Under the Chinese context, Nan et al. (2023) further advanced the research by using the 2020 China Family Panel Studies (CFPS) to examine the mechanisms linking IU and depression among older adults. Ten control variables (gender, age, marital status, education attainment, household registration, retirement, member of the communist party of China, self-assessed SES, self-assessed social class, and psychical health), one IV (IU), one mediator (interpersonal relationship) and one DV (depression) from 4,714 participants were used in regression analyses. Some interesting findings were (1) IU could reduce depression levels among older adults in China (p < .001). (2) Interpersonal relationships play a mediating role between IU and depression, that is, IU is related to higher-quality interpersonal relationships, thus reducing the level of depression.
Despite these studies discussing the impact of IU on the underlying factors or even attempting to explore the underlying mechanisms between them, there are several limitations of these studies. Firstly, these studies (e.g., Nan et al., 2023; Oh & Bae, 2024) solely utilized βs in discussing the relationship among the IVs, DVs, or the mediator, whereas β is useful in predicting the values of DVs, it cannot help the researchers know the relative importance of each IVs. Moreover, the interrelationships between IV may result in distorted β, which is considered a flawed method for explaining regression results (Mizumoto, 2023). A useful approach is to use the DA to help solve this particular issue (See Fan & Chiang, 2024). Moreover, it is premature to examine the mediating effect among older adults’ IU and other psychological factors at this stage. Since, one of the fundamental conditions for establishing mediation is that the relationships among IVs, DVs, and mediators must already be theoretically and statistically validated (Agler & De Boeck, 2017). In other words, prior research and/or established theories must confirm these relationships within a mediation framework. However, this critical prerequisite has been overlooked in these studies (e.g., Nan et al., 2023).
All in all, the above-reviewed studies paved the way to explore the factors that affect IU among older adults. There are several limitations to these types of articles: (1) these early researches mainly relied on nonrandom samples, which may compromise the generalizability of the study findings. In contrast, this study will use large-scale survey data to ensure the representative and reliability of the result. (2) Moreover, the variables used in previous studies have become outdated. This is not conducive for scholars to grasp the latest situation. To address this, this study intends to use the latest national survey and integrate a new set of variables (i.e., socio-biographical and psychological factors) related to IU verified in recent research to profile the IU of older adults. (3) Methodologically, previous studies in regression analysis over-relied on β, which not only affects the collinearity of the IVs but also hinders scholars’ understanding of the relative importance of various factors. To this end, the author employs multiple regression supplemented by DA to quantify the degree to which factors shape older adults’ IU. Bearing these in mind, this study will use the latest national data survey, combine previous research findings and comprehensively consider the impact of social biographical and psychological variables on IU of the older adults, and combine multiple regression analysis and DA to solve the following two research questions:
RQ1: What is the self-report IU of older adults in China?
RQ2: To what extent do the selected 12 variables (i.e., socio-biographical and psychological factors) predict older adults’ self-report IU in China?
Method
Research Instruments
The author chose the 2021 China General Social Survey (CGSS) as the data source. This data is China’s first nationwide, comprehensive, and continuous large-scale social survey project. This database adopts a multi-stage stratified sampling method to survey urban and rural residents aged 18 and above in 31 provincial-level administrative regions in mainland China, comprehensively and systematically analyzing Chinese society, revealing changes in various aspects such as the economy, politics, society, and culture, as well as development directions and trends in institutions, structures, behaviors, attitudes, etc. (National Survey Research, n.d.).
Dependent Variable—IU
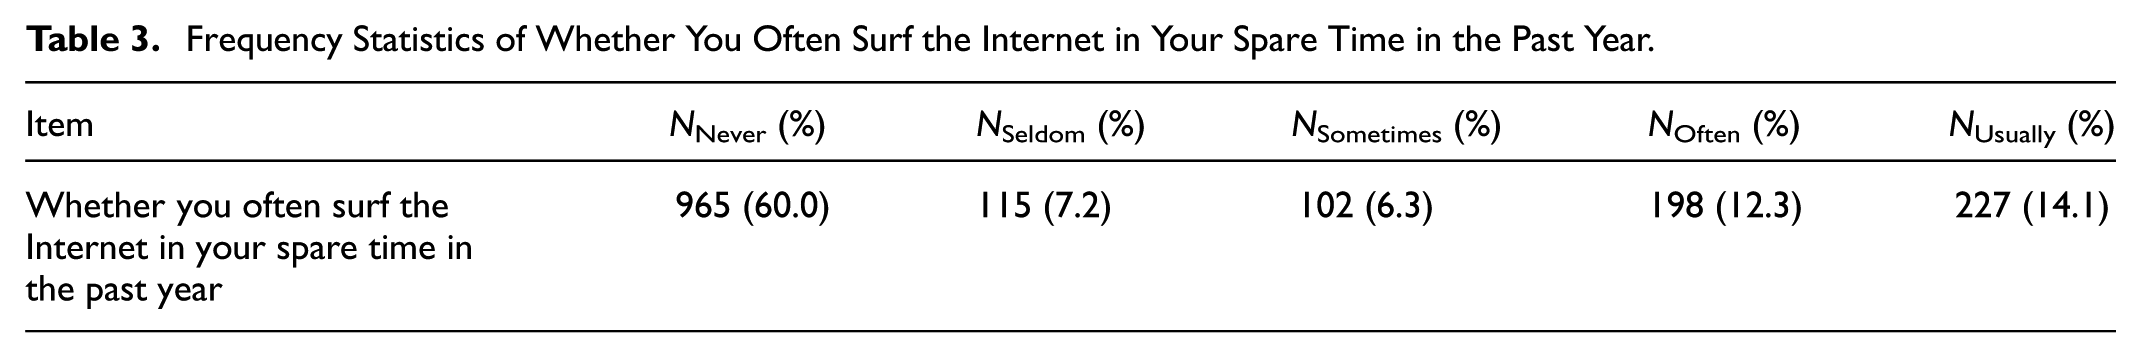
The author selected two questions related to IU as the criteria. Specifically, the item “Do you often surf the internet in your spare time in the past year” is coded using a 5-point Likert scale, ranging from 1 = never to 5 = usually. Likewise, “How often have you used the Internet in the past year (including mobile internet access)” is also coded by a 5-point Likert scale, (1 = every day to 5 = never). For ease of calculation, the author scored the opposite item for the latter question (see Tables 3 and 4). Finally, the mean value of the sum of the two questions is selected as the IU indicator.
Independent Variable—Socio-Biographical Factors and Psychological Factors
In this exploratory study, 12 initial variables have been taken into consideration based on the aforementioned evidence (see Literature review section). Specifically, socio-biographical factors like age, gender (1 = male, 2 = female), religious beliefs (1 = no, 2 = yes), household registration (1 = rural, 2 = city), educational level (1 = never received any education, 2 = literacy class, 3 = primary education, 4 = junior secondary education, 5 = vocational high education, 6 = senior secondary education, 7 = regular specialized secondary education, 8 = skilled workers education, 9 = undergraduate in Adult HEIs (short-cycle courses), 10 = undergraduate in Adult HEIs (normal course), 11 = undergraduate in regular HEIs (short-cycle courses), 12 = undergraduate in regular HEIs (normal courses), 13 = postgraduates and above, 14 = others), socioeconomic status (SES; 1 = upper class to 5 = lower class), health level (1 = very unhealthy to 5 = very healthy), frequency of social contact (1 = never to 5 = frequently), frequency of learning (1 = never to 5 = frequently), the IU of family members (1 = yes, 2 = no). These socio-biographical factors have been well validated in prior research (e.g., H. Li et al., 2019; Martínez-Domínguez & Mora-Rivera, 2020). Besides psychological factors, the frequency of depression (1 = always to 5 = never) and subjective-wellbeing (1 = always to 5 = never), which have also been shown to be associated with IU (e.g., Guan & Tena, 2025; Nan et al., 2023; Oh & Bae, 2024; Wu et al., 2022). Details on these predictor variables are provided in Table 1.
Participants’ Socio-Biographical and Psychological Information.

Note. Educational Level: what is your highest education level; Health: what do you think of your physical health condition; Frequency of social contact: Have you frequently socialized during your free time in the past year; Frequency of learning: have you often studied in your free time in the past year; SES: what do you think of your socio-economic status; Frequency of depression: how frequently have you felt depressed in the past 4 weeks; Subjective-well-being: do you think your life is happy; Family members’ internet usage: have any members of your family been online in the past 6 months.
Participants
The sample population of this study primarily focuses on individuals aged 60 and above. This selection is primarily driven by two linchpins. Firstly, considering the background of the study in China, the age of 60 is generally recognized as the threshold for older adults according to the current laws and regulations in China (National Health Commission National Office for the Older Adults, 2022). Hence, the author decided to adopt this age threshold based on the current legal standards and following the existing academic practices.
SPSS 29 software was used to screen the sample, and a total of 2,929 older adults aged 60 and above were selected from the entire sample of 8,148 participants aged 18 and above. Subsequently, the missing data was cleaned up, leaving 1,607 valid cases for analysis. The background information is presented in Table 1. Specifically, the sample consisted of individuals in their early 70s, with 51.5% (n = 826) males and 48.5% (n = 781) females. And 91.2% (n = 1,477) of participants reported no religious affiliation. Approximately 58.2% (n = 936) of participants had a rural household registration, while 41.8% (n = 671) had an urban household registration. 68.9% (n = 1,107) of the older adults reported having someone in their family who used the internet in the last 6 months, while 31.1% (n = 500) reported no IU within their family in the last 6 months. In terms of education level, these older adults have a relatively low level of education (M = 3.69, SD = 2.26), 52.7% (n = 847) have an education level of primary school or below (i.e., private school or no formal education), 26.7% (n = 429) have received junior high school education, 15.8% (n = 254) have diplomas from high school, vocational high school, or technical school, and only 4.8% (n = 77) have received college or above education. In addition, the frequency of social communication among these older adults is at a moderate level (M = 2.58, SD = 1.25), 22.6% (n = 363) of people report that they never socialize, 31.4% (n = 505) of people rarely socialize, and 20.7% (n = 332) of people sometimes socialize. People who frequently and very frequently go out are 16.3%(n = 263) and 9.0% (n = 144), respectively. Regarding learning frequency, the learning frequency of older adults is low (M = 1.78, SD = 1.16), 77.7% (n = 1,249) of people report that they study very little or even never, 10.1% (n = 162) of people sometimes study, 8.2% (n = 131) of people often study, and 4.0% (n = 65) of people have a persistent learning frequency. Overall, the SES of these older adults is relatively lower than average (M = 3.72, SD = 0.96), with 1.1% (n = 17) of people in the upper class, 67.2% (n = 108) in the upper middle class, 36.8% (n = 592) in the middle class, 29.2% (n = 469) in the lower middle class, and 26.2% (n = 421) in the lower class. Besides, these older adults have relatively healthy physical fitness (M = 3.11, SD = 1.12), 8.6% (n = 138) of people think they are very unhealthy, 21.3% (n = 343) of people think they are relatively unhealthy, 31.3% (n = 503) of people think their health level is average, and 28.4% (n = 456) and 10.4% (n = 167) of people think they are relatively healthy and very healthy, respectively. As for psychological factors, they reported feeling very happy (M = 4.07, SD = 0.83), 1.2% (n = 19) of people thought they were very unhappy, 4.7% (n = 75) thought they were relatively unhappy, 10.3% (n = 166) of people thought their happiness level was moderate, 54% (n = 867) of people thought they were relatively happy, and 30% (n = 480) of people thought they were very happy. Finally, these older adults experience generally low depression (M = 3.86, SD = 1.13), with 3% (n = 48) reporting that they always feel depressed. 10% (n = 160) of people reported feeling depressed frequently, 23.3% (n = 375) sometimes felt depressed, 25.2% (n = 405) rarely felt depressed, and 38.5% (n = 619) never felt depressed.
Analytic Strategy
This study adopts a quantitative research method, utilizing SPSS 29 and R Studio for data analysis. Specifically, the author first searched for the variables that might be relevant to the IU of the older adults according to the previous literature, and selected all the corresponding variables in the 2021CGSS survey, and initially selected 12 related variables, see (Independent variable–Social-biological Factors and Psychological Factors Section) Secondly, the author conducted three rounds of preliminary data analysis before performing regression analysis. In the first round, a series of bivariate analyses, including Spearman correlation and t-tests, were conducted to ensure the parsimony principle was not violated by the excessive inclusion of IVs in the regression models (Leech et al., 2015). As per Cohen’s (1988) benchmarks (e.g., for r, .10 as small, .30 as moderate, and .50 as large), only variables with at least a “small” effect size were considered for subsequent regression and DA. The second round of data analysis involved the application of the Boruta algorithm from random forests to identify meaningful IVs. The third round focused on verifying the assumptions that are crucial for regression analysis, such as normality and homoscedasticity.
After these preparatory steps, the author used multiple regression supplemented by DA to examine the complex interplay of predictors underlying older adults’ IU in response to RQ2. Multiple regression was employed to shed light on the effect of IVs on DVs based on β coefficients. However, recognizing that correlations among IVs could distort β. DA was used as a supplement method to identify the relative contribution of each IV by measuring the dominance weight (i.e., ΔR2) as each IV was added to all possible subsets of regression models, thus indicating the rankings of IVs (Mizumoto, 2023). Taken together, DA as one improved method for gauging the relative importance of IVs was chosen in the current study over the reliance on β. In this study, a user-friendly Dominance Analysis Calculator (online version) programed by Fan (2023) will be used to facilitate analysis.
Results
RQ1: What is the percentage of IU of older adults in China?
As aforementioned, two questions “Whether you often surf the Internet in your spare time in the past year” and “How often have you been on the Internet in the past year” were measured as the IU of older adults. These two items are both measured using a 5-point Likert scale, with higher scores indicating higher IU among older adults. Descriptive and frequency statistics are shown in Tables 2 to 4. Overall, the IU of older adults in China is not optimistic. Specifically, in terms of “Whether you often surf the Internet in your spare time in the past year?” the average score for this question is relatively low (M = 2.26, SD = 1.76), A bootstrap analysis with 10,000 samples generated a 95% confidence interval (95% CI) of [2.18, 2.33] for the means score. According to frequency statistics, nearly 60% of individuals (n = 965) reported that they had never used the internet in the past year. 7.2% (n = 115) stated that they seldom used the internet, 6.3% (n = 102) reported occasional IU, while 12.3% (n = 198) and 14.1% (n = 227) indicated often and usual IU, respectively. In the same vein, the mean score of the item “How often have you been on the Internet in the past year” describes a similar pattern (M = 2.13, SD = 1.55), with bootstrap analysis of 10,000 samples generating a 95% CI for the average score [2.03, 2.20]. Specifically, 63.3% (n = 1,018) reported that they did not access the internet at all in the previous year. A small proportion, 3.5% (n = 56), reported using the internet a few times or fewer within the year. Approximately 2.2% (n = 35) of individuals reported accessing the internet a few times per month. Additionally, 5.5% (n = 88) of the older adults reported accessing the internet weekly. Finally, 25.5% (n = 410) of respondents reported accessing the internet every day.
RQ2: To what extent do the selected 12 variables (i.e., socio-biographical and psychological factors) predict older adults’ self-report IU in China?
Descriptive Statistics on the IU of Participants.

Frequency Statistics of Whether You Often Surf the Internet in Your Spare Time in the Past Year.
Frequency Statistics of How Often Have You Been on the Internet in the Past Year.

The results of the bivariate analyses are presented in Figure 1, five IVs (i.e., education level, family members’ Internet usage, frequency of learning, household registration and age) have a “moderate” association with IU, while three IVs, including health, frequency of depression and SES are shown a “small” effect on the DV. Moreover, the remaining four IVs (i.e., subjective well-being, frequency of social contact, gender and religious beliefs) will be excluded from subsequent analysis because they failed to meet the “small” benchmark. Furthermore, the author used the Boruta algorithm from random forests (see Figure 2) to identify meaningful IVs and finally only seven IVs (i.e., family members’ Internet usage, education level, frequency of learning, household registration, age, SES, frequency of depression) were reserved. The third round of data verification was conducted to assess the fulfillment of crucial assumptions (e.g., normality and homoscedasticity) for regression analysis. Normality was evaluated using skewness (0.803) and kurtosis (−1.148), indicating a mildly right-skewed and platykurtic distribution. Both values fall within acceptable ranges for approximate normality (Kline, 2020). Homoscedasticity was assessed by plotting residuals against fitted values, which revealed no discernible pattern, indicating constant variance of the residuals across different levels of fitted values. In addition, a case-wise diagnostic analysis was conducted to identify potential outliers. Three cases were identified as outliers and removed from the initial sample (N = 1,607), based on standardized residuals exceeding +3 or −3. The revised sample size for subsequent analysis was 1,604.

Links between the socio-biographical and psychological Factors and IU.
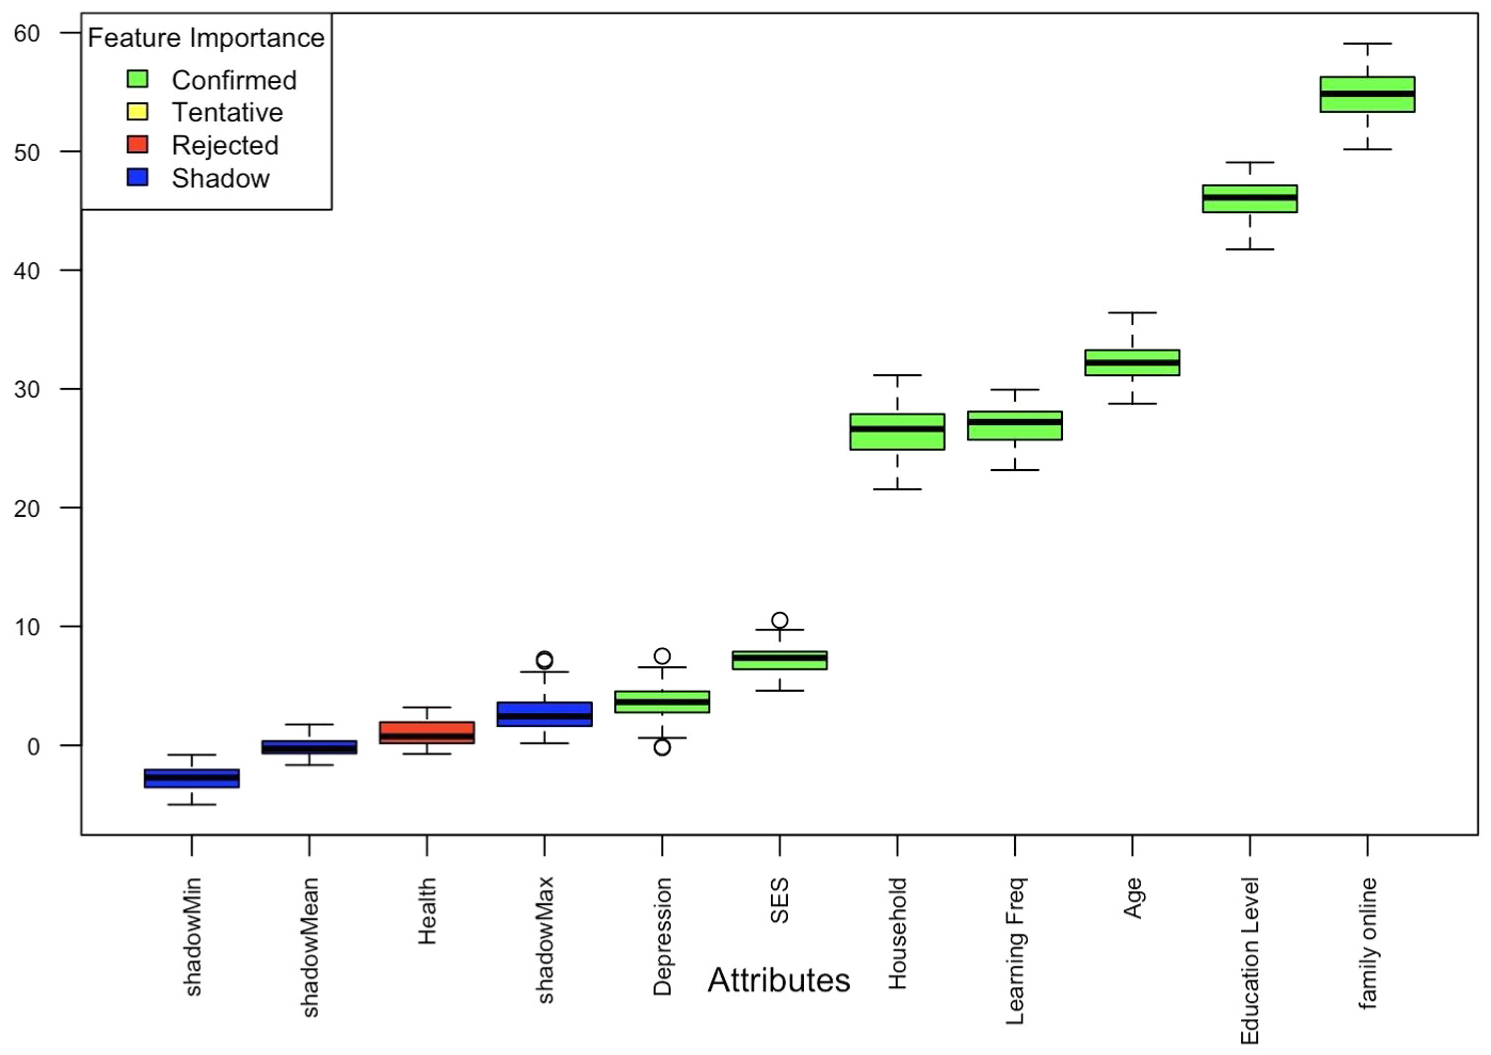
Variable Importance plot obtained from random forests using the Boruta algorithm.
Following the aforementioned verification procedures, multiple regression analyses and DA (Table 5) were conducted. Overall, two key findings emerged from these comprehensive analyses. Firstly, collectively, the eight predictors accounted for 37.6% of the variance in IU (R2 = .379). Secondly, only five IVs evidenced statistically significant positive predictive effects on IU: your education level (β = .244, p < .001), the frequency of your family online in the past 6 months (β = −.234, p < .001), age (β = .227, p < .001), frequency of learning (β = .158, p < .001), household registration (β = .137, p < .001). While IVs like your frequency of frustration and depression (β = .034, p = .103) and SES (β = −.038, p = .067) did not achieve statistical significance. In addition, DA illustrated and ranked the relative importance of each predictor: d education level (0.1065) > d family members’ Internet usage (.0810) > d age (.0667) > d frequency of learning (0.0570) > d household registration (.0517) > d frequency of depression (.0090) > d SES (.0067).
Multiple Regression With Dominance Analysis Predicting Older Adults’ IU.

Note. Educational level = what is your highest education level; Frequency of learning = have you often studied in your free time in the past year; SES = what do you think of your socio-economic status; Frequency of Depression = how frequently have you felt depressed in the past 4 weeks; Family members’ Internet usage = have any members of your family been online in the past 6 months
Discussion
To understand IU among older adults in China, this exploratory quantitative study investigated IU and its socio-biographical and psychological variables correlated in a nationally representative sample aged 60 and above. The initial description painted a rough portrait of the participants’ backgrounds, with their educational attainment generally low, with most having only completed primary schooling or less. Furthermore, their health status is comparatively good, and their SES is positioned in the upper-middle range. The frequency of their social interactions is moderate, and a significant portion of the older adults have family members who have accessed the Internet within the past 6 months. However, their own learning frequency is quite low. Psychologically, these older adults report a high level of subjective well-being and exhibit a low level of depression. In terms of question one, the descriptive analysis illustrates that older adults do not use the Internet frequently, with 60% of the older adults self-reported that they never surfed the Internet in their spare time in the past year and 66.8% of the older adults reported that they only used the internet several times or even less in the past year.
In order to reveal the reasons behind this phenomenon the author not only combines previous research findings to include a set of the latest variables that may be related to IU but also uses bivariate analyses (i.e., Spearman correlation and t-tests) and Boruta algorithm in random forests to select variables related to IU. Subsequently, this article attempts to use multiple regression analysis supplemented by DA to paint a more accurate picture.
RQ 2 probes the extent to which selected variables were linked to older adults’ Internet. The succinct answer to RQ2 is that their education level (β = .244, deducation level = .1065, p < .001), family use of the Internet (β = −.234, d family members’ Internet usage = .0810, p < .001), age (β = .227, d age = .0667, p < .001), learning frequency, (β = .158, d the frequency of learning = .0570, p < .001) and household registration (β = .137, d household registration = .0517, p < .001) are potentially important variables that affect the IU of older adults in China. Among them, the education level of individuals is the most important factor in older adults’ IU in China, namely, the higher the education level of older adults, the higher the frequency of IU. This result echoed with previous studies (e.g., Schehl et al., 2019). This phenomenon can be traced back primarily to missing scholastic opportunities and limited practical application. Firstly, this retired population born in the 1960s grew up in turbulent natural disasters and social and political upheavals, such as the Great Leap Forward and the Great Famine (1958–1962), as well as the Cultural Revolution (1967–1976), which severely disrupted the normal implementation of social construction, including education (Chui, 2012). This not only hindered the country’s Internet construction but also hindered these groups of people’s subsequent opportunities to accept Internet knowledge and access the Internet. Specifically, it was not until 1994 that the Chinese Mainland began to access the Internet (Y. Li et al., 2017), but only for business, education, and some government departments. At this time, enterprises and school institutions have established a series of metropolitan area networks or campus networks, with the main internet users being IT professionals, researchers, educators, and students (China Internet Network Information Center, 1997). Accordingly, a possible reason is that the level of education has affected the types of work of these retired generations, making them unable to engage in the above industries, thus hindering their access to the Internet.
Additionally, the frequency of family members’ use of the Internet is the second major factor affecting the older adults’ use of the Internet, which indicates that the older adults’ spouse, children, or other family members play a vital role in encouraging and teaching them to use the Internet (Chang et al., 2015). Thirdly, the younger older adults use the Internet more frequently than the older groups. However, different from the reasons interpreted by Berner et al.’s (2015) research, which suggests that this may be attributed to health-related reasons (e.g., visual impairment or movement difficulties). In this study, health has not been found to be associated with IU. Another plausible reason underlying this is the older adults’ lack of motivation and trust to use the Internet. According to Cresci et al. (2010), older adults are worried about the security and navigation of the Internet, suggesting that they find the integration of the Internet into their lives to be non-essential and are often overwhelmed by the intricacies involved in utilizing the Internet. Fourthly, despite the lack of formal learning, the acquired informal learning was found to have a positive impact on the IU of older adults, which also indicates the importance of lifelong learning. Lastly, there is a digital divide between urban and rural areas in China, with older adults using the Internet more frequently.
Based on the above findings, this study concludes that the positive development of internet behavior among older adults relies on a collaborative effort from families, society, and the government to create an older adult’s friendly internet environment. The following recommendations are proposed. Firstly, the study found that education is the biggest factor, but the lack of formal education due to historical reasons cannot be remedied. Fortunately, the study found that life learning may solve this problem. Hence, the government can strengthen both material and human resource support for older adults’ education. Materially, it should fund the University of the Third Age (U3A) and encourage them to provide digital skills training, helping older adults improve their understanding of the IU and other technology use. On the human resource side, the government should focus on training educators by developing specialized digital literacy programs and materials, while also enhancing the digital skills of current teachers to ensure older adults receive adequate and direct support. Besides, the learning environment of U3A also provides a social platform for older adults to interact and collaborate with peers (Zhang & Chen, 2024). During this process, older adults can enhance their digital literacy and sense of participation by learning technology-related content together through communication with others.
Secondly, the adaptation and integration of older adults into the digital society is a process of socialization, in which family members play an important role. To this end, family members should be encouraged to pay attention to the older adults’ IU needs and help them understand and use relevant products, to increase the older adults’ awareness of the usefulness of the Internet. Thirdly, regarding the gap between urban and rural, the government should increase the popularity of the Internet nationwide, and constantly improve and perfect the network public service system, to ensure that the Internet has certain accessibility to older adults. In addition, although the open access provided by U3A, Formosa (2011) pointed out that middle-class older adults predominantly dominate U3A participation, while rural older adults may face barriers to accessing U3A opportunities. To address this, the government could consider reducing course fees for rural older adults and providing low-cost educational support to facilitate their participation. Furthermore, the government can work closely with rural communities to facilitate the decentralization of educational resources. This could involve organizing mobile U3A initiatives, where expert teams and volunteers regularly visit rural areas to deliver face-to-face digital training sessions and lectures. By bringing educational resources directly to these communities, such initiatives would not only help to bridge the gap in access to learning but also foster greater interest and participation among older adults in digital learning. Such efforts would be crucial in encouraging lifelong learning and ensuring that rural older individuals are not left behind in an increasingly digital world.
Conclusion
With the accelerated development of China’s Internet construction, the number of young Internet users is increasing, but the Internet use of older adults is often ignored. Based on this, this study depicts the portrait of the IU of older adults in China and explores the relevant factors. As highlighted by Bollier and Firestone (2010, p. 7), existing theories and big data can “reinforce each other.” In terms of this study’s contribution, two significant aspects merit attention. First, it adopted a more comprehensive perspective by incorporating a set of the latest influencing factors, taking into account both socio-biographical and psychological variables, revealing that older adults’ prior education experience, family members’ Internet usage, age, learning frequency, and household registration significantly influence their IU. These findings enhance understanding of older adults’ digital adoption and highlight the utility of “tertiary socialization” theory (Parsons & Bales, 1956). From the perspective of tertiary socialization, in the Chinese context, disrupted early education due to historical factors can be mitigated by later-life social interactions, such as family influence and self-directed learning, helping older adults adapt to digital society.
Second, the author argues that it is premature to establish a comprehensive theory of older adults that integrates IU with socio-biographical and psychological variables. Instead, further empirical research based on representative samples of older adults is essential to advance theoretical development in this area. As Bollier and Firestone (2010) suggest, the accumulation of robust data increases the likelihood of identifying the “generators” necessary for constructing a new theoretical framework. This exploratory study anticipates that with more empirical findings, particularly from studies employing consistent or comparable IU measures, it will be possible to formulate a theory that unites IU with socio-biographical and psychological factors in the near future.
Besides, this study makes two notable methodological contributions. First, it represents one of the few efforts to utilize publicly available national surveys to investigate older adults’ IU. Given the unique advantages of large-scale datasets (cf. Yae & Yoon, 2017), the author underscores the importance of leveraging such resources for further empirical research in this domain. Second, echoing critiques of the over-reliance on β coefficients (e.g., Fan & Chiang, 2024; Budescu, 1993; Mizumoto, 2023), the study offers a template of how multiple regression analysis supplemented by DA to provide a more nuanced understanding of the relative importance of key variables.
Finally, this study yields three practical implications. Firstly, lifelong learning is the key to enhancing the digital abilities of older adults. The government should increase support for U3A and promote their provision of age-appropriate digital skills courses nationwide. Secondly, we should advocate the intergenerational help mechanism in families and encourage young adults to actively participate in the Internet learning process of older adults. Finally, attention should be paid to the urban-rural gap and the growing trend of “elitism” in U3A (Formosa, 2011). Through targeted funding, customized training, and community support, priority should be given to ensuring digital education opportunities for rural and vulnerable groups and promoting fairness in digital integration.
Despite its contributions, this study has some limitations. First, due to the use of second-hand data in this article, it cannot meet all the expected purposes of particular research, Specifically, though be taken as psychometrically valid (Bergkvist & Rossiter, 2007), the measurement of IVs is limited to single items, which may lead to general results compared to particular research. Likewise, the measurement of IU can also be more abundant, not just limited to the frequency of use. These problems also exist in studies using second-hand data (e.g., Fan & Chiang, 2024; Yan et al., 2023). Second, some important background information on older adults’ IU is missing from the 2021 CGSS. For instance, there is a lack of information regarding their interest in or willingness to use the Internet, and the percentage of social network use. This absence may hinder readers from gaining a more holistic understanding of the IU of older adults. Hence, the author suggests that future scholars conduct more refined, particular investigations on this topic. Third, as this exploratory study only employs quantitative methods to investigate the factors influencing IU among Chinese older individuals, future research on similar topics would benefit from integrating big data (e.g., national survey) with traditional “small data” (e.g., experimental evidence derived from smaller samples). As Monroe et al. (2015) suggest, the most robust knowledge emerges when researchers effectively combine the power of big data with the rigorous methods and theories of social science. Fourth, this study is situated in the Chinese context, and while its findings may provide valuable insights for other developing countries facing similar challenges related to population aging, the generalizability of the results may be constrained by cross-national differences in demographic structures and SES systems. Therefore, future research is warranted to replicate and extend this study in diverse cultural and institutional settings, to further evaluate the applicability and robustness of its theoretical and practical implications. Furthermore, since this article represents a preliminary exploration, subsequent studies could deepen the investigation by focusing on underlying mechanisms or incorporating qualitative research methods to provide more comprehensive insights.
Footnotes
Acknowledgements
Thanks to all the editors and the reviewers for their useful feedback that improved this paper.
Ethical Considerations
This study does not require ethics approval for reporting individual cases or case series
Author Contributions
Liangjie Fan: Writing—original draft, Methodology, Formal analysis, Data curation, Conceptualization, Methodology, Software, Visualization.
Funding
The author received no financial support for the research, authorship, and/or publication of this article.
Declaration of Conflicting Interests
The author declared no potential conflicts of interest with respect to the research, authorship, and/or publication of this article.
Declaration of Generative AI
The author did not use the AI tools.