
Abstract
Due to the increase of economic status and resultant urbanization, urban residents’ value perception (RVP) knowledge has become key to promote urban planning and management, and sustainable urban development. The purpose of this paper is to propose an approach to identify residents' value perception contribution based on AHP-TOPSIS-RF coupling. Firstly, 15 indicators are constructed from the following three dimensions; ecological livability, health and comfort, and transportation convenience, and consequently the coupling coefficients were calculated using AHP-TOPSIS. Then, the GINI-OOB coefficients were used to calculate the weight of the influencing factors, and thus determining the high influencing factors. Wuhan, China, was used as the target area for this study. Results show that: (1) GINI-OOB coupling results in less error than traditional analysis of Gini coefficients or OOB data alone; (2) the factors that influence Wuhan residents’ value perception were parking management (0.196), house price acceptability (0.08), job opportunities (0.07), and rent acceptability (0.06). This study will help to effectively identify the real needs of urban residents, reduce urban problems caused by residents, and improve urban sustainability.
Plain language summary
In summary, we aim to propose a novel framework for the study of RVP, which consists of two parts, AHP-TOPSIS and RF-GINI-OOB, AHP-TOPSIS aims to find the best and worst targets among multiple targets by normalizing the data normalization matrix, calculate the closeness of each target to the ideal solution, and rank the targets according to the closeness of the ideal solution as the basis for the evaluation of the targets. The GINI-OOB coefficient method based on RF was used to train each index after processing, and the coefficients were used to measure the degree of influence on RVP in two dimensions. Wuhan was used as the research object of this study.
Introduction
As global urbanization is gradually accelerating, the increase in urban population has added to the challenges of many countries. According to the United Nations Department of Economic and Social Affairs, more than 55% of today’s population lives in urban areas, and this proportion is expected to grow to 68% by 2050 (Galea et al., 2019). With rapid urban development, many social and environmental problems often arise, and they can greatly affect the quality of life of residents(Chen et al., 2022). Residents’ value perception (RVP) represents the degree of urban residents’ perception of their surroundings, accurately reflects their well-being, and is an important reference for ensuring high-quality urban development. (Bednarska-Olejniczak et al., 2019). In recent years, various countries and regions are gradually conducting social satisfaction surveys to analyze residents’ value perceptions in various dimensions. For example, every 3 years, the European Commission conducts a survey on the happiness of European city residents to summarize their views and opinions on urban development (Nevado-Peña et al., 2019). Africa insists on putting people first in urban development and construction and conducts surveys on residents’ satisfaction (General Assembly, 2015). The Malaysian government is gradually increasing the level of democratization in urban planning and paying attention to residents’ opinions (Tuts, 2020). There have been many studies in this area, mainly focused on the analysis of the contribution of the perceived value of the population using different algorithms.
There are already some methods to analyze RVP. Importance-Performance Analysis (IPA) is now often used to measure the extent to which a product or service can meet the expectations of its users(Das & Basu, 2020; Deng & Pierskalla, 2018). The IPA methodology can be used to identify areas of development that require the most (least) attention to optimize development plans, however, analytical measurements using the four quadrants may not be sufficient to accurately demonstrate the complexities of urban development(Azzopardi & Nash, 2013). In general, researchers couple IPA with other methods to improve the quality of the findings, for example, López et al. (2019) combined IPA with hierarchical analysis performance (AHP). Shen et al. (2016) combined structural equation modeling (SEM) and its parameter estimation method, partial least squares (PLS), to establish a three-level indicator evaluation index system. Bingqin Yu combined IPA with correspondence analysis (Yu et al., 2018). This approach has its limitations, as asking customers to rate the importance of more questions increases the length of the questionnaire and thus affects the response rate. In addition, many studies have concluded that the subjective statements of environmental importance made by residents in questionnaires do not adequately reflect objective facts (Feng et al., 2014).
Technique for order preference by similarity to ideal solution (TOPSIS) is an efficient multi-criteria-based decision-making method. It obtains the proximity of each objective to the positive and negative ideal solutions by calculating the Euclidean distance from the objective to the ideal solution, and then evaluates the superiority of the objective according to the proximity to the ideal solution.TOPSIS is one of the most popular multi-criteria decision making/assistance (MCDM/A) methods. It helps decision makers to compare and rank alternatives, and plays a very important role in evaluation modeling in many fields, such as conducting preventive maintenance applications for risk, selecting suitable manufacturing suppliers, service quality assessment (Palczewski & Sałabun, 2019a), etc. With the gradual development of computer technology, many studies have started to apply various machine learning algorithms to analyze the indicators affecting the perceived value of residents, and the most applied ones are the conditional inference tree (CTree) algorithm and the random forest (RF) algorithm. The conditional inference tree algorithm is based on a tree model with relatively clear and simple, easy-to-understand rules that perform an exhaustive search for all possible partitions (J. H. Zhang, Xie, et al., 2021). The random forest (RF) algorithm uses Bootstrap samples of the data to train the tree, taking approximately two-thirds of the data for training at a time, with the remaining one-third called out-of-bag data. Researchers generally use two metrics to measure the importance of variables. The first is calculated from the replacement OOB data, for each tree in the random forest, recording the prediction error for the out-of-bag portion of the data; the second measure is the total reduction in node impurities split over variables and averaged over each tree, using the GINI coefficient to measure node impurities (Inaba et al., 2015; J. H. Zhang, Xie, et al., 2021), and the two methods of work in tandem to reduce the overall error. Machine learning algorithms have been widely used in the development of evaluation models for environmental information (Liu et al., 2017), chemical information (Muratov et al., 2020), etc.
Although existing studies have provided some references for RVP, the lack of precision and the difficulty of statistics are usually only macroscopic studies, and research studies on RVP are extremely lacking. In this paper, we use a multi-method coupling approach to assess the factors affecting residents’ satisfaction based on the research conducted.
In summary, we aim to propose a novel framework for the study of RVP, which consists of two parts, AHP-TOPSIS and RF-GINI-OOB, AHP-TOPSIS aims to find the best and worst targets among multiple targets by normalizing the data normalization matrix, calculate the closeness of each target to the ideal solution, and rank the targets according to the closeness of the ideal solution as the basis for the evaluation of the targets. The GINI-OOB coefficient method based on RF was used to train each index after processing, and the coefficients were used to measure the degree of influence on RVP in two dimensions. Wuhan was used as the research object of this study. The contribution of this paper is as follows three points:
Using TOPSIS method to assess value perceptions. The TOPSIS method is used to integrate multidimensional perceptions into a set of values that can be quantified and rank them. The superiority and inferiority solution distance method not only allows ranking and assessing the evaluation objects based on, but also avoids the subjectivity of the data through standardization, and may well portray the combined impact strength of multiple impact indicators.
An innovative use of GINI-OOB coefficients to study RVP. Although some researchers have previously used the GINI coefficient (Chiarini et al., 2020) to evaluate human environmental perceptions, coupling the GINI coefficient with the OOB coefficient will yield results with less error and facilitate more accurate derivation of factors affecting RVP.
We propose a system of indicators affecting residents’ value perceptions, which can provide some basis for quantifying value perceptions.
The structure of this paper is as follows: in the second section, we introduce the content of the habitat environment indicator system and the factors affecting the RVP based on the literature; in the third section, the content of the two methods TOPSIS and RF and their roles will be specifically introduced, the GINI-OOB coupling method based on the Lagrange multiplier method, and the indicators set for the test results.
Resident Value Perception: Composition and Influencing Factors
Residents’ Value Perception
In habitat, resident perception refers to the social perception of residents about their living environment. The living environment must have a good or bad impact on the local people, and these impacts will in turn affect the residents’ perceptions to some extent, triggering their attitudes and behaviors toward their living environment.
For the selection of specific habitat perception indicators, we selected three secondary indicators and 15 tertiary indicators under the three urban physical examination dimensions of ecological livability, health and comfort, and transportation convenience (J. X. Xu, Zhang, & Zhan, 2022). This is because in the “City Examination” social satisfaction survey, the satisfaction scores of each level of indicators under these three dimensions represent residents’ perceptions of their neighborhoods and surrounding areas, while the other City Examination indicators mainly ask residents’ overall evaluation of their cities (Z. W. Xu, Si, et al., 2022). The formulation of these 15 indicators is based on discussions among eight experts who have conducted research on urban development and environmental economics for over 10 years, culminating in the summarized indicator system as shown in Table 1. Among them, ecological livability refers to the harmonious development of the ecological environment and economic and cultural environment, and a good living environment to meet the ecological environment needs of residents (He et al., 2022). Health and comfort means that residents live in a healthy and comfortable environment, with good community services. Transportation convenience refers to a convenient living environment with good public transportation facilities and easy commuting (W. Z. Zhang, He, & Chen, 2021).
Habitat Perception Indicator System.

There is no specific conversion relationship between the secondary indicators and the various tertiary indicators under them. The RVP of the second level is a direct evaluation based on their own perceptions, while the satisfaction of the third level, as a specific representation of the residents’ perceptions of the habitat, plays an intermediary role between the objective condition of the built environment and the residents’ overall judgment of the secondary indicators.
Factors Affecting RVP
According to H. Zhang and Zhao (2021), the main factors that influence the perceived value of residents are: security resilience, landscape features, diversity and inclusion, neat and orderly, and innovation.
Security resilience mainly covers social security and natural security. Social security is an important factor affecting RVP, and social security affects social capital, which in turn affects residents’ sense of security and satisfaction (Lo et al., 2022). The establishment of a safe social environment can significantly increase residents’ life satisfaction (Matsunaga et al., 2022). Good traffic order can improve traffic safety, and traffic safety can provide residents with a greater sense of security, thus affecting the perception of value. Natural disasters such as waterlogging and climate change are a global problem, and effective response to natural disasters can bring well-being to residents (Thanvisitthpon et al., 2018).
Landscape features focuses on the city’s human history, and good cultural facilities can drive tourism, increase economic income, and influence residents’ perception of value. Historical and cultural construction can also promote local residents’ self-cultural identity and cultural development (J. Zhang et al., 2022). Diversity and Inclusion focuses on disadvantaged groups. Due to the rapid increase in housing prices, socially disadvantaged groups need more stable housing (S. Y. Lee & Myoung-Won, 2019), so they are more concerned about the regularity of the rental and sale market and the acceptability of housing prices. Care for vulnerable groups is also important for building inclusive cities (Dang et al., 2022). Minimum livelihood security, shantytown and urban village transformation and protected housing have a positive impact on the happiness of residents (Kim & Koh, 2022; Tan et al., 2019; Vuong, 2018).
Neat and Orderly refers to the cleanliness and hygiene of the living environment of the residents. The improvement of the environment is one of the most important factors to increase the satisfaction of the residents (Suh & Cheol, 2019). Garbage classification, property management and street sanitation can help build community eco-urbanization and improve the living environment of residents (Hsu, 2019; Jia, 2020; Zeng et al., 2022;). Innovation Vitality is an important factor for sustainable urban development. There is a significant impact between job satisfaction and resident well-being (Sanghoon & Han-Ah-Reum, 2020). Science and technology innovation environment, loan convenience, and talent introduction policies are important factors to motivate talented people to live in the local area, and the introduction of talented people can stimulate the local economic development, improve the living standard of residents, and affect the value perception of residents (Kwon et al., 2018; Lin et al., 2019; Z. W. Xu, Si, et al., 2022). The specific indicators are shown in Table 2, and the schematic figure is shown as Figure 1.
Influential Elements Impacting RVP.


Factors affecting RVP.
Study Area
Wuhan is the capital of Hubei Province, a famous historical and cultural city, the core city of the Yangtze River Economic Belt, an important scientific and educational base, an industrial base and a comprehensive transportation hub, and a national central city under construction. Wuhan has a maximum east-west distance of 134 km, a maximum north-south distance of 155 km and a land area of 8,596.15 km2 (Chen et al., 2020).
In terms of the natural environment, Wuhan’s topography is high in the north and low in the south, with altitudes ranging from 19.2 to 873.7 m, most of which are below 50 m. Wuhan has a large number of wetlands and lakes, with 165 rivers and 166 lakes over 5 km in length, with a total water area of more than a quarter of the city’s total area. In terms of culture and tourism, Wuhan was awarded the first ten national leisure tourism demonstration cities in 2017. In terms of social economy, by the end of 2020, Wuhan will have a resident population of 12,326.5 thousand people. The rural population is 1933.8 thousand and the urban population is 10,392.7 thousand. The city’s gross domestic product will be RMB 156,160,600 million, the disposable income of urban residents will be RMB 50,362,000 and that of rural residents will be RMB 24,057,000. In terms of internal and external transportation, Wuhan is located at the crossroads of the Yangtze River Golden Waterway and the Beijing-Guangzhou Railway Artery and is the largest inland water, land, and air transportation hub in China. Wuhan’s road network is dense, with 1,638,174 km of roads open to traffic by the end of 2019, and 15.62 m2 of road space per capita.
Although Wuhan has been improving its urban environment in recent years, and its development level is one of the highest among large cities, the rapid development and expansion of the city have led to a decrease in ecological land and an increase in the fragmentation of green space. In addition, the distribution of ecological space in Wuhan is uneven, with most of the green areas and rivers in the suburbs and relatively few in the urban areas where the population is concentrated, and the unevenness of ecological space and economic development between urban and rural areas has to some extent masked the problems of the habitat of Wuhan residents. Therefore, Wuhan is a typical and representative study area. The map of Wuhan city is shown in Figure 2.

Schematic representation of Wuhan city.
Methodology
In this study, experts were firstly invited to determine the weights of each second and third level evaluation index through the AHP method, then the weights and collected data were calculated by TOPSIS to get the RVP value. Finally, the Gini coefficient and OOB data in random forest models were used to assess the impact of all influencing factors on each third-level evaluation index and the total RVP value by combining them through the Lagrange multiplier method. The research roadmap is shown in Figure 3.

Research roadmap.
TOPSIS Method
Technique for Order Performance by Similarity to Ideal Solution (TOPSIS) was first developed by C. L. Hwang and K. Yoon (Çelikbilek & Tüysüz, 2020), and its main process is to rank finite evaluation objects according to their proximity to the ideal solution for evaluation among available objects. There are two kinds of ideal solutions: positive ideal solution (PIS) and negative ideal solution (NIS). By calculating the Euclidean distance between the evaluation object and the optimal solution and the worst solution, the closeness of the evaluation object to the ideal solution can be obtained, and then the relative merit of the evaluation object can be evaluated. After the AHP was performed to calculate the weights, the RVP values were calculated by TOPSIS.
Step 1. Isotropy of indicators.
The TOPSIS method uses a distance scale to measure the sample gap, and the distance scale requires isotropization of the indicator attributes to prevent confusion. The indicators are divided into two categories: cost-based indicators and benefit-based indicators, which refer to those indicators with smaller values and those with larger values, respectively.
Step 2. Construct the normalized decision matrix.
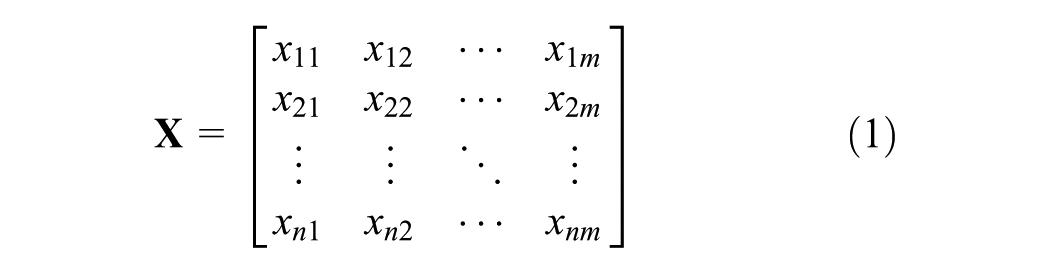
Let there be n objects to be evaluated in the sample set, and each object has m indicators, then the original data matrix is constructed as Equation 1. The dataset with invalid data rows removed is recorded as the original data matrix, n is the number of rows of the original data matrix, and m is the number of tertiary indicators.
Normalizing xij, the result is denoted as zij as shown in Equation 2.

Finally, the original data matrix

Step 3. Determine the positive ideal solution (PIS) and the negative ideal solution (NIS).
The positive ideal solution z+ is a vector consisting of the maximum of normalized satisfaction scores for each indicator. If
Step 4. Calculate the distance between data and PIS/NIS.
The TOPSIS method usually uses the Euclidean distance to calculate the distance between the positive and negative ideal solutions, as shown in the following equations:
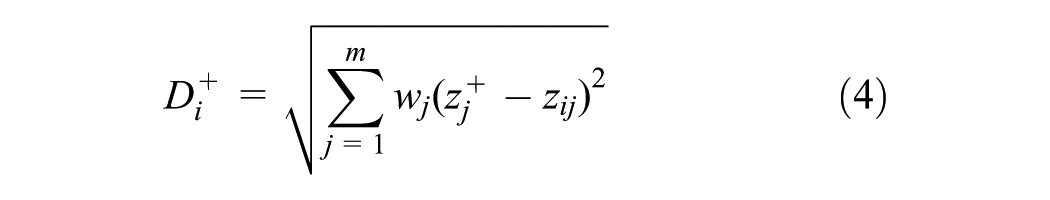
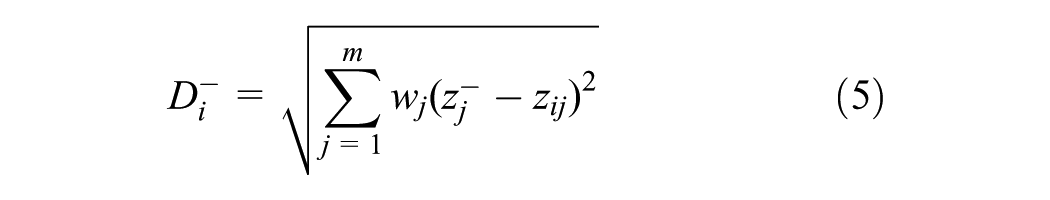
where wj is the weight of the j-th attribute and is the traditional Euclidean distance when all wj=1. The indicator weights are recommended to be determined according to practice or using expert evaluation methods, and we obtain the weights via expert evaluation and AHP method.
Step 5. Calculate the relative closeness.
The closeness indicates the proximity of each sample to the best sample, and in this paper, it indicates the proximity of each evaluation to the best evaluation, and the value range is [0, 1], the larger the Ci, the higher the evaluation; the smaller the Ci, the lower the evaluation, indicating that the evaluation object is better.

Random Forests
Random Forest Methods
Random Forest is a statistical learning theory method that uses Bootstrap resampling to draw samples from the data and uses decision trees to model each set of Bootstrap samples and combine multiple decision trees (Speiser et al., 2019). Random forests have been widely used in classification, regression, and dimensionality reduction problems because of their high prediction accuracy, robustness, and prevention of overfitting. There are two types of importance measures based on random forests, one is based on Gini index and the other is based on OOB data permutation. The OOB-based metric is a direct measure of the impact of each feature variable on the accuracy of the model, without the bias of the MDI metric, and is widely used (Desai & Ouarda, 2021). The steps of the random forest are shown in Figure 4.
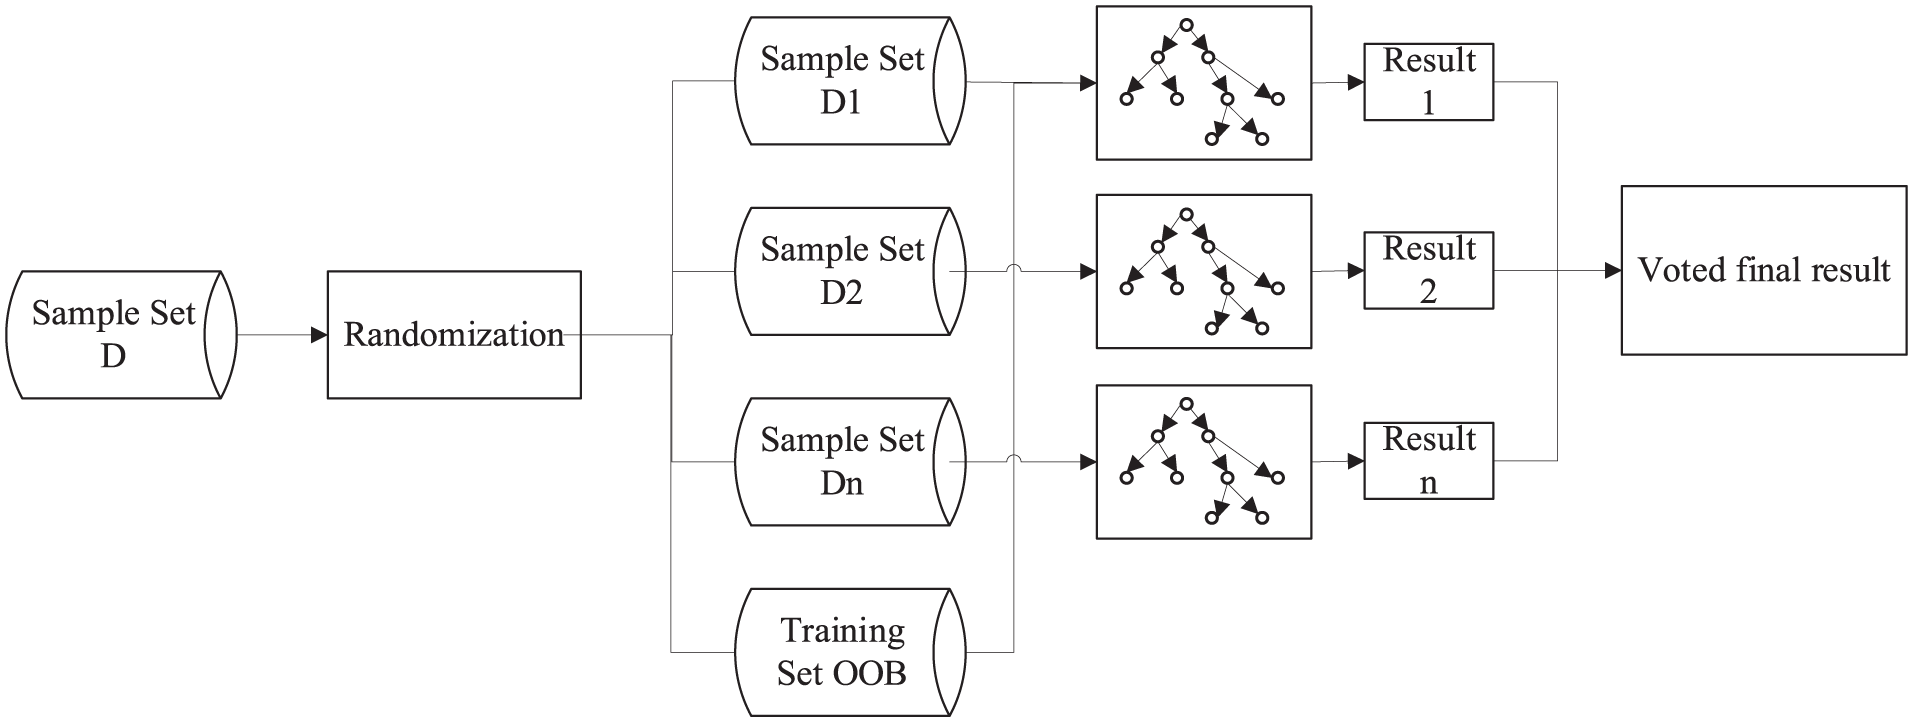
Framework of random forest.
Specifically, a traditional decision tree selects an optimal attribute from the set of attributes of order d of the current node when choosing attributes for division; whereas in a random forest, for each node of the base decision tree, a subset containing k attributes is first randomly selected from the set of attributes of that node, and then an optimal attribute is selected from this subset for division. Here the parameter k controls the degree of randomness introduced. If we let k = d, then the base decision tree is constructed in the same way as a conventional decision tree.
The random forest is based on the self-sampling method, and the steps are as follows: First, a dataset D with m samples is sampled to produce a dataset, and one sample is randomly selected from D at a time, copied into it, and then put back into the dataset D so that the sample is still likely to be sampled in the next sampling. After performing this procedure m several times, we have a dataset containing m samples. The calculation shows that there is always a portion of the m samples that are not used for training, and this portion of the data forms the out-of-bag (OOB) dataset for out-of-bag estimation.
Importance Measures Based on the GINI Index
The key to decision tree learning is how to choose the optimal partitioning attributes. In general, as the partitioning process progresses, the samples contained in the branch nodes of the decision tree need to belong to the same class as far as possible. In general, the decision tree uses Gini coefficient to select the partitioning attribute. At the current node t, the proportion of samples in the k-th category of the sample set D is pk (k = 1, 2, … , K), then Gini coefficient Gini(D) is

Intuitively, Gini(D) reflects the probability that two randomly selected samples from dataset D will have inconsistent category markers. Therefore, the smallzzer the Gini(D), the higher the purity of the dataset D. Set the random forest to contain M decision trees H={h1, h2,···, hM}. The importance of feature Xi at node t is

Ginil and Ginir denote the GINI indices of the two new nodes after node t, respectively. Then the feature Xi (a factor affecting RVP) appears in the m-th decision tree at the node in set T, then the importance of Xi in the m-th decision tree is

Then the total importance of Xi in the random forest is

Finally, the total importance is normalized to obtain the importance measure of the feature Xi based on Gini index as

Importance Metric Based on OOB Data Replacement
The main idea of the OOB data permutation-based metric is to disrupt the order of a feature variable in the OOB data to disrupt the correspondence between the feature variable and the output of the OOB data while keeping the other feature variables unchanged. A decision tree is used to predict the OOB data before and after the disruption, and the mean square error of the two predictions before and after all decision trees is used as the importance measure for this feature variable (Cutler et al., 2012). The procedure for solving the metric based on OOB data permutation is as follows.
Step 1. Set a random forest containing M decision trees H = {h1, h2,···, hM}. Each decision tree hm(m = 1,···, M) is used to predict the input matrix of the corresponding OOB data (the input matrix of OOB data is xOOB, and the output response vector is Y) separately, and the prediction result is Ym, then the mean square error of the predicted value Ym and the true value Y is em = E[(Ym−Y)2].
Step 2. Ensure that the other characteristics of the OOB data remain unchanged, and only disorder the characteristics of Xi (i.e., column i of xOOB), then use the decision tree hm to predict the disordered samples, then the mean square error between the predicted value
Step 3. The effect of the feature variable Xi on the prediction accuracy of the decision tree
Step 4. Repeat the above steps, traverse the entire random forest model, and obtain the impact of feature traversal Xi on the decision tree (

The importance measure OOB i based on OOB data permutation can have three scenarios: positive, negative and zero (Cutler et al., 2012). If the selected features are very important, the correlation between input and output is broken after disrupting the order of the feature variables in the OOB data, and OOBi > 0; if the selected features are not important, then the prediction will not change no matter how the order is disrupted, and OOBi = 0; if disrupting the order of the feature variables in the OOB data increases the correlation between the other feature variables and the output, then OOBi < 0.
Importance Measures Based on the Combination GINI-OOB
We based our results on S. Li et al. (2014) idea, we propose a combined GINI-OOB-based importance measure, combining GINI coefficients and OOB values, in order to synthesize the factors influencing residents’ value perceptions. For each feature Xi (I = 1,···, I) in the data, the combined GIi and OOBi, can obtain the combined GINI-OOB importance measure GOi. GIi and OOBi should be as close as possible, according to the principle of minimum relative information entropy (S. Li et al., 2014), optimization with the Lagrange multiplier method leads to the combination weight calculation equation
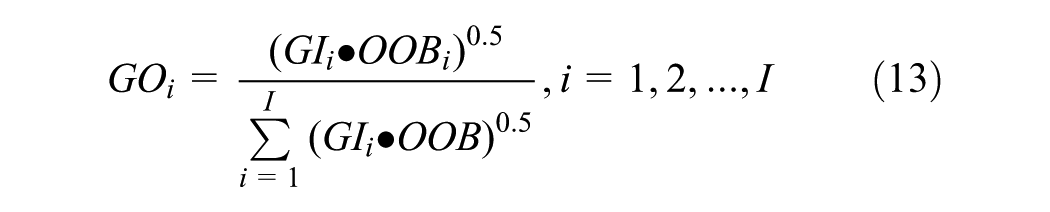
The above steps lead to the importance measure of the feature variable Xi based on the combination GINI-OOB. The increment of GOi quantifies the extent to which each feature contributes to the RVP. the larger the GOi, the greater the impact of feature Xi on the RVP and vice versa.
Setting of Test Indicators
To evaluate the performance of statistical learning methods on a given dataset, we need some way to measure how well their predictions exactly match the observations. This means that we need to quantify how close the predicted response value for a given observation is to the true response value for that observation. We choose the mean squared error (MSE), and R2 as our measures. where MSE is the mean value of the sum of squares of the corresponding errors of the predicted and original data

R 2 is a measure of how well the model explains the data. The closer R2 is to 1, the better the model explains the data and the better the fit.

here
Results
Data Collection
The data for this paper were obtained from the 2021 Urban Health Check questionnaire for the city of Wuhan. In this questionnaire, there are eight aspects, namely: Ecological livability, Health and Comfort, Transportation Convenience, Security Resilience, Landscape Features, Diversity and Inclusion, Innovation Vitality, Neat and Orderly. There are a total of 45 indicators in this questionnaire, which were rated by residents of Wuhan, with scores ranging from 0 to 100. A higher score indicates greater satisfaction with the respective indicator. A total of 9,913 data points were collected, and after removing samples with missing values, 7,379 valid data points were obtained. The survey results are presented in Figures 5 and 6. The horizontal axis represents the various indicators, and different colors indicate residents’ satisfaction scores for each indicator.

Graph of the results of the questionnaire for each of the RVP indicators.

Graph of questionnaire results for each indicator affecting RVP indicators.
The data show that most of the indicators have a score of 80 or above, indicating that residents are generally satisfied with the indicators in Wuhan. Meanwhile, among the 45 indicators, there are four indicators with a satisfaction rating of 0, namely community health service centers, community sports venues, community roads, fitness equipment and other infrastructure, and property management. In particular, 206 respondents rated property management as 0, indicating that there are significant gaps in property management in some areas of Wuhan. In addition, the majority of residents rated the population density, the acceptability of housing price and the acceptability of rent below 60, indicating that there are problems in these three areas in Wuhan.
Quantification of RVP
AHP Weighting Calculation
In this paper, eight experts were invited to score the resident value perception indicator system in section “Residents’ Value Perception” (among them, three experts from the university, three experts from industry and two experts from research institutes). Using the AHP method constructed in this paper, based on the Satty scale method, the importance of the indicators was evaluated by comparing each indicator element with each other two by two, and the weight of each criterion layer to the target layer was determined, using scores 1 to 9 and its inverse to reflect the importance of the indicators (Liu et al., 2020). In this paper, the importance of each level of indicators was determined separately. In this paper, the importance of each level 2 indicator and each level 3 indicator were scored separately and the scoring matrices are shown in Tables 3 to 6.
Secondary Indicator Scoring Matrix.

Three-Level Indicator (Ei ) Scoring Matrix.

Grade 3 Index (Hi) Scoring Matrix.

Grade 3 Index (Ti) Scoring Matrix.

Based on the above scoring, this paper uses MATLAB to calculate the feature vectors, AHP weights, and maximum feature roots of each index respectively and conducts the consistency test. The specific results are shown in Table 7:
AHP-Weight of RVP.
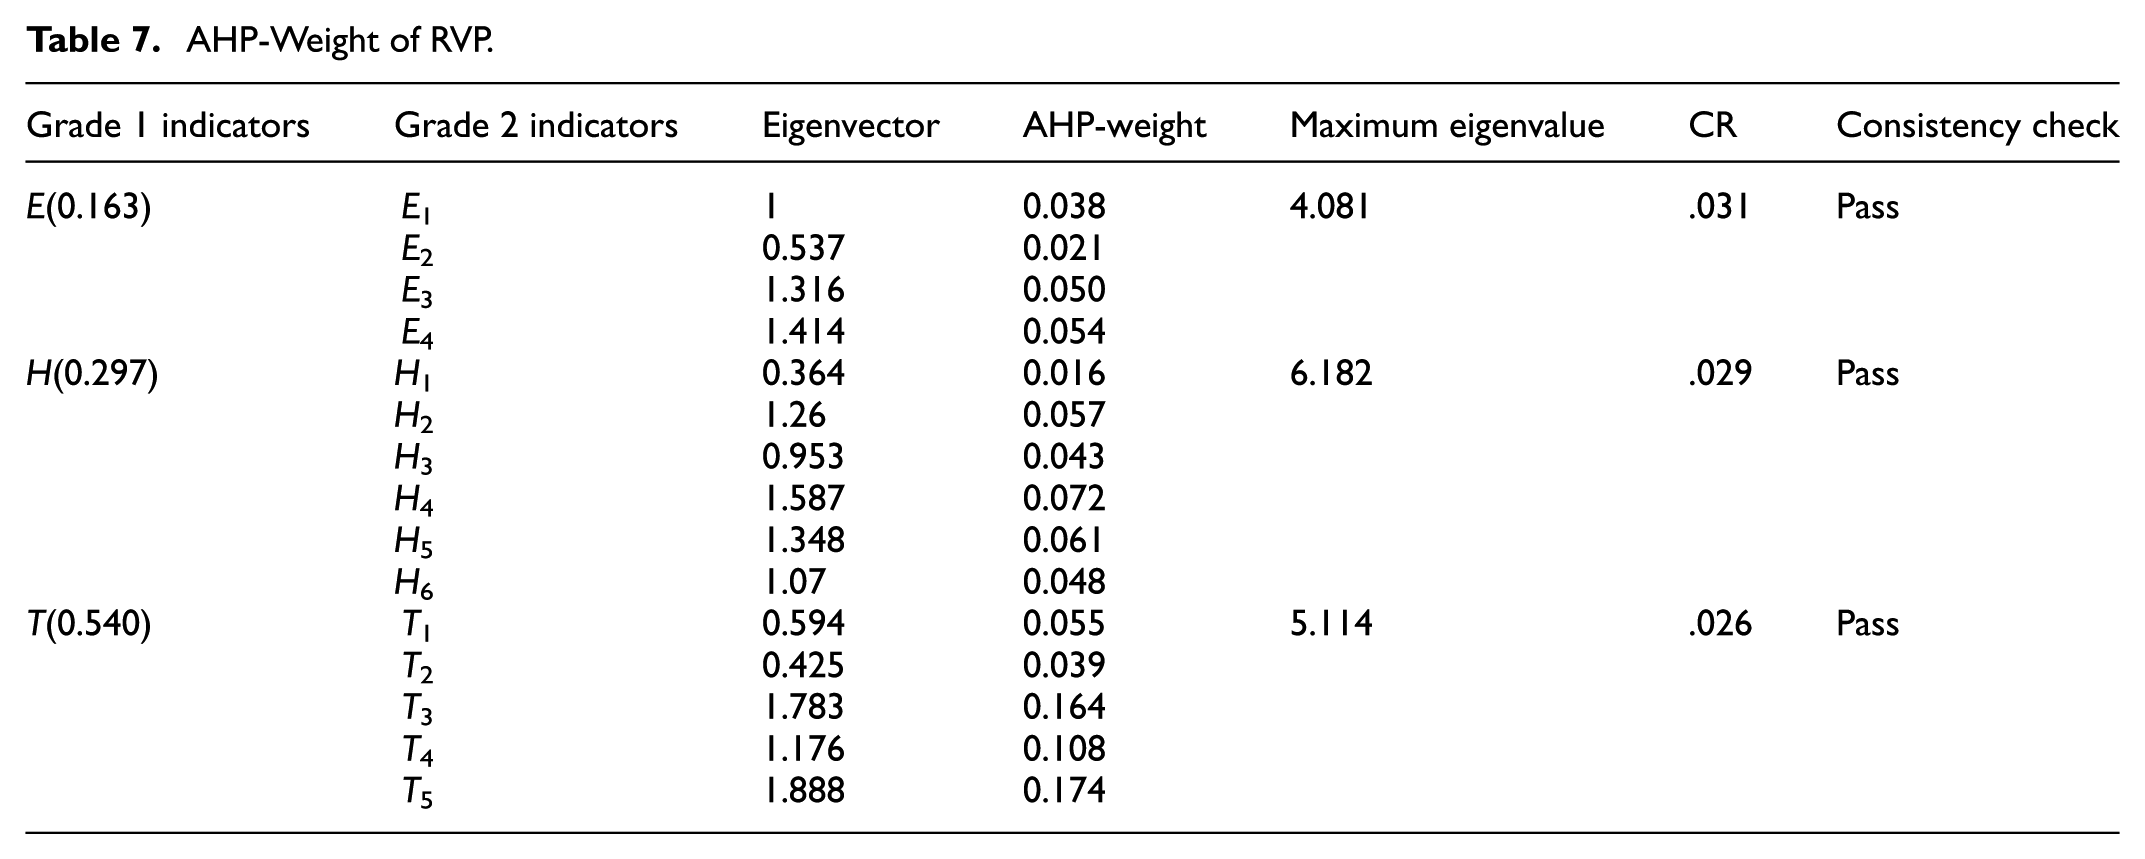
Based on the AHP method to obtain the weight value of each indicator, it was found that T (0.540) had the largest weight value among the secondary indicators, while E (0.163) had the smallest weight value. Among the tertiary indicators, T3 (0.1641) had the largest weight value and H1 (0.016) had the smallest weight value. The CR values of each index were calculated by the test and were less than .1, indicating that the consistency tests all passed, which showed that the scoring in this paper was reasonable.
Calculation Results of RVP
Based on the AHP weights calculated before, this paper uses MATLAB software to find the optimal and inferior matrix vectors by combining the collected and processed data, and calculate the distance D+ or D− of the evaluation object from the positive ideal solution or the negative ideal solution respectively, and combine the distance values to calculate the composite degree score index, that is, RVP. Here, due to space limitation, only the first 20 sets of calculation results are shown, as listed in Table 8.
RVP Calculation Results.

In this paper, there are 7397 sets of valid data. After TOPSIS calculation, the maximum value of the comprehensive score index is 1, the minimum value is 0.09011, the middle value is 0.7293, and the mean value is 0.7294. On the whole, the scoring results are basically in line with the normal distribution, indicating that the collected data and the model are reasonable. The score distribution map is shown in Figure 7.

Score distribution map.
Experimental Results
In this paper, based on the Python program and Origin software, using the random forest algorithm, the algorithm training and structural analysis are carried out by adjusting the parameters based on mean square error (MSE) and R2. The results are calculated as shown in Figures 8 and 9. The results of each of these indicators corresponding to GO(GINI-OOB) are shown in Figure 8a–o, and the results corresponding to RVP are shown in Figure 9. The overall accuracy of R is greater than .437, and MSE is less than 0.047.

Gini-OOB from E1 to T5. (a) GO-E1. (b) GO-E2. (c) GO-E3. (d) GO-E4. (e) GO-H1. (f) GO-H2. (g) GO-H3. (h) GO-H4. (i) GO-H5. (j) GO-H6. (k) GO-T1. (l) GO-T2. (m) GO-T3. (n) GO-T4. (o) GO-T5.

Weights of indexes of RVP. (a) GI-RVP. (b) OOB-RVP. (c) GO-RVP.
To analyze the impact of each indicator on the results of each indicator corresponding to result values were clustered, and the degree of impact was divided into three levels: low impact, moderate impact, and high impact, where the range of low impact was 0 to 0.01998, the range of moderate impact was 0.01998 to 0.05004, and the range over 0.05004 is high impact.
Overall, the results obtained based on GINI(GI) are not the same as those obtained based on OOB. Since the results based on Gini-OOB (GO) are a combination of the two methods, the variables with medium impact obtained by the Gini and OOB algorithms become variables with high impact after the combination of Gini-OOB. Specifically, in terms of ecological livability (E), the GI-based method did not obtain variables with high impact, and variables with medium impact were S2, L2, D1, D2, N2, and N4, respectively; the OOB-based method obtained variables with high impact as S2, and GO-based variables with high impact as S2, L2, D1, D2, D3, N1, N4, and N7. For Health and Comfort (H), no high-impact variables were obtained based on GI, high-impact variables were obtained based on the OOB approach for S2, and high-impact variables were obtained based on GO for S2, D1, D4, N2, N3, N4, and N7. In terms of Transportation Convenience, the variables with high impact were not obtained based on GI, the variables with high impact were S2 based on the OOB approach, and the variables with high impact were S2, D1, D4, N2, N3, N4, and N7 based on Gini-OOB. For the whole RVP, the variables with high impact based on GI are N5 and N7, and the variables with high impact based on OOB are S2, D1, D4, N2, N3, N4, and N7. method yields high impact variables D1, N4, N7, and I2, and GO-based variables D1, D2, N4, N5, N7, and I2.
Discussion
Analysis of Individual RVP Indicators
To better analyze the relationship between the evaluation of the three levels of indicators and each influencing factor, the indicators corresponding to high influencing factors are listed as shown in Table 9. From the table, we know that all kinds of evaluation indicators are influenced by the degree of traffic order (S2), and the overall evaluation can be improved by strengthening the organization and management of traffic management department, establishing a sound traffic management system, realizing the informatization of traffic management, and educating the residents about safety (Ait Ouallane et al., 2022). Due to the high traffic demand of citizens, the traffic satisfaction of residents should be improved by promoting intelligent traffic management technology, strengthening property management and parking management, enhancing the friendliness of the foreign population. In addition, attention should be paid to strengthening the inspection and supervision of street sanitation for a better walking and cycling experience.
High Impact Factors Corresponding to Each Indicator.

Inappropriate urban road traffic management and vehicle parking not only damage the overall appearance of nearby parks and water bodies but also affect the cleanliness of the city’s waterways (Järlskog et al., 2021). It is necessary to improve the parking management system and strengthen the construction of parking lots to promote standardized parking and increase the residents’ closeness to open spaces and natural water bodies. Compared with the first two types of visual landscape environment, people attach more importance to population density, parks, and green areas, such as social living environment and health and comfort indicators, these evaluation indicators need to strengthen parking management to improve(Tang et al., 2020).
The main focus of improving the social living environment and complete community, daily shopping experience near the evaluation is to improve property management (N2), the acceptability of housing prices (D1), motor vehicles, and non-motorized parking management (N7). Managers should further improve the management system of property management, establish a sounder training system for property managers, strengthen real estate market supervision, and increase housing security, shopping malls should provide safe and convenient parking spaces for motor vehicles and non-motor vehicles, and implement a parking fee, management, and fine system to regulate parking behavior (Zeng et al., 2022). The perception of service nature places and facilities (large shopping centers, community health service centers, community sports venues, community roads, fitness equipment, and other infrastructure) can also be improved by the department to strengthen street health promotion, regular inspection of street conditions, timely detection and resolution of street health problems.
Analysis of RVP
From the perspective of the overall value perception of residents, people are most sensitive to the living environment and the cost of living, and this is where city managers need to pay the most attention. Whether the urban environment is neat and orderly is an important part of the value perception of residents. In the daily life of citizens, if there are problems such as erecting poles randomly, placing garbage disorderly, and untimely maintenance of manhole covers, it will seriously affect the happiness of residents’ life. City managers need to focus on strengthening infrastructure management such as pole management and manhole cover management, strengthening monitoring and surveillance during daily operation as well as construction and maintenance, and dealing with safety hazards promptly. Equally important, people are very concerned about the cost of living such as housing prices and housing rents. Housing is a major pain point for the urban population, and with the gradual increase in urban housing prices, it is even more important for city managers to increase housing security and further improve people’s living conditions. What cannot be ignored is that people pay much attention to the convenience of life, such as whether parking is convenient, whether transportation is fast, etc. This requires city managers to strengthen the planning of urban space to guarantee the travel experience of residents. Overall, RVP is most closely linked to the neatness, economy, and convenience of the city.
Conclusion
This study proposes a novel research framework for RVP and reasonably constructs a coupled AHP-TOPSIS-RF method to effectively identify the influencing factors of RVP to understand citizens’ real demand for urban services. The rationality and validity of the proposed method have been verified by reliable data from Wuhan, China.
The results of the study show that the proposed methodology can help policymakers and urban planners efficiently and accurately analyze the important factors influencing the level of residents’ value perceptions in a city. The main contribution of this study consists of three aspects. Theoretically, this study proposes a scientific system of indicators affecting RVP. Specifically, this study uses the AHP-TOPSIS method to integrate multidimensional perceptions into a set of values and measure them through random forest analysis. In practical terms, the analysis method proposed in this study can be applied to the analysis of RVP in other cities around the world, so that city managers can deepen urban governance and improve urban services.
The study concludes that the analysis of residents’ value perceptions is important for urban development decisions. This analysis is reliable using efficient machine learning algorithms and the accuracy of the results is enhanced by coupling the coefficients appropriately. Based on the methodology used in this study, the degree of development of various aspects of the city can be effectively assessed. In addition, this paper proposes a system of indicators affecting RVP, which can help city governors to better understand the status of development of various aspects of city services and thus to formulate city development guidelines.
Due to the limitations of random sampling groups and population moving, the study cannot ensure data collected come from the same people every time. Thus future studies could target the long-staying population or specific groups of people for analysis to obtain more specific results. Moreover, due to space constraints, this study only chose Wuhan as the research target city. Future studies could adopt our framework to conduct RVP analyses in more cities, capture the differences in the demand for urban services of citizens in different places, analyse urban development status and next development direction of the city in various aspects. In addition, factors influencing RVP can be further mined using system dynamics modeling (Rebs et al., 2019) and structural equation modeling (Nicolas et al., 2021).
Footnotes
Author Contributions
Conceptualization: Xiaoling Zhang, Haiqing Bai, and Xinyu Xiao; Methodology: Haiqing Bai, Xiaoling Zhang, and Xinyu Xiao; Formal analysis and investigation: Xiaoling Zhang, Haiqing Bai, and Xinyu Xiao; Writing—original draft preparation: Xiaoling Zhang, Haiqing Bai, and Xinyu Xiao; Writing—review and editing: Xiaoling Zhang, Haiqing Bai, and Xinyu Xiao.
Funding
The author(s) received no financial support for the research, authorship, and/or publication of this article.
Declaration of Conflicting Interests
The author(s) declared no potential conflicts of interest with respect to the research, authorship, and/or publication of this article.
Data Availability Statement
The datasets generated and/or analyzed during the current study are not publicly available but are available from the corresponding author on reasonable request.