
Abstract
Transitioning to an industrial greener pathway is critical to achieving the climate change targets and sustainable development goals. For that, studying industrial eco-productivity is critical. This paper assesses the industrial eco-productivity (IEP) of Chinese industrial enterprises at the provincial level and further analyzes the direct, indirect and spatial impact of environmental regulation implemented in six provinces on IEP. The results indicate that over time, IEP has progressed to various degrees across provinces, especially in provinces where environmental regulation is implemented. On average, technological progress, more than technical efficiency, is the main contributor to IEP improvements. Critically, at the provincial level, environmental regulation has significantly improved the IEP, although the differences in effect are small. Interestingly, the promotion of the IEP of provinces that implement environmental regulation has spatially suppressed the improvement of the IEP of provinces that have not. Our evidence also shows that environmental regulation affects IEP by increasing R&D expenditure and product structure upgrading, indicating that innovation transition is critical. However, the positive policy effect is regionally heterogeneous and only reflected in the central region. Therefore, policymakers should pay more attention to ensuring the effectiveness of environmental regulation in improving IEP and technological progress as a long-term strategy in ensuring the sustainability of the industrial development progress in China.
Introduction
Globally, the attempt to make the industrial transition to a greener path has intensified. With the establishment of sustainable development goals (SDGs), specifically related to responsible consumption and production, as well as climate-related standards (e.g., Environment, Social and Governance requirements) (Zeraibi et al., 2022), industries are subjected to increasing scrutiny for a more balanced growth path. Nevertheless, policymakers at the regional level lack understanding of two issues. First, while the debate on incorporating environmental implications on growth accounting has been widely recognized (D’amato & Korhonen, 2021; Grossmann et al., 2022; Guo et al., 2024; S. Ren et al., 2023), less is understood about the patterns of such balanced growth at the regional level to inform policymaking. Similarly, at the industrial level, estimating production efficiency and productivity by incorporating environmental factors is critical for countries that attempt to make green transactions (Meng & Zhao, 2022; Ouyang et al., 2023; Rahko & Alola, 2024; Yu, 2022). Specifically, improving eco-productivity, productivity that accounts for environmental factors, ensures that industries are better positioned to minimize environmental impacts. Second, various instruments, among them including environmental regulation, are needed to improve environmentally adjusted productivity but the impact of environmental regulation is less clear on industrial eco-productivity. Meaning that there is a need to empirically assess the effectiveness of environmental regulation in driving balanced development.
Given these gaps, this paper aims to measure the industrial eco-productivity at the provincial level and assess the impact of environmental regulation in driving industrial eco-productivity. Industrial ecological productivity refers to the effective use of resources and energy, the reduction of waste emissions, and other environmental factors in the industrial sector’s production process (Korhonen, 2004; F. Liu et al., 2023). It measures production efficiency taking into account environmental sustainability in the industrial sector. As from the environmental institutional perspective, we used China as the case for the following reasons. In 2008, the Ministry of Environmental Protection issued the “Notice on Identifying the First Batch of Ecological Environment Compensation Pilot Areas” (MEP [2008] No. 168) and selected six provinces (Shanxi, Liaoning, Zhejiang, Fujian, Jiangxi, Gansu Provinces) as the first batch for implementing the ecological environment compensation initiatives. These provincial governments have successively issued a series of supporting policies as part of the environmental regulation. The ecological compensation measures includes establishing the economic compensation mechanisms for ecological protection through fiscal transfers or other forms of economic compensation, formulation of specific guidelines and regulations to support the implementation of ecological compensation, implement specific environmental protection and restoration projects, establishing monitoring and evaluation systems as well as promoting cross-regional cooperation to address issues of local protectionism in ecological compensation. This is a significant innovative initiative that is piloted in the six provinces beyond the traditional environmental regulation. Wan et al. (2022) argued that ecological compensation initiatives affect industrial structure by raising environmental standards that limit the operation of pollution-intensive industries. Similarly, it is likely that environmentally intensive industries will move to provinces with less stringent environmental regulations. We argue that there is also a tendency for industries to improve their environmental productivity in order to avoid environmental scrutiny. Additionally, it is concerning that China’s carbon emissions increased by approximately 565 million tons in 2023, marking the largest increase globally to date (L. Zhang et al., 2024). Given the high energy consumption and emissions in industrial sectors (Lin & Wang, 2024; Tong et al., 2023), in 2020, China aimed to reach its peak carbon dioxide emissions by 2030 and carbon neutrality by 2060. Air pollution has been one of the major concerns in China and large number of cities still record annual average PM2.5 concentrations that are 6.5 times greater than World Health Organization standards (IQAir, 2023). For instance, in 2014, the Beijing-Tianjin-Hebei region, recorded an annual average PM2.5 concentration of 93 µg/m. In this context, China is at a critical juncture of the industrial transformation to achieve industrial green sustainable development. And in driving balanced industrial growth, China has experimented at various degrees with environmental regulation implementations at provincial levels where it provides a natural experiment of how those regulations drive industrial eco-productivity. However, empirical evidence is needed to substantiate some of the above observations.
We attempt to contribute in the following ways. First, we provide evidence of the progress made by the provincial industrial eco-productivity from 2001 to 2015. Understanding the pattern of eco-productivity will allow policymakers to gauge the dynamics of the industrial balanced growth path to improve the province that lacks such progress. Specifically, productivity gains can be instrumental in achieving industrial growth and environmental outcomes if those measures account for environmental outcomes. In other words, boosting productivity more sustainably by limiting environmental damage. Faced with increasingly severe resources and environmental constraints, the measurement of IEP can reflect three main tasks: achieving sustainable development, circular economy and cleaner production and correspondingly reducing the intervention of energy factors input, increasing expected output, and reducing undesired output. Therefore, the IEP translates into the question of how to improve the input-output efficiency of industrial production. This measure is more holistic in that industrial production inputs and outputs include environmental variables and not just conventional performance indicators such as value-added output. Second, the paper verifies if China’s provincial environmental regulation specifically ecological compensation policy, can be used as an instrument in driving industrial eco-productivity. In doing so, the paper also assesses if there is any spatial effect of environmental regulation on industrial eco-productivity. Third, methodologically, the paper takes an experimental approach by examining the effects of environmental regulation between the treated and non-treated provinces. Therefore, the selected aggregated industrial enterprises of these 6 provinces can act as the treated group and the other 24 provinces as the control group in assessing the impact of environmental regulations. Likewise, we perform various robustness tests to account for regional heterogeneity. Fourth, the study examines the transition in which environmental regulation would affect IEP. For transition, we examine if environmental regulation would promote innovation activities in research and development (R&D) and product upgrading as a channel for improving IEP. Indeed, for robustness, we controlled for other critical covariates of IEP.
China’s aspiration to and sustainable development by achieving its ambitious carbon emissions targets warrants an understanding of how regulations would have been effective—not just in reducing emissions—but in improving industrial eco-productivity holistically. Nevertheless, the current empirics on the effect of environmental regulation are less clear, especially on industrial ecology productivity. Indeed, no attention is given to examining the transition mechanism in which environmental regulation promotes industrial ecology. Given this, it is critical to assess if environmental regulation can promote the ecological development of industry.
The study is further organized as follows. Section “Literature review and conceptual framework” discusses the literature on environmental regulation and industrial ecology to form the theoretical basis for the study. Section “Research methodology” describes the research methodology, while Section “Results and discussion” discusses the findings of the study. The final section concludes the study.
Literature Review and Conceptual Framework
Environmental Regulation Experiment in China
There are many tools for environmental regulation, including command-and-control and market-based tools (Beiser-McGrath et al., 2023; Bretter & Schulz, 2024; Lamperti et al., 2020). Historically, China began experimenting with the first environmental protection law in 1979 and started to attach importance to the treatment of industrial “three wastes,” which are the treatment of industrial wastewater, waste gas and waste. By the 1980s, China had further proposed a combination of prevention and control and implemented a sewage permit system. Subsequently, in the 1990s, China began to attach great importance to environmental pollution control, especially industrial pollution control. China implemented the Environmental Protection Tax Law of the People’s Republic of China to accelerate the realization of industrial ecological construction on January 1, 2018. In 2020, China put forward the “peak carbon dioxide emissions” and “carbon neutrality” goals, respectively.
From the beginning of the 21st century, policymakers have proposed the concept of industrial ecology, that is, to realize clean industrial production, circular economy, and sustainable development. Specific to our study focus is the introduction of the ecological compensation environmental policy with the issuing of ecological environment compensation pilot areas in May 2008. Since the Eleventh Five-Year Plan (2006–2010), the ecological compensation policy has been an important component of all other five-year plans in China. The novel approach of ecological compensation is not based on specific sectors, but on regions prioritized for conservation. It has increased public financial transfers for key ecological zones from CNY 6 billion in 2008 to CNY 83.0 billion in 2019. As an innovative environmental regulation that comprehensively utilizes command-and-control and market-based tools, the ecological compensation policy demonstrates its potential to promote industrial ecological productivity. This policy framework encompasses extensive practical measures, including economic compensation for the protection or degradation of ecological environments (Villarroya & Puig, 2010), the internalization of costs associated with external ecological benefits (Qu et al., 2016), safeguarding specific regional or individual ecosystems (Deng et al., 2011), and investing in high ecological value areas or entities (Y. Yang et al., 2018). At the provincial level, governments have implemented a variety of strategies, such as establishing mechanisms for economic compensation between regions, crafting supportive policy and regulatory frameworks, conducting ecological restoration projects, developing systems for monitoring and assessing ecological and environmental health, and fostering cross-regional collaboration. These initiatives ensure the legal and practical operation of compensation mechanisms, promote accurate valuation and transactions of ecological services, improve the quality of the ecological environment, and facilitate regular assessments to monitor the success of ecological compensation efforts, achieving established environmental protection goals. As a command-and-control tool, ecological compensation policy emphasizes controlling and governance the sources of environmental pollution and degradation (J. Zhang et al., 2023), constraining and managing enterprises through regulations and norms to improve their environmental behavior during production processes. Simultaneously, as a market-based tool, the ecological compensation policy focuses on guiding and incentivizing market mechanisms by establishing ecological rights trading markets and ecological compensation mechanisms (H. Du et al., 2023), encouraging voluntary participation of enterprises and individuals in ecological protection and restoration (Zhu et al., 2023), thus achieving a win-win situation between economic benefits and ecological benefits. L. Du and Sun (2023) suggest that the ecological compensation policy achieves dual management of ecosystems by imposing fines and penalties on entities causing environmental damages while simultaneously encouraging the development of ecological restoration projects (B. Fu et al., 2023), thereby improving the IEP.
In addition, through both source and end environmental governance, ecological compensation promotes the enhancement of industrial ecological productivity. From the source perspective, the policy emphasizes internalizing the external costs of the environment (Nie et al., 2024), controlling and governing the sources of environmental damage during production processes, and encouraging the adoption of clean production technologies and environmental facilities by enterprises to reduce adverse impacts on the ecological environment (Cai & Li, 2018). This source governance helps to reduce resource and energy consumption, enhancing production efficiency and resource utilization. Meanwhile, from an end perspective, the ecological compensation policy supports enterprises in waste disposal and pollution control by establishing environmental protection funds and ecological compensation mechanisms (Zhang et al., 2023), reducing adverse environmental impacts, and enhancing the stability and productivity of industrial ecological systems. However, further improvements in the institutional design and implementation mechanisms of ecological compensation policy are needed to ensure its maximum effectiveness in practice (Veklych et al., 2020).
Environmental Regulation, Path Dependence and Industrial Ecological Productivity
The contestation on the link between environmental regulation and industrial ecology has always been controversial. It can be divided into two perspectives, namely “Incentiveism” and “Inhibitionism.” Indeed, as Figure 1 shows, the effects of environmental regulation on industrial ecology are not straight forward, and its effects are also likely to take an intermediary path. This section reviews the literature on the two opposing effects of environmental regulation on industrial ecology and gives the theoretical justification for R&D and product structure as mechanisms.

Conceptual framework of environmental regulation effect on IEP.
The “Incentiveism” approach argues for the way in which environmental regulation promotes industrial ecological development, and reasonable environmental regulation can promote the competitiveness of industrial enterprises (Xie et al., 2017). The theoretical basis of “Incentiveism” comes from the “innovation compensation effect.”
Environmental regulation induces firms to increase research and development (R&D) expenditure, leading to the innovation compensation effect (J. Chen et al., 2024; Fan et al., 2022; J. Liu & Liu, 2023), which subsequently impacts industrial ecological productivity (IEP). This process involves firms engaging in technological innovation and process improvement to comply with environmental regulations (Z. Li et al., 2023), thereby enhancing dynamic processes of production efficiency and resource utilization efficiency. Stringent environmental regulations typically demand firms to adopt cleaner and more environmentally friendly production technologies and processes (Z. Chen et al., 2023). To meet these regulatory requirements, firms need to increase R&D investment to explore and introduce more environmentally friendly technologies (P. Chen et al., 2023), such as low-carbon production technologies and clean energy utilization technologies, thereby reducing “bad outputs” such as industrial wastewater, waste gases and solid waste. And decreasing energy inputs in the production process, consequently enhancing IEP. Furthermore, increasing R&D expenditure can also facilitate firms in process improvement (J. Liu et al., 2020), enhancing product quality and market competitiveness (Koshksaray et al., 2023), thus increasing the value added and market share of “good outputs,” subsequently enhancing firms’ profitability and IEP. Environmental regulations can also influence industrial ecological productivity through product structure reform. Firms producing green products can obtain market value, thereby compensating for some of the squeezed R&D investment, improving price advantages and sales output (P. Li et al., 2021; Sana, 2020), enhancing firms’ market competitiveness, expanding sales markets, and increasing sales profits (Ali et al., 2020; Testa et al., 2021). Faced with pressure from environmental regulations, firms tend to reduce the production of highly polluting and energy-consuming products (Chen et al., 2024), while increasing the production of low-pollution, high-value-added products (D. Hu et al., 2022). This shift can reduce negative environmental impacts, enhance IEP, and promote the effective utilization of resources. Adjusting product structures also helps improve the ecological effects of the entire industrial chain (Bag et al., 2022), driving the entire industry chain toward a more environmentally friendly direction and promoting the sustainable development of industrial ecosystems.
On the other hand, “Inhibitionism” means that environmental regulation cannot improve the ecology of industry but will even delay the productivity of industrial ecology. Environmental regulations can lead to an increase in internal production costs (Tang et al., 2023), resulting in a decline in capital investment in production (Tian & Feng, 2022; Z. Yang et al., 2023), thereby hindering industrial ecological productivity. Specifically, to meet the requirements of environmental regulations, firms need to seek greener production technologies. In the short term, this may incur costs of technological transition (S. Zhang & Chen, 2022), as firms may need to invest substantial funds in R&D for new technologies and equipment purchases, which could lead to an increase in production costs, thus temporarily reducing IEP. Additionally, the R&D process may face risks of technological immaturity or failure (Ma et al., 2022; Y.-C. Yang et al., 2020), which could result in resource waste and a decrease in production efficiency. Moreover, introducing new technologies may require employees to undergo new training and education, and adopting new technologies may lead to the replacement of labor by machines, thereby increasing unemployment and reducing IEP (Ayhan & Elal, 2023). In addition, with the increasing promotion of government awareness of green environmental protection and subsidies for green products, consumers will increase their consumption of green products and reduce their consumption of highly polluting products (Hameed et al., 2021; Ogiemwonyi et al., 2023; Stockheim et al., 2024). Enterprises face market changes and must adjust their product structure. However, in the initial stage of the transformation toward green products, enterprises may face penalties from the government for previously producing polluting products or restrictions on their previous polluting products, affecting their profit margins (Feng et al., 2023; Jin et al., 2020). Furthermore, start-up enterprises undergoing green product transformation may experience a decline in performance in the initial stages of production as they need time to adapt to the promotion of green products and market responses, leading to decreased enterprise performance (Leyva-de la Hiz & Bolívar-Ramos, 2022). Product structure reform may also affect enterprise supply chains (Mangla et al., 2015), causing interruptions or instability, thereby affecting IEP.
Research Methodology
Data Sources
The implementation of the environmental regulation, ecological compensation, pilot project took place in 2008. Data were obtained from various sources, namely, China Industrial Statistics Yearbook, China Statistical Yearbook, China Environmental Statistical Yearbook and China Energy Statistical Yearbook. Due to the completeness of the data and the availability of industry indicators, the data covers 30 provinces from 2001 to 2015, with 6 provinces that have implemented environmental regulation pilot projects and 24 provinces that have not done so. We limit the data to 2015 to ensure that there are 7 years window between the time before and after policy implementation so that the data are also not influenced by other events.
Measuring Industrial Eco-Productivity (IEP)
We measured industrial productivity that takes into account environmental effects, by treating emissions as a negative externality (unexpected output) in the productivity assessment (Dyckhoff, 2023). We employed the Data Envelopment Analysis (DEA) method, integrating the non-radial Slacked-Based Measure (SBM) model (Cooper et al., 2006) with the Malmquist-Luenberger Global productivity index (GML productivity index). This approach, termed the SBM-GML method incorporating unexpected outputs, offers opportunity to capture industrial eco-productivity and can be formulated as follows.
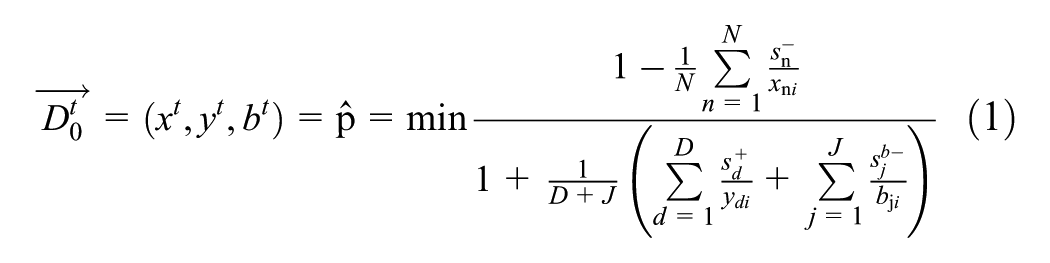

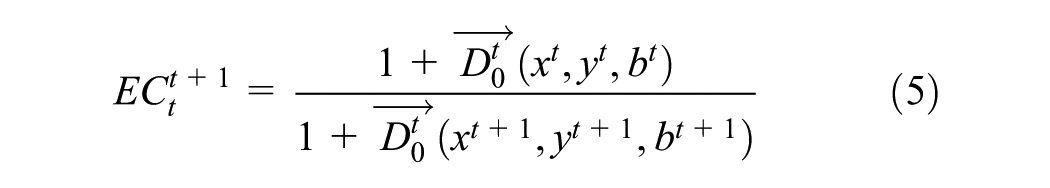
When assessing IEP, it necessitates a concurrent augmentation of expected outputs and a concurrent diminution of unexpected outputs. The GML productivity index, serving as our metric for IEP, facilitates a more objective quantification of dynamic alterations in production efficiency levels. Thus, the variation in

IEP can be dissected into two components: Efficiency Change (EC) and Technological Progress Change (TC). EC delineates the efficiency variance among provinces, whereas TC gauges the extent of technological advancement. Thus, Equations 4 to 6 exhibit the dissection of IEP as elucidated below:


Within Equations 1 to 6, xni denotes the input quantity, ydi represents the expected output quantity, bji signifies the unexpected output quantity,
Input and Output Selection
We employed three primary inputs in our analysis: capital stock, labor, and energy consumption. The real capital stock was estimated utilizing the perpetual inventory method, outlined as follows:

Within Equation 7, Kt denotes the fixed assets for the current year, while Kt−1 signifies the fixed assets from the previous year, and FAIt represents the price index of investment in fixed assets, with a base year of 2000. The symbol δt denotes the annual depreciation rate, calculated as the ratio of the depreciation amount for the current year to the original value of fixed assets from the preceding year. Labor input represents the average number of employees. Energy consumption encompasses various energy types and is standardized into 10,000 tons of standard coal using an appropriate energy conversion factor.
As for output measures, we used industrial sales at the constant price (deflated by the producer price index) as the expected output and three industrial emissions as unexpected outputs, particularly (waste gas emissions [100 million standard cubic meters], wastewater discharge [10,000 tons] and solid waste production [10,000 tons]). The industrial emission enters the estimation as an industrial pollution index given that the characteristics, dimensions, orders of magnitude and other characteristics of the three pollutants are different and non-additive. To form the index, the Technique for Order Preference by Similarity to Ideal Solution (TOPSIS) method based on the Entropy Weight Method (EWM) is used. It involves the following steps. First, the weight values calculation of the EWM. In the process of giving weight to each evaluation index, the number of provinces in this paper is m, the number of evaluation indexes is n, and the value of each evaluation index is aij (i = 1, 2, …, m; j = 1, 2, …, n), Thus, the original decision matrix Amn = (aij)
m×n
for the evaluation of a comprehensive index of multiple objects concerning various indicators can be obtained. Since there are specific differences in the evaluation indicators in multiple provinces, to eliminate the impact of the above differences on the final comprehensive pollution index evaluation results, the original decision matrix Amn = (aij)
m×n
is used to standardize the data. Because of all indicators are positive indicators, and the formula is:
Second, the TOPSIS method calculates the comprehensive index. Multiply the dimensionless performance evaluation standardized decision matrix Cmn = (cij)
m×n
with the performance evaluation index weight vector w = (w1, w2, … wj) calculated by the EWM, the weighted performance evaluation standardized decision matrix Rmn = (rij)
m×n
, and rij = wj × cij. Calculate the optimal solution and the worst solution of the comprehensive index, the optimal solution vector:
Assessing the Impact of Environmental Regulation—DID Method
In the evaluation of environmental regulation’s (ecological compensation policy) impact on IEP, we employ the Difference-in-Differences (DID) method. This approach, known for its capability to control for unobservable factors that may simultaneously influence both treatment and control groups, offers more precise estimates of policy effects (Bai et al., 2023; Wing et al., 2024). Consequently, it is widely adopted, affording us the opportunity to investigate the effects of environmental regulation implementation (Chen et al., 2023; Y. Cheng et al., 2023; Han et al., 2024). The fundamental premise involves treating provinces implementing environmental regulation as the treated group, while those abstaining serve as the control group. It is essential for the control and treated groups to exhibit equivalence in their conditions, with changes in IEP observed for both groups during policy implementation. The change observed in the control group approximates the counterfactual change had it not participated in policy implementation. The equation as follows:
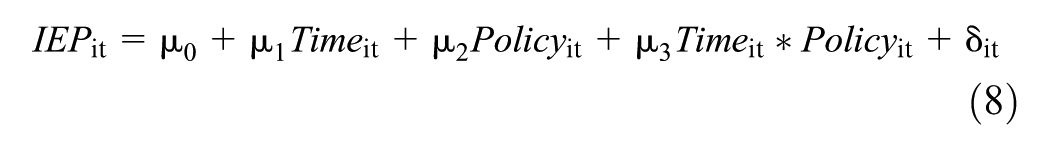
In Equation 8, i represents the province, t represents the time, IEPit represents the IEP of the i-th province in the t-th year, and δ is random error. Time is a dummy variable with a value of 1 in 2008 to 2015 (after policy implementation), and Policy is a treatment for the province implementing ecological compensation policy (dummy of 1 assigned). The difference in the treated group before and after policy implementation is expressed as a coefficient of μ1 + μ3, while the average difference in the control group before and after policy implementation is μ1, and Time*Policy is a cross term, and its coefficient μ3 is used to test the effect of policy implementation. Given the panel data nature of this study, we incorporate province-fixed effects (ωi) and time-fixed effects (πt), alongside the inclusion of province-level control variables (Xit). Consequently, Equation 8 can be expressed as follows:

Xit represents a series of covariates that affect IEP, namely Enterprise Size (Size), Labor Capital (Labor), Profit Level (Profit), Export (Export) and Foreign Direct Investment (FDI). Size measures the number of enterprises; Labor represents the number of workers, and Profit is the proportion of industrial income in sales value. Export and FDI measure the ratio of exports over total sales and foreign capital value, respectively. All measures were expressed in logarithms. The rationale for the choice of covariates is as follows. Larger enterprises have greater productivity (X. Ren et al., 2022), while growth theory suggests the role of labor and capital in production efficiency (Aiyar & Feyrer, 2002; Baharin et al., 2020). Similarly, enterprises with higher profits are more likely to reduce bad outputs improving the industrial eco-productivity (Mithas et al., 2010). Exposure to international markets promotes industrial eco-productivity (Zhao & Lin, 2020), and foreign capital improves production efficiency through absorptive capacity (H. Yu et al., 2022).
Results and Discussion
The State of IEP and Its Distribution
Table 1 reports the descriptive statistics. The maximum value of the industrial IEP is 2.5, and the minimum is 0.23, indicating a large gap with an average being 0.94, which is close to 1. Examination of the decomposition of the IEP shows that the mean of EC is 1, while TC has a value of 0.95 (see Table 1). On average, the mean value of EC appears to be slightly higher in the treated province (1.009) than in the control groups (1.001), while TC is 0.935 and 0.948 for the treated and control groups, respectively. Comparing the periods before and after policy implementation, EC is 01.042 and .969, while TC is 0.935 and 0.955, respectively. Overall, the assessment of the decomposition scores shows that TC contributes more to IEP improvements on average than EC.
Descriptive Statistics.

Figure 2 shows the IEP values by province for 2007 (before the policy was implemented) and 2010, and for 2015 after the policy was implemented. In 2007, IEP was mostly below 1 with an average of 0.879 for the 30 provinces. In 2010, in most cases, the IEP in the treated group improved to varying degrees after the implementation of the policy, which provides initial evidence that environmental regulation has a positive effect. Nevertheless, in 2015, IEP declined to varying degrees in most provinces in the treated group, suggesting that the policy effectiveness of environmental regulation has a practical threshold effect. Once the effectiveness period has elapsed, the policy effect is weakened (Ouyang et al., 2020; F. Wang, 2023). This implies that the enhancement of IEP necessitates continuous support from environmental policies that require sustained attention from policymakers.

IEP across 30 provinces, China, 2007, 2010, and 2015.
Impact of Environmental Regulation—DID Results
Table 2 presents the regression outcomes of the DID estimation outlined in Equation 9. To facilitate comparative analysis, we present three distinct models. In Model 1, base model without covariates, the coefficient of interaction term (Time*Policy) exhibits statistical significance at the 5% level, suggesting a positive effect of environmental regulation on IEP. Model 2, controlling time-fixed effect, reveals a significantly negative coefficient for Time at the 5% level, implying a gradual decline in IEP for industrial enterprises in the pilot area in the absence of environmental regulation intervention. A comprehensive examination of the model incorporating both province-fixed effects and time-fixed effects, denoted as Model 3, demonstrates a significant impact of environmental regulation at the 5% level upon the inclusion of additional covariates. However, the coefficient of the interaction term decreased from 0.0945 to 0.0834. Net wise, we find the difference in IEP in the treated group when compared to the control group to be higher between 0.0834 and 0.0945. This indicates that environmental regulation is crucial to improving the IEP of industrial enterprises. This is because environmental regulation encourage companies to adopt more environmentally friendly production methods, such as reducing emissions and improving resource utilization efficiency (Cheng et al., 2023; S. Yu et al., 2023). In addition, this also shows that the incentive effect of environmental regulation is greater than its inhibitory effect (W. Yang & Wang, 2023). Technological innovation driven by environmental regulation results in an innovation compensation effect, outweighing resource investment and implementation costs (J. Liu & Liu, 2023), thus boosting IEP. In Model 3, other covariates that have significant effects are as follows. The coefficient of Labor has a significant positive impact on the IEP. In other words, the higher proportion of labor-intensive enterprises have higher IEP. Similarly, Size has had a negative impact at the 1% level, thus, indicating that the larger the scale of the enterprises, the lower is their IEP. Interestingly, FDI and Export have a negative impact, while Profit has a positive impact on IEP, although not significant. It may suggest that industrial enterprises with higher profits have more retained earnings and can overcome the adverse effects of environmental regulation that reduce the production capital investment of industrial enterprises, thereby improving the IEP of industrial enterprises.
DID Estimation Results.

Note. The value in brackets is the standard error of clustering at the provincial level.
p < .01. **p < .05.
Spatial Analysis
Spatial effects, stemming from spatial heterogeneity and spatial dependence, can exert a significant influence. Thus, we extend our analysis to investigate the spatial effects of environmental regulation on IEP. To assess spatial autocorrelation within the sample data, we constructed a spatial matrix utilizing a binary distance matrix, computing Moran’s I index. This allows us to determine whether IEP exhibits spatial effects. Recognizing that geographical distance influences the spatial impact of environmental regulation on IEP, we incorporate a more precise inverse geographical distance matrix into the regression equation. The specific formula is articulated as follows:

For additional robustness, an economic distance matrix can be constructed,

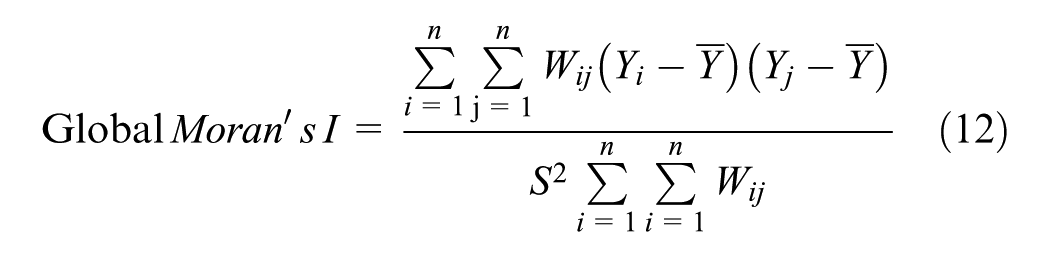
In Equations 10 to 12, Wij denotes the (i, j) element representing the spatial distance between province i and j in the spatial weight matrix. S2 represents the sample variance, while Y represents the sample mean. To mitigate potential conflicts between spatial and the DID approach, this study employs the spatial autoregressive (SAR) model. Building upon Equation 9, the formula is expressed as follows:

In Equation 13, W represents the inverse geographic distance matrix, with the remaining variables consistent with those in Equation 9. Table 3 presents the results of the spatial autocorrelation test for IEP. Across the years 2001 to 2015, Moran’s I Index indicates spatial correlation in half of the years, suggesting spatial correlation within IEP. Table 4 displays the regression outcomes regarding the spatial impact of environmental regulation on IEP. The findings reveal a significant positive effect of environmental regulation on enhancing IEP, further affirming its role in improving IEP. Within the SAR model, the spatial coefficient for IEP is significantly negative. This suggests a potential adverse influence of environmental regulation in neighboring provinces, possibly indicating a phenomenon where enterprises relocate polluting industries to provinces with less stringent environmental regulations. This indicates that provinces implementing environmental regulation exert negative spatial effects on those that do not, potentially suggesting industrial enterprises are shifting their polluting industries to provinces with less stringent environmental regulation, thus potentially risking these provinces becoming “Pollution Havens.” This phenomenon suggests industrial enterprises may tend to establish production bases in regions with relatively lax environmental regulation to circumvent stricter environmental requirements (Li et al., 2023), thereby reducing costs and increasing profits (Z. Yu & Choi, 2024). Additionally, disparities in environmental policies between provincial governments may lead to selective investments by enterprises in different regions, exposing regions with stricter environmental regulation to the risk of industrial relocation. Consequently, governments need to enhance inter-provincial cooperation and coordination on environmental protection to prevent occurrences of “pollution spillover” and “competitive relaxation of environmental standards” (H. Li & Lu, 2022).
Spatial Autocorrelation Test Results.

p < .05. *p < .1.
Spatial Regression Results.

Note. The value in brackets is the standard error of clustering at the provincial level.
p < .05. *p < .1.
Mechanism Assessment and Regional Heterogeneity
This study formulated a moderator effect equation model to examine the indirect influence of environmental regulation on the IEP of industrial enterprises. The aim is to evaluate whether environmental regulation can impact the IEP of industrial enterprises through a mechanism involving innovation and product structure. The equations are outlined as follows:
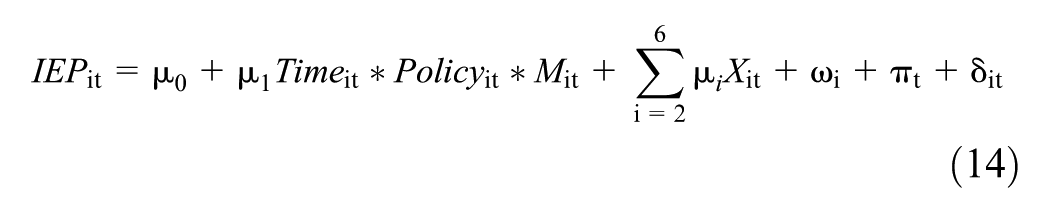
Mit denotes the moderator variable chosen for analysis. Drawing from relevant literature, we identified R&D activities (R&D) and product structure (PS) as moderator variables. R&D is quantified by the ratio of R&D expenditure to profit, while PS is assessed by the ratio of the sales value of new products to the total industrial production value. The other variables remain consistent with those in the preceding Equation 9. To examine regional disparities and reevaluate the effects of environmental regulation, the sample areas were segmented into three regions: eastern, central, and western.
Tables 5 and 6 report regression results for the mechanisms analyzed and the three regions, respectively. From the overall sample results, it can be found that environmental regulation can promote the improvement of the IEP of industrial enterprises through both R&D expenditure and product structure. This underscores how such regulations typically incentivize industrial firms to augment investments in eco-friendly technologies, such as energy-saving and emission-reduction innovations, thereby enhancing production process efficiency and resource utilization (Cheng et al., 2023; J. Wang et al., 2024). Moreover, companies adept at adapting to and proactively complying with environmental standards often garner enhanced market recognition and governmental backing, thereby bolstering their competitive edge (Achmad et al., 2023; Zhang et al., 2024). This heightened competitiveness often spurs further R&D investment and technological innovation (Huang, 2023), leading to continuous IEP improvement. Furthermore, stringent environmental regulation frequently impose controls on resource-intensive and polluting industries, prompting a shift toward cleaner sectors and technologies (Lee et al., 2023). By reallocating resources toward clean energy, eco-friendly technologies, and green industries (Bei & Wang, 2023), companies can mitigate resource consumption and environmental pollution in their production processes, thereby enhancing IEP.
Results of Mechanism Analyze.

Note. The value in brackets is the standard error.
p < .01. **p < .05. *p < .1.
Results of Heterogeneity Analysis.

Note. The value in brackets is the standard error.
p < .05.
Interestingly, the influence of environmental regulation on IEP exhibits regional heterogeneity. While environmental regulation significantly impacts IEP in the central region, its effect is positive yet statistically insignificant in both the eastern and western regions. This discrepancy may stem from the migration of pollution-intensive industries from the eastern to the central and western regions of China (S. Fu et al., 2021; J. Hu et al., 2019). The rise in IEP in the eastern region resulting from this relocation renders the impact of environmental regulation non-significant. Conversely, the implementation of environmental regulation in the central region prompts the relocation of pollution-intensive industries to the western region, consequently significantly enhancing its IEP. However, the influx of pollution-intensive industries from the eastern and central regions to the western region offsets the positive impact of environmental regulation on IEP, yielding an insignificant outcome. This further underscores the adverse spatial impact of environmental regulation and underscores the heterogeneous nature of its influence across China’s three regions.
Robustness Test
Parallel Trend Test
A fundamental assumption of the DID method is the parallel trend assumption, which necessitates that both the treated and control groups exhibit parallel trends that do not significantly deviate over time. The regression equation representing this assumption is as follows:

Where Time*Policy is a dummy variable, taking the value of 1 if province i has implemented an environmental regulation policy during the t−j period, and 0 otherwise. Here, m and n denote the number of periods before and after the time of policy implementation, respectively. The year 2007 was selected as the cut-off period to prevent multicollinearity (Z. Cheng & Li, 2022; Qian et al., 2021).
Table 7 presents the results of the parallel trend test, indicating that both the treated and control groups exhibited similar change trends before 2008. This finding supports the parallel trend assumption and validates the reasonableness of the DID method. Additionally, the results suggest a lag effect in the policy impact of environmental regulation, notably evident in 2011 and 2012. Subsequent to the enactment of environmental regulation, insufficient enforcement (Xiang & van Gevelt, 2020) or the high tolerance of enterprises for pollution penalties (Chang et al., 2020) may have potentially led to a smaller potential positive impact on IEP and in some years not reflecting those positive impacts. This also explains why IEP showed a downward trend in the latter period.
Parallel Trend Test Results.

Note. The value in brackets is the standard error of clustering at the provincial level.
p < .01. **p < .05. *p < .1.
PSM-DID Test
The PSM-DID (different in different based on propensity matching scores) method amalgamates the strengths of both PSM and DID approaches. This integration serves to mitigate errors arising from endogenous selection and enables the control of unobservable variables that remain constant over time. While the PSM method addresses sample selection bias and reduces observed data discrepancies, DID offers robust estimations. However, it’s crucial to recognize that solely comparing outcome variable differences between treated and control groups may yield biased estimators due to potential dissimilarities in observational variables. Thus, rectifying biases arising from the lack of distribution overlap between treated and control groups is imperative to discern the true policy effect. The PSM method achieves this by comparing the treated group with samples closely resembling them to construct a control group (matching). To this end, we utilize logistic regression to estimate the conditional probability of industrial enterprises in each province being assigned to the treated groups:

Where Policyit = 1 indicates that the industrial enterprises in the province are treated while Policyit = 0 indicates otherwise. Xit represents a series of covariates as mentioned earlier. Additionally, the propensity score matching estimation requires that the covariates are evenly distributed between the matched and control group enterprises. If there is a large difference between the covariates after the match, then the choice of covariate or matching method is inappropriate, and the propensity score matching estimation is invalid. Therefore, a matching balance test is performed. In theory, there are multiple methods for PSM, and the matching results are progressively equivalent. This paper adopts a one-to-one nearest neighbor matching method to match. After matching, the DID regression (Equation 9) is estimated on the matched data to obtain a more robust result.
Propensity Score Matching and Balance Test Results
Table 8 shows the logit regression and the balance test results. It shows that Export can play a significant role in the industrial enterprises entering the treated group. In addition, it also shows that industrial enterprises in treated provinces have higher trade exports than industrial enterprises in non-pilot provinces. The one-to-one nearest-neighbor matching balance test before implementing environmental regulation shows that the mean of each covariate is the same between the treated group and the control group. The p-value of all matching variables after matching is greater than 0.1, indicating that there is no significant difference between the matching variables of the treated group and the control group. After matching, the biases of all matching variables are around 0, and the absolute value of Bias is far less than 20% (Figure 3), indicating that the characteristics of the treated group and the control group are very close after matching, satisfying the balance assumption of PSM (Rosenbaum & Rubin, 1985). This shows that the matching variables and matching methods selected are reasonable. Further analysis shows that after using the nearest neighbor matching method, the gap between the two narrowed, and the trend was the same (Figure 3), further indicating that the matching result is ideal. In addition, we can only consider the matching result to be more accurate when the propensity score of the treated group and the control group overlap to a large extent (Heckman & Vytlacil, 2001). Intuitively from Figures 3 and 4, it is found that about 50% of the samples are in the common value range, and only a small number of samples are lost when performing propensity score matches.
Logit Propensity Score Estimation and Balance Test Results.

Note. The value in brackets is the standard error.
p < .01.

Changes in bias before and after the propensity score and the range of common values.

Kernel density distribution of propensity scores before and after matching.
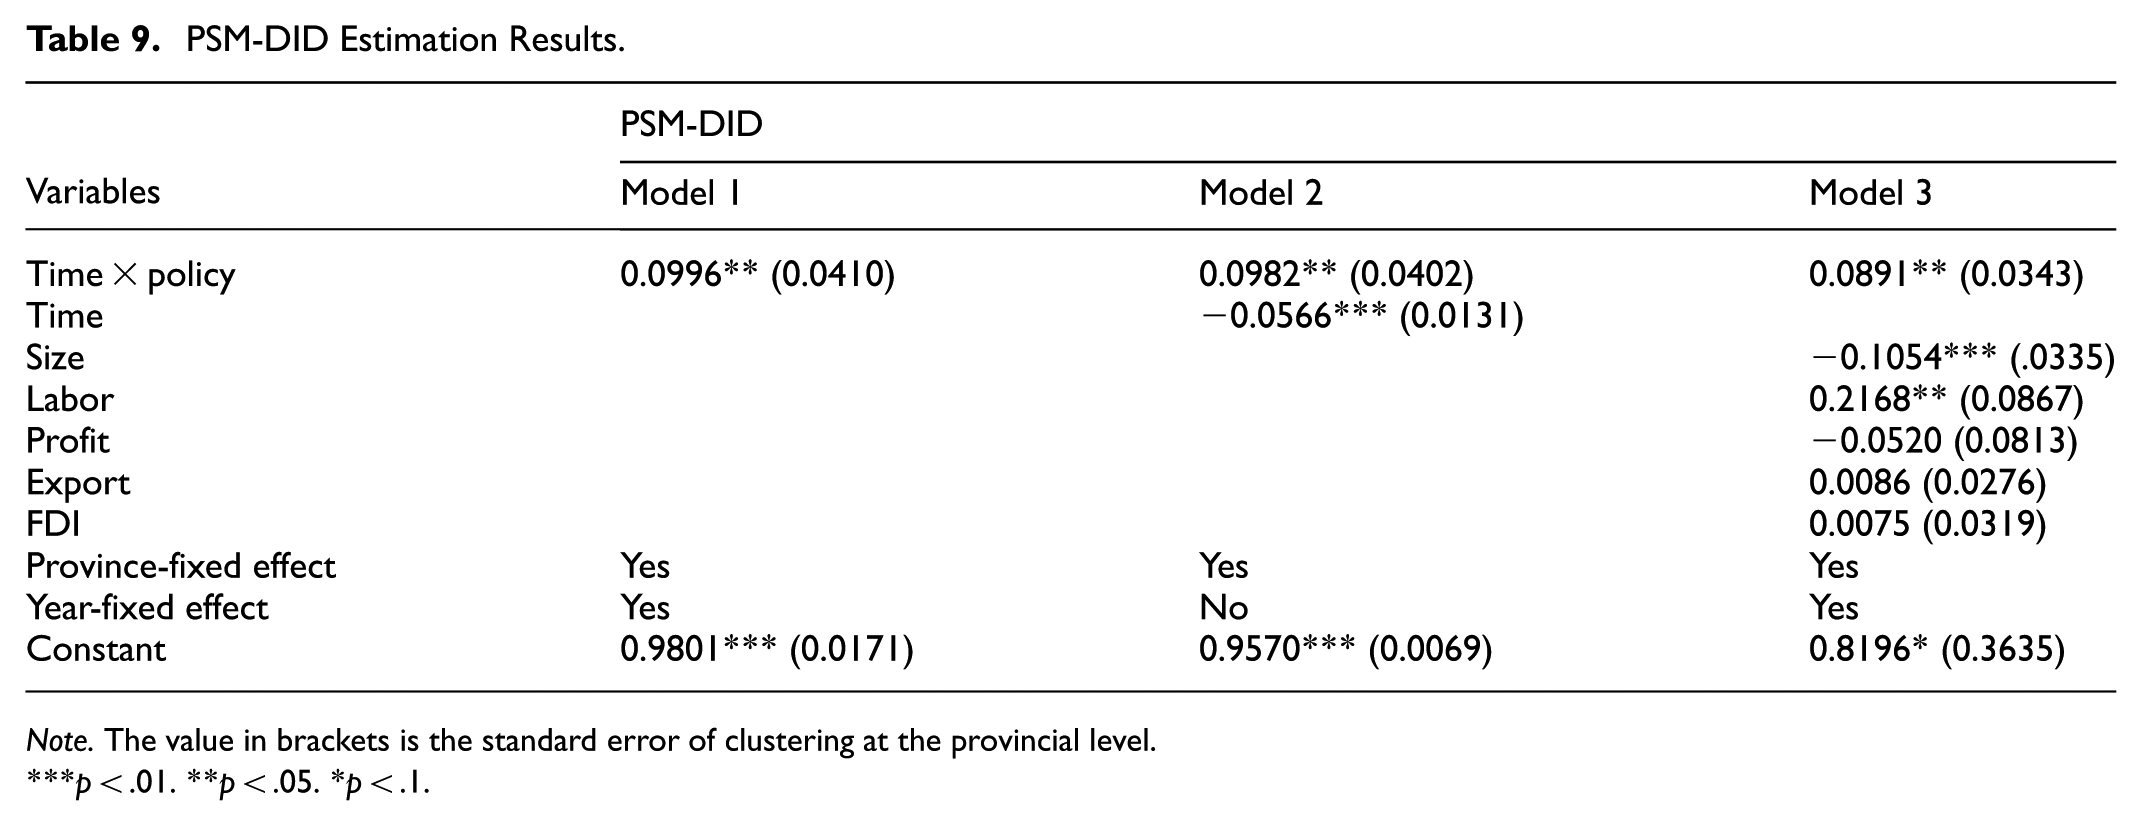
PSM-DID Results
The balance test shows that the PSM results are valid, and we further perform regression as specified in Equation 9 on the matched data. Compared Table 9 results with the results in Table 2, the sign and significance of the interaction term Time*Policy has not changed significantly, and the control variables have the same impacts. We can consider that results are robust.
PSM-DID Estimation Results.
Note. The value in brackets is the standard error of clustering at the provincial level.
p < .01. **p < .05. *p < .1.
Exclude Other Policies Test
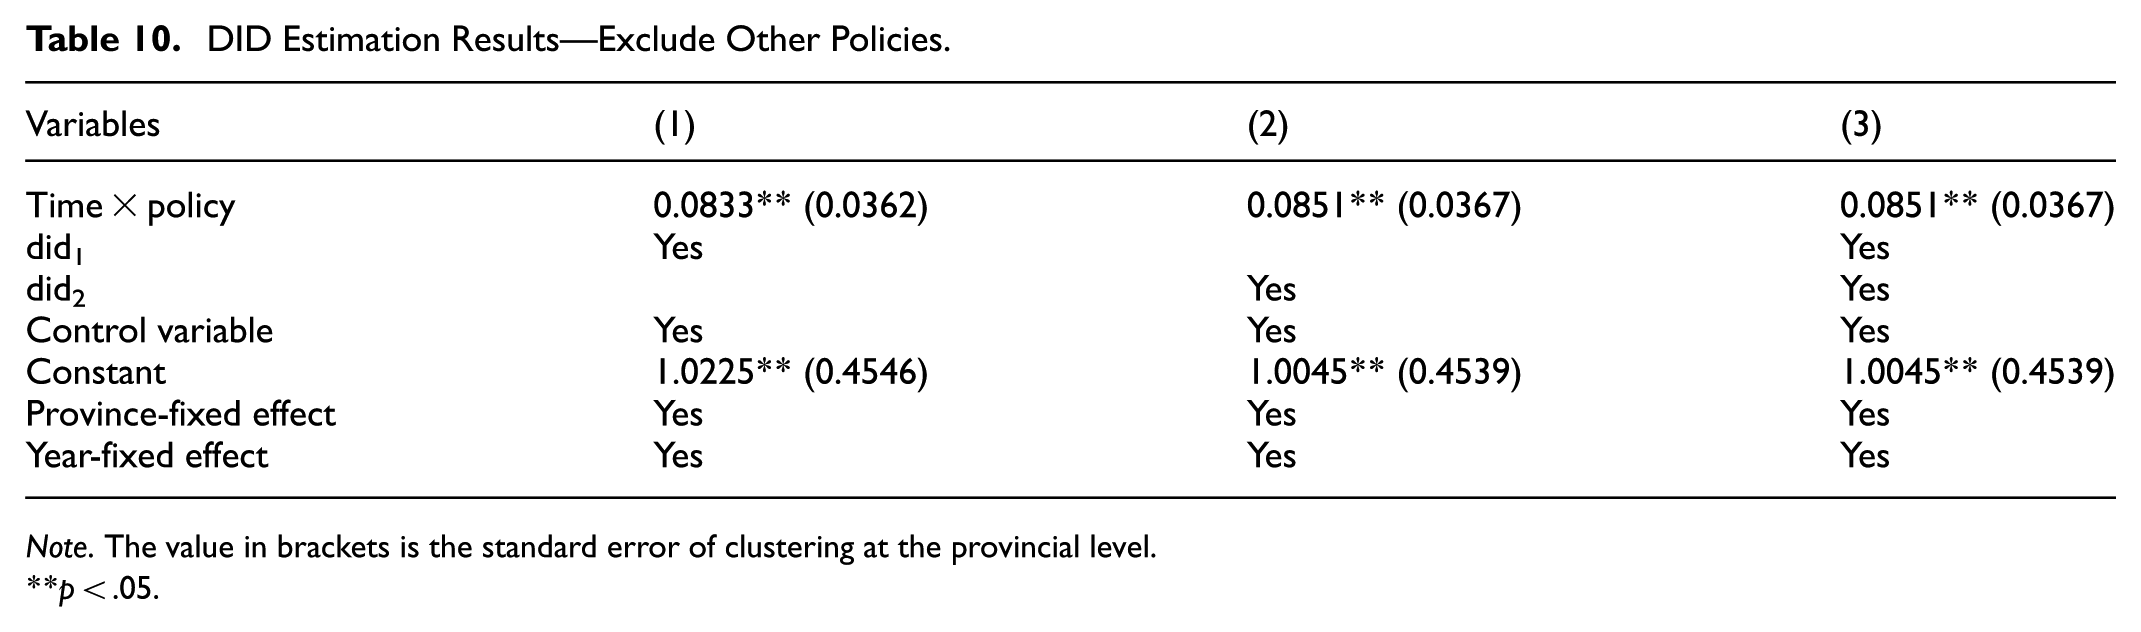
IEP is can be affected by number of environmental regulation policies. This paper tests the robustness by considering two other types of policies. First, is the pollutant discharge fee policy. Since July 1, 2003, China has levied pollution discharge fees on enterprises that emit pollution nationwide. The second is the carbon trading policy. Since 2013, China has gradually selected nine provinces (cities) as pilots to implement the policy, namely Shenzhen (June 2013), Beijing (November 2013), Shanghai (November 2013), Guangdong (December 2013) month), Tianjin (December 2013), Hubei (April 2014), Chongqing (June 2014), Sichuan (December 2016), Fujian (December 2016). Because these two policies will affect the IEP of enterprises, to exclude the influence of these two environmental regulation policies, this study constructs the following equation based on Equation 9,

In Equation 17, did1 and did2 represent dummy variables. If province (city) i enacts the pollutant discharge fee policy (carbon trading policy) in year t, did1 (did2) takes on the value of 1 after the t-th year for province (city) i, and 0 otherwise. Table 10 presents the estimated outcomes subsequent to controlling for these two policies. Irrespective of whether a single policy or both policies are controlled, the coefficient of Time*policy remains significantly positive at the 5% level. This suggests that the observed increase in IEP stems from the environmental regulation policy scrutinized in this study.
DID Estimation Results—Exclude Other Policies.
Note. The value in brackets is the standard error of clustering at the provincial level.
p < .05.
Placebo Test
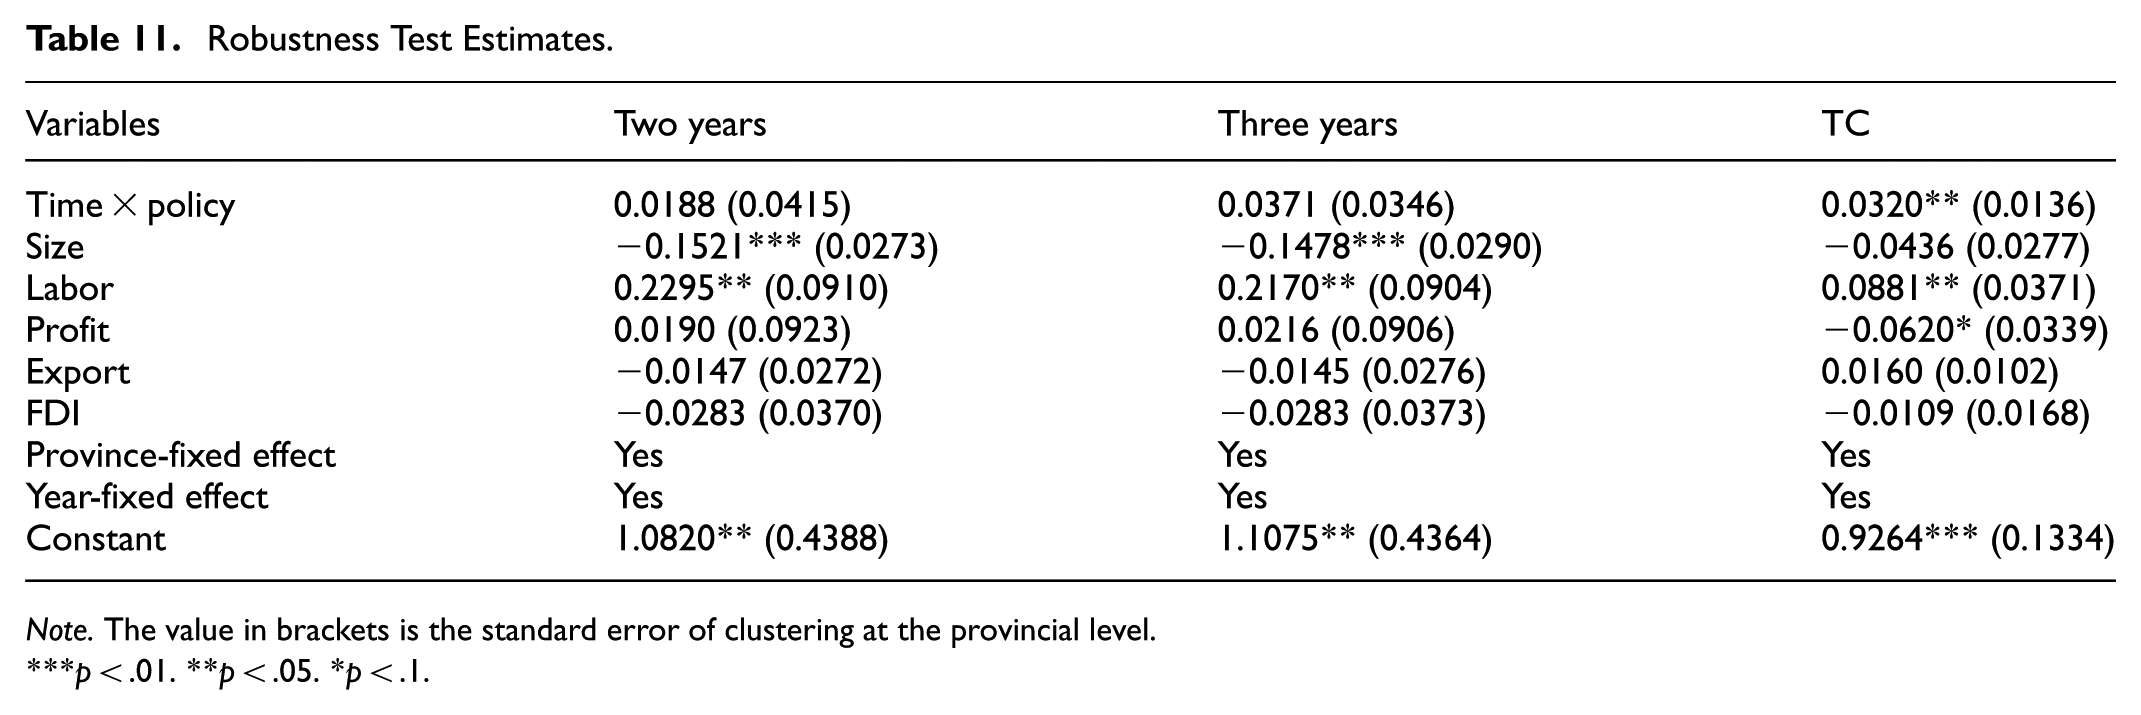
This study employs two methodologies to assess placebo effects. Firstly, by altering the timing of policy implementation, we aim to test the robustness of our findings, particularly examining the interaction term coefficient for significant changes, which helps ascertain the stability of benchmark results (Topalova, 2010). To this end, we adjust the policy implementation cutoff to 2 years following and 3 years preceding 2008. Should the coefficient of the Time*Policy interaction term remain significantly positive, it suggests the influence of other extant factors on the observed disparity in IEP. Conversely, its insignificance would corroborate the robustness of our DID regression results. The rationale posits that when the implementation period is shifted to non-implementation phases, the significance of the interaction variable should diminish. Table 11 presents the outcomes of the time placebo test, revealing non-significance, with minimal alterations observed in the results of other covariates compared to the baseline regression outcomes.
Robustness Test Estimates.
Note. The value in brackets is the standard error of clustering at the provincial level.
p < .01. **p < .05. *p < .1.
Secondly, we undertake randomization of both the treated and control groups. Specifically, we designate six provinces as a “pseudo-treated group” from a total of 30 provinces, generating corresponding “pseudo-policy dummy variables” for Time*Policy. Subsequently, we re-estimate Equation 9 through 1,000 simulations, yielding 1,000 estimated coefficients and their associated p-values. Figure 5 illustrates the placebo test outcomes. The vertical dotted line denotes the actual estimation value of the DID model (0.0834, Table 2), while the horizontal dotted line represents a significance threshold at 0.1. The figure illustrates that the majority of estimated coefficients are concentrated near zero, with most p-values exceeding .1. This observation implies that the enhancement of IEP in the treated provinces is not attributable to random factors but rather to the effect of regulation.
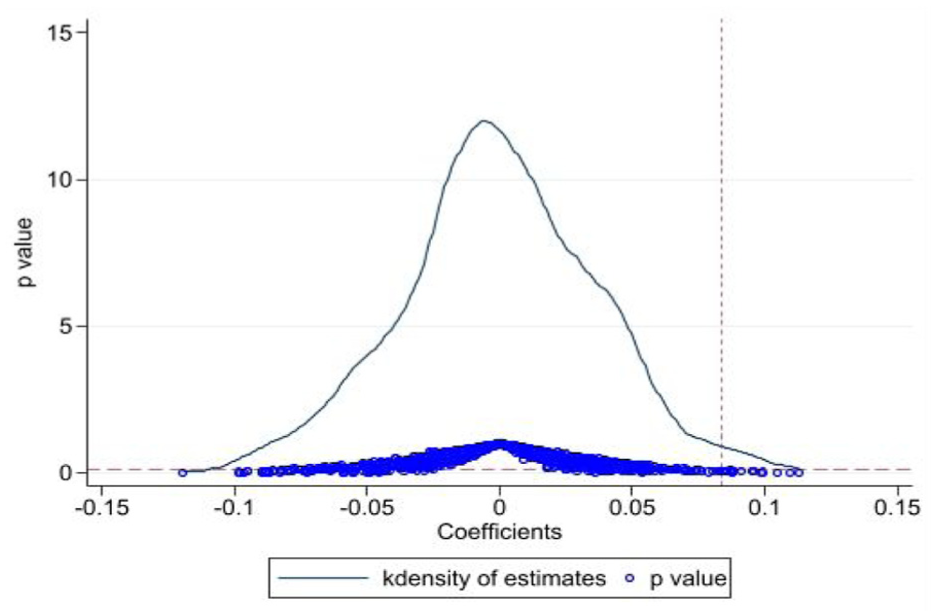
Placebo test result.
Surrogate Index Test
To mitigate potential bias stemming from the selection of indicators impacting regression outcomes, this study conducts a new estimation using the DID approach on TC, which represents the decomposed value of IEP signifying technological progress changes. Given the previously observed lower contribution of TC to IEP, it is imperative to scrutinize the impact of environmental regulation on TC. Indeed, for China to sustain long-term improvements in IEP, it is crucial that environmental regulation fosters TC. The findings reveal a positive and statistically significant estimated coefficient for the interaction term Time*Policy at the 5% significance level. Furthermore, the significance of relevant covariates remains largely consistent with the sign and benchmark regression, further affirming the robustness of the regression outcomes (see Table 11). However, policymakers should strive to ensure that environmental regulation interventions exert a more pronounced effect on TC than presently observed.
Implications and Conclusions
With increasingly prominent global environmental issues, policymakers are paying more attention to the impact of industrial activities on the environment and seeking effective regulatory measures to protect the sustainability of the ecological environment. Our analysis in China indicates that the IEP of the 30 provinces in China is not ideal and it varied despite, on average, it is very close to the expected level. Furthermore, after the implementation of environmental regulation in 2008, the IEP of the treatment group also showed varying degrees of improvement. However, the average difference in policy effects between the treatment and control groups remains small. On average, technological progress contributes more to IEP improvements than technical efficiency. The implications of our results are that while ecological compensation policies appear to contribute to IEP improvement, they require closer monitoring and evaluation as there appears to be varying degrees of heterogeneity and technological progress is crucial. The provincial government should take this heterogeneity into account when implementing the regulatory framework and aim to create a better system to promote technological advancement as part of the compensation regulatory system.
Secondly, this paper further analyzes environmental regulation’ direct and spatial impacts on IEP. It shows that environmental regulation can significantly improve the IEP of industrial enterprises because environmental regulation encourages enterprises to adopt more environmentally friendly production methods, and the technological innovation driven by environmental regulation generates innovation compensation effects that exceed resource input and implementation costs, thereby promoting IEP, highlighting the importance of environmental regulation to the IEP of industrial enterprises. However, this effect shows different results in different regions of China. The IEP of industrial enterprises in the central region has successfully improved under the background of environmental regulation. Conversely, due to the transfer of pollution-intensive industries from east to west in China, the improvement effect of environmental regulation on the IEP of the eastern and western regions has not been evident. Additionally, spatial regression results show that the improvement of IEP in provinces implementing environmental regulation will inhibit the improvement of IEP in provinces not implementing environmental regulation, which may indicate that industrial enterprises are transferring polluting industries to provinces with less strict environmental regulation, thereby potentially making these provinces “pollution havens.” Therefore, the policy implications is that government needs to strengthen inter-provincial environmental cooperation and coordination to prevent “pollution spillover” and “competitive relaxation of environmental standards.”
Thirdly, with the continuous growth of China’s economy and the accelerated industrialization process, Increased R&D investment and product structure transformation are important supports for achieving sustainable economic growth and important means to cope with global challenges and promote innovative development. This study also explores their role in improving IEP under environmental regulation. The results show that environmental regulation can promote the improvement of IEP of industrial enterprises through R&D expenditure and product structure. This highlights how such regulations typically stimulate industrial enterprises to increase investment in environmentally friendly technologies such as energy conservation and emission reduction, and by controlling resource-intensive and polluting industries, enterprises can reduce resource consumption and environmental pollution during the production process, thereby improving IEP. After verification using different robustness test methods, it is proven that our results are robust.
Based on the above conclusions, this paper proposes the following recommendations. First, policymakers should understand the significant role of environmental regulation in improving IEP and give continuous attention and support to environmental regulatory policies. Second, policymakers should recognize the policy heterogeneity of environmental regulation in different regions. Therefore, the central government should actively promote cooperation and coordination between provincial governments to prevent the formation of “Pollution Havens” among provincial governments. Third, policymakers should realize the importance of product structure and technological progress in strengthening the policy effects of environmental regulation on IEP. By taking these measures, the government can achieve a win-win situation in terms of environmental protection and industrial green development. Nevertheless, some caveats apply to our study. While the ecological compensation policy laid the foundation in 2008, continuous progress in developing regulations and improving mechanisms remains. Therefore, our study only considers the early stages of implementation, not the later progress from 2019, when the National Development and Reform Commission further improves the comprehensive eco-compensation initiatives. Future research can further explore the impact mechanisms of different environmental regulation on industrial ecological productivity, break away from the traditional path dependence of China’s industrial development, and explore how to balance economic and environmental benefits in regulatory implementation.
Footnotes
Acknowledgements
Thanks to the editors and reviewers of Sage Open for their valuable review comments.
Funding
The authors disclosed receipt of the following financial support for the research, authorship, and/or publication of this article: This research was funded by the High-Level Talent Research Start-up Fund of Xiamen City University, supporting the project “The Path and Mechanism of Enterprise Digital Intelligence Transformation on the Coordinated Development of Two-Way FDI.”
Declaration of Conflicting Interests
The authors declared no potential conflicts of interest with respect to the research, authorship, and/or publication of this article.
Data Availability Statement
Data sharing not applicable to this article as no datasets were generated or analyzed during the current study.