
Abstract
This paper aims to leverage a unique dataset of enterprises that have undergone clean production audits and employ the propensity score matching difference-in-differences (PSM-DID) method to examine the synergistic effects of clean production audit policies and heterogeneous FDI spillovers on firms’ green global value chain (GGVC) positions. The results indicate that clean production audit policies significantly promote the GGVC position of enterprises. Specifically, the synergistic effect between clean production audit policies and JVs spillovers substantially enhances firms’ GGVC positions, while no significant synergistic effect is observed with WOFEs spillovers. Furthermore, the synergistic effects exhibit notable heterogeneity across different enterprises. This research has important implications for developing countries seeking to facilitate the upgrading of firms’ GGVC positions.
Plain language summary
This study employing the difference-in-differences method based on the propensity score matching, investigate the synergistic effects of clean production audits policy and heterogeneity FDI spillovers on firms’ green global value chain (GGVC) position. The results demonstrate a weak positive impact of clean production audits on firms’ GGVC position. Furthermore, we find that the combination of clean production audits and horizontal spillovers from foreign joint ventures significantly enhances firms’ GGVC position, while no significant synergistic effect is observed with horizontal spillovers from wholly foreign-owned enterprises (WFOEs). Synergies have a more prominent impact on the firms’ GGVC position of cities with more severe environmental law enforcement, medium pollution-intensive industries, and firms with low financing constraints. Further research shows that the talent flow effect and forward and backward spillovers of joint ventures are significantly synergistic with the cleaner production audit policy; however, only backward spillover exhibits a prominent synergistic effect with clean production audits for WFOEs.
Keywords
Introduction
Since the implementation of China’s reform and opening-up policy, Chinese enterprises have actively integrated into the GVC by leveraging their cost advantages, resulting in dual prosperity in foreign trade and the economy. However, due to their reliance on labor-intensive and pollution-intensive production processes driven by labor and resource endowments, Chinese enterprises have encountered a “low-end lock-in” dilemma as they face barriers related to green technology adoption and environmental regulations in international markets (Kano, 2018; Perez-Aleman & Sandilands, 2008). Against the backdrop of ongoing globalization trends in the global economy, it is crucial to explore new driving forces for foreign trade and enhance the position of enterprises within the GVC to achieve high-quality economic development.
In the context of increasingly prominent environmental issues, governments worldwide have implemented varying degrees of environmental regulations. Consequently, it is crucial to examine the impact of these regulations on firms’ GVC position and determine whether they foster or hinder it. Existing research predominantly suggests that environmental regulations can enhance firms’ GVC position by stimulating technological innovation (Huang et al., 2023; Zou & Zhong, 2022). However, a limited body of literature indicates that the relationship between environmental regulations and the GVC is nonlinear due to moderating factors. For instance, F. Li et al. (2022) conducted a study using data from 131 countries and regions, revealing an inverted U-shaped effect of environmental regulations on the GVC initially increasing and subsequently decreasing. Nevertheless, most studies only focus on end-pipe environmental regulations while neglecting front-end regulatory measures. Furthermore, these studies assume uniform application of environmental regulations across all firms within a region or industry without distinguishing those truly impacted by it, potentially introducing biases into their findings.
Meanwhile, extensive research has demonstrated that FDI can have an impact on the environmental performance of host country firms through spillover effects (Dong et al., 2019), as well as their export competitiveness and productivity (Demena & van Bergeijk, 2017; Javorcik, 2004). In recent years, studies have also focused on examining the influence of FDI on participation in GVC (Adarov & Stehrer, 2021; Hoekman & Sanfilippo, 2023; Okah Efogo et al., 2022). Furthermore, existing literature on the factors influencing enterprises’ positions in GVC has largely overlooked the synergistic effects between environmental regulations and FDI. However, firms that have adopted stringent environmental governance measures tend to excel in innovation capabilities and human capital accumulation compared to their counterparts (C. Zhang et al., 2017), thereby enhancing their capacity to absorb FDI spillovers and fostering a synergistic relationship. Importantly, given the distinct relationships among joint ventures, WFOEs, and local enterprises, the resulting spillover effects can vary significantly. Consequently, the synergy between FDI and environmental regulations may exhibit heterogeneity, leading to differential impacts on GVC upgrading. To the best of our knowledge, existing studies have not examined the differential impact of the synergy between front-end environmental regulations and heterogeneous FDI on enterprises’ GGVC positions. This paper aims to address this gap. Compared to existing literature, this paper’s marginal contribution primarily lies in the following aspects: Firstly, while current literature mainly focuses on the impact of end-pipe environmental regulation, there is limited examination of front-end environmental regulation. Furthermore, previous studies on front-end environmental regulation have only analyzed at an industry level without considering enterprises that have genuinely implemented cleaner production (Huang et al., 2023; Yuan et al., 2023). This inevitably introduces bias into estimation results. In contrast, this study selects a relatively unique list of the first five batches of enterprises that have successfully implemented cleaner production audits and passed evaluations published by China’s Ministry of Ecology and Environment. These enterprises are then matched with Chinese industrial enterprise databases, customs databases, and other data sources to enhance the reliability of estimated results through more detailed enterprise-level analysis. Moreover, in terms of methodology, this paper adopts the PSM-DID for estimation, as opposed to the traditional DID method commonly used in existing literature. By employing PSM-DID, this study better addresses potential endogeneity issues among variables, thereby generating more robust and reliable results. Secondly, in the literature on GVC, limited attention has been paid to integrating green factors into analyzing enterprises’ positions within these chains. Given the growing emphasis on green trade by governments and the public globally, examining the role of enterprises in the GGVC holds substantial practical significance. Thirdly, this paper integrates front-end environmental regulations and FDI into a unified analytical framework. It investigates the combined effects of clean production audit policies and heterogeneous FDI spillovers on enterprises’ positions in the GGVC. Specifically, it highlights the distinct impacts of JVs versus WFOEs in terms of how their spillover effects interact with clean production practices to influence enterprises’ positions in the GGVC.
The remainder of this paper is structured as follows: Section 2 presents the theoretical hypotheses, outlining three key hypotheses that guide our research. Section 3 details the research design, including the model specification, variable definitions, and data sources. Section 4 provides the empirical results. Finally, Section 5 discusses the findings, limitations, conclusions, and policy implications.
Policy Review and Theoretical Hypothesis
Brief Policy Review
To comprehensively promote cleaner production and reduce the generation of pollutants, according to the Law of the People’s Republic of China on the Promotion of Cleaner Production, the National Development and Reform Commission of China, and the Ministry of Environmental Protection have jointly formulated and implemented cleaner production audit policies.
Cleaner production audit is a typical front-end environmental governance means, the essence of which is to adopt front-end pollution prevention strategies to fundamentally reduce the generation of pollutants on the products and production processes of enterprises, products, and services. It aims to solve the environmental problems associated with the rapid growth of industry and reduce environmental pollution to a certain extent by regulating pollution-intensive enterprises in various industries. Cleaner production audit is divided into voluntary audits and mandatory audits. The State encourages enterprises to conduct cleaner production audits voluntarily. Enterprises that discharge pollutants up to the national or local emission standards may voluntarily organize the implementation of cleaner production audits and propose targets for further saving resources and reducing the discharge of pollutants. Mandatory cleaner production audit must be conducted for enterprises that discharge pollutants above the national and local discharge standards, or whose total discharge of pollutants exceeds the total discharge control targets approved by the local people’s governments, or which use toxic or harmful raw materials for production or discharge these substances in production.
Since 2005, China’s provincial governments have annually released a roster of enterprises within their jurisdiction as potential candidates for an obligatory annual cleaner production audit. The selection process is based on the enterprises’ historical environmental performance or the resources utilized in their production procedures. The compilation of enterprises will be disseminated through prominent local media outlets and shared with corresponding administrative departments. Each enlisted enterprise is mandated to disclose its pollutant emissions and successfully undergo assessment and acceptance evaluations conducted by local environmental authorities, who also conduct regular inspections on enterprises in the list.
Theoretical Hypothesis
The Impact of Cleaner Production Audits on the Firm’s GGVC Position
Enterprises listed for cleaner production audits face public scrutiny and regulatory pressure from environmental protection authorities. Under this pressure, the implementation of cleaner production audits has three effects on the GGVC of firms. The first effect is cost compliance. As an environmental regulation measure, cleaner production audits increase enterprise costs by internalizing external costs, making it more challenging for them to compete with non-regulated enterprises in foreign markets. Consequently, enterprises may reduce their production scale or allocate funds originally intended for technological innovation toward pollution control measures, which can negatively impact export competitiveness and diminish export volumes (Costantini & Crespi, 2008; Paschoaleto & Martínez-Zarzoso, 2024; Sokolova et al., 2024). Hering and Poncet (2014) examined the influence of environmental regulations on Chinese city exports using China’s dual-control zone policy as an example. They observed a significant decline in exports from pollution-intensive industries following policy implementation. Tsurumi et al. (2015) found that stringent environmental regulations hurt total export volume, particularly within energy-intensive sectors. Additionally, they revealed that environmental factors could have a positive impact on overall GDP due to potential gains in economic energy efficiency resulting from high costs associated with meeting environmental requirements. Y. Zhang et al. (2020) discovered that stringent environmental regulations reduced both the likelihood and total value of Chinese enterprises’ exports, primarily through influencing market entry and exit, price adjustments, changes in export destinations, and product diversification. Cherniwchan and Najjar (2022) utilized a quasi-natural experiment based on Canadian air quality standards to assess the influence of environmental regulations on enterprise exports. The results indicated that certain exporters ceased exporting due to the impact of these regulations, while others who continued exporting experienced reductions in their export volumes. The second effect is the innovation compensation effect. According to the Porter hypothesis, the implementation of environmental regulations leads to increased production costs, which in turn compels enterprises to enhance their production processes, stimulates independent innovation, and drives them to explore cleaner production methods for improved product competitiveness (Porter, 1991). Costantini and Crespi (2008) employ the gravity model and find that environmental regulation and national innovation systems complement each other. Strict environmental regulations play a crucial role in driving the export performance of energy technology enterprises. Zhong and Peng (2022) observe that environmental regulation significantly promotes green innovation among heavily polluting enterprises; over time, however, they note a fluctuating trend characterized by initial decline followed by subsequent growth before declining again overall. Utilizing data from OECD countries, Behera and Sethi (2022) establish a significant correlation between environmental regulation and green technology innovation while also highlighting its encouragement for economic entities to adopt such innovations. Mahmood et al. (2022) and Farooq et al. (2024) both found that environmental regulations have significantly promoted green innovation, thereby facilitating economic transformation. Ahmad et al. (2024), through an analysis of a sample of 24 European countries, concluded that environmental regulations not only foster technological upgrading but also lead to a reduction in carbon emissions.
The third effect is the optimized allocation of resources across various products through cleaner production. Within organizations, there will be a reallocation of resources among different product categories as a result of this scrutiny. Certain highly polluting and energy-intensive goods may experience compression or even withdrawal from the market, while technologically advanced or eco-friendly alternatives are introduced into it instead. Concurrently, the influence exerted by cleaner production requirements prompts resource reallocation toward compliant products, thus bolstering both environmental efficiency and export competitiveness for businesses while elevating their standing within the sustainable global supply chain network. Barrows and Ollivier (2016) devised a multifaceted model encompassing multiple factors and diverse product offerings within heterogeneous firms; their findings underscored how regulatory-driven market competition steers resource allocation toward greener entities. Song et al. (2022) argue that environmental regulatory pressure compels enterprises to adopt green technologies to produce more environmentally friendly products, leading to a reallocation of capital and labor toward these initiatives. Kou et al. (2024) further find that green governance mechanisms, such as green public procurement, facilitate increased investment in research, and development funds and talent specifically for green products.
The overall impact of the cleaner production audit policy on firms’ GGVC position is determined by the interplay of these three effects. Consequently, this study proposes two mutually exclusive hypotheses.
The Impact of FDI Spillovers on the Firms’ GGVC Position
The technology spillover effect brought about by FDI constitutes a significant factor in promoting productivity enhancement in developing countries (Javorcik, 2004; Razzaq et al., 2021). Simultaneously, the knowledge spillover from advanced environmental practices of transnational corporations can enhance the ecological performance of host country enterprises, thereby generating environmental spillover effects. Dong et al. (2019) discovered that FDI-induced energy-saving technological spillovers facilitated China’s firms’ progress toward energy-biased technological advancements. A crucial mechanism leading to environmental spillovers is the greening of manufacturing supply chains. Zhu et al. (2016) examined green supply chain management practices and concluded that domestic enterprises benefited significantly from their foreign counterparts’ exceptional skills and knowledge. As multinational corporations increasingly integrate environmental management policies and practices into their core strategies, they are more likely to generate horizontal and vertical spillovers of environmental performance through demonstration effects, competitive effects, and labor mobility. Kim et al. (2022) found that FDI can promote environmental spillover to enterprises in host countries through community-based and industry-based institutional channels, and the environmental spillover effect of FDI is more obvious for SMEs and regions with higher environmental pollution levels. Therefore, FDI can affect firms’ GGVC position of their related enterprises through technology spillover and environmental spillover.
However, due to differences in the linkages between WFOEs, JVs, and host country firms, they may play distinct roles in spillovers. Firstly, compared with WFOEs, JVs may be more inclined to transfer knowledge such as green manufacturing technology to host companies due to closer collaboration with them (Yang, 2012). Secondly, JVs may be more effective than WFOEs in disseminating technological and environmental practices to host firms. For instance, JV enables it to reveal foreign investors’ know-how to domestic firms; local partners of the venture can apply this knowledge gained from foreign investors to other businesses that do not involve foreign shareholders; when local partners are responsible for hiring employees, they might lack sufficient capacity or incentive to restrict knowledge leakage or employee mobility which contributes toward diffusion of knowledge among host firms; JVs are also more likely than WFOEs to outsource input production activities locally thereby facilitating greater transfer of knowledge (Jiang et al., 2023; Khan et al., 2015; T. Li et al., 2024).In conclusion, we posit that JVs exhibit distinct net spillover effects compared to WFOEs, with JVs potentially yielding more favorable spillover effects and thus playing a more influential role in advancing the GGVC position of host firms. Owing to its robust competitiveness, WFOE enjoys a stronger advantage when competing against domestic enterprises within the same industry in market presence and quality production factors; however, this may have adverse implications for host country enterprises. Simultaneously, due to the independent nature of WFOEs, their knowledge spillover, including green knowledge transfer, tends to be relatively conservative compared to JVs. Furthermore, some WFOEs resort to tactics such as intellectual property rights exploitation and unfair competition to suppress their competitors and safeguard their competitive advantages (Cai & Karasawa-Ohtashiro, 2018; Shi et al., 2024; Tang et al., 2022).
Synergies Effect Between Cleaner Production Audit Policy and FDI Spillovers
There may exist synergies between the policy of cleaner production audit and the spillover effects of FDI. Firstly, environmental regulations have a discerning impact on attracting foreign investments (Qiu et al., 2021). Enterprises that undergo cleaner production audits are more inclined to engage with environmentally friendly FDI under pressure, such as procuring cleaner products from foreign enterprises as intermediate inputs and acquiring knowledge about cleaner technologies and environmental management practices from multinational companies. Simultaneously, the higher environmental standards upheld by foreign enterprises may prompt them to source intermediate inputs from suppliers who comply with environmental regulations (e.g., enterprises implementing cleaner production). These business practices adopted by foreign firms will incentivize their local partners to enhance their environmental efficiency through transactional relationships and improve the overall ecological performance of cleaner production. Therefore, it is challenging for foreign-owned enterprises to utilize the host country as a refuge from pollution and generate spillover effects on cleaner production enterprises in the host country. Enterprises implementing cleaner production audits possess several advantages in R&D investment related to cleaner production, machinery and equipment upgrades, talent recruitment, and training. As a result, they may experience a reduced technological gap with foreign enterprises. As a result, these enterprises are better equipped to absorb environmental and technology spillovers from FDI (Albornoz et al., 2014; Behera & Sethi, 2022; L. Liu et al., 2024). In addition, moderate technology spillover and environmental spillover from foreign-owned enterprises strengthen the “innovation compensation effect” of cleaner production while enhancing the “optimization effect of resource allocation among products.” Simultaneously, this weakens its “cost compliance effect,” thereby influencing the firm’s GGVC position. Feng et al. (2019) and D. Gao et al. (2022) discovered that command-and-control environmental regulations synergistically interact with FDI resulting in significant positive effects on innovation performance in Chinese cities. The positive horizontal spillover effect of JVs can effectively enhance the innovation compensation effect of cleaner production and optimize resource allocation among products while reducing cost compliance effects (Feng et al., 2019). Conversely, WFOEs exhibit prominent negative spillover effects on host country enterprises which amplify the cost compliance effect associated with cleaner production.
Research Design
Empirical Model
If the Difference-in-Differences (DID) method is directly applied to evaluate the policy effect, it may violate the parallel trends assumption. Furthermore, Propensity Score Matching (PSM) can mitigate selection bias between the treatment and control groups by matching units with similar propensity scores, thereby balancing covariates more effectively and enhancing the precision of causal inference. Therefore, this study first employs PSM to select a control group that closely resembles the enterprises participating in the clean production audit, minimizing potential biases from non-random sample selection. Building on this, we adopt a progressive fixed-effect DID model as proposed by Baker et al. (2022):

In the Equation 1, GGVC represents the firms’ GGVC position; CP i is a group-level dummy variable that takes a value of 1 if enterprise i is affected by the clean production audit in the current year and all subsequent years, and 0 otherwise. T is a time-group dummy variable that equals 0 for the years before the implementation of the clean production audit, and 1 for the year of implementation and all subsequent years. Z is the control variable, μ i ,η j , and υ t denote fixed effects related to firm, industry and year respectively; ε accounts for random error.
Building upon Equation 1, we further incorporate the impact of FDI spillover by introducing an interaction term between the key variable of the DID method (CP i × T t ) and FDI spillover (FS):

Among these, the triple interaction term CP i × T t × FS jt captures the synergistic effect between FDI spillover and the clean production audit policy. Specifically, its coefficient reflects how FDI spillover influences the GGVC positioning of enterprises undergoing the clean production audit.
Variable
Firm’s GGVC Position (GGVC)
Similar to the literature (Chor et al., 2021; Wu et al., 2021), this study initially employs the upstream degree of a firm’s exports as a metric for assessing its position within the GVC. Following the approach proposed by literature (Antràs et al., 2012), we first compute the GVC position at the country-industry level using world input-output tables (WIOD), which are matched with industry-specific enterprise data and customs import-export records. The upstream degree of an industry U j captures the proximity between production and final demand, where U j represents a weighted average of stages from input j to final demand. A higher index indicates a larger share of industry output as intermediate inputs, signifying a more upstream placement in the global value chain hierarchy. Consequently, U j is calculated as follows:

The total output of the j industry denoted as Yj, represents the combined value of all goods and services produced by this industry. Meanwhile, Fj refers to the portion of the j industry’s output that directly contributes to final demand. As it only requires one step for this output to be absorbed into the final demand, its weight is assigned as 1. Additionally, djk signifies the amount of j industry’s production used as an intermediate input in sector k to produce a 1 unit of product. To determine the upstream degree Uj of industry j, we can calculate it by taking a weighted average of the number of stages involved from production to final demand:

In Equation 4, Ejit is the total export product of firm i belonging to the j industry,
Based on this, the Green Industry Guidance Catalog (2019 edition) issued by the National Development and Reform Commission of China was consulted to match the product HS code in the customs database with corresponding industries and products within the green industry. This allowed for the extraction of import and export volumes of an enterprise’s green intermediate and final products, which were then used to calculate its GGVC position index.
FDI Spillover (FS)
According to the mode of foreign capital entry, it can be categorized into joint venture spillover and WFOEs spillover. Based on the literature (Jude, 2016) approach and other methodologies, we construct a two-digit intra-industry FDI spillover index. This index is calculated by weighting the average share of foreign capital in the industry with the sales volume of each firm. It effectively captures the spillover effect of FDI on firms within the same sector, encompassing technological and environmental aspects.


Among them, HFSJV jt and HFSWFO jt represent the spillover effect of JVs and WFOEs in two-digit industry j in year t, respectively. Sale it represents the sales of firm i, JV it represents the proportion of foreign capital in joint venture i, and WFO it represents the proportion of foreign capital in WFOE i. nj denotes the number of foreign-owned firms in the corresponding category of industry j, while Nj indicates the total number of firms in industry j.
Control Variable
The control variables selected are as follows. (1) Firm age (Age) measured by the difference between the current year and the opening year of the firm plus one, and the logarithm is taken. (2) Firm Size (Size) measured by the average annual employment of the firm. (3) The firm capital intensity (CL) is quantified by taking the logarithm of the ratio between its total assets and the number of employees at the end of a given year. (4) The firm productivity (TFP) is measured by the ACF method (Ackerberg et al., 2015). (5) Firm profit (Profit) is measured by the ratio of business profits to sales. (6) Enterprise Ownership (Ownership) is defined based on the classification of registration types, where state-owned enterprises are 1 and non-state-owned enterprises are 0. (7) Degree of industry competition (Com) is measured by the Herfindahl index. (8) Intensity of industry environmental regulation (ER) is measured by the industry SO2 removal rate.
Data
The primary datasets used in this study are the Industrial Enterprise Database from the National Bureau of Statistics of China and the Import and Export Trade Database from China Customs. Due to data availability constraints, the most recent year covered by the Chinese Enterprise Industrial Database is 2015. Consequently, our study period spans from 2002 to 2015. The list of enterprises involved in the cleaner production audit project was obtained from those that completed and passed evaluation and acceptance during the first five batches conducted by the Ministry of Ecology and Environment of China. This list includes information on the “list publication time” or “report submission time” for these audited enterprises, signifying their transition into cleaner production entities. A total of 17,862 enterprises participated in this project throughout the study period (excluding Tibet); predominantly comprising industrial production firms. To match data from both the Industrial Enterprise Database and China Customs Database. Enterprise names and codes were employed while eliminating any problematic samples, resulting in a successful matching of 12,785 enterprises. This paper determines when enterprises commenced cleaner production based on two reference points within the list. If an enterprise’s “list announcement time” is specified, it serves as its implementation initiation point; however, if such information is missing or marked as “voluntary,” then its “time of report submission” is considered as its implementation commencement moment. The green product list used herein originates from China’s Green Industry Guidance Catalog (2019 edition) published by the National Development and Reform Commission. Input-output relationships are derived from the World Input-Output Database.
Following the approach of literature (Q. Liu et al., 2020), JVs and WFOEs are defined based on the level of foreign ownership. Firms with less than 25% foreign ownership are categorized as local enterprises, those with 25% to 95% foreign ownership are classified as JVs, and those exceeding 95% foreign ownership are considered WFOEs. Table 1 presents the descriptive statistics of variables.
Descriptive Statistics of Variables.

Empirical Results
Matching Balance Test
The accuracy and reliability of the propensity score matching results depend on the fulfillment of the matching balance condition. Table 2 presents the balance test outcomes for the matching variables between the treatment group and the control group in 2010. It can be observed from Table 2 that, following sample matching, the companion probability of t-statistics for the matching variables exceeds 10%, indicating no significant disparity between these variables in both groups. Furthermore, after matching, absolute standard deviation values for these variables are below 5%. This paper also examines balance among matching variables in other years, with most satisfying this criterion. Consequently, overall sample matching adheres to the balance hypothesis.
Matching Balance Test.

Empirical Results of the Benchmark Model
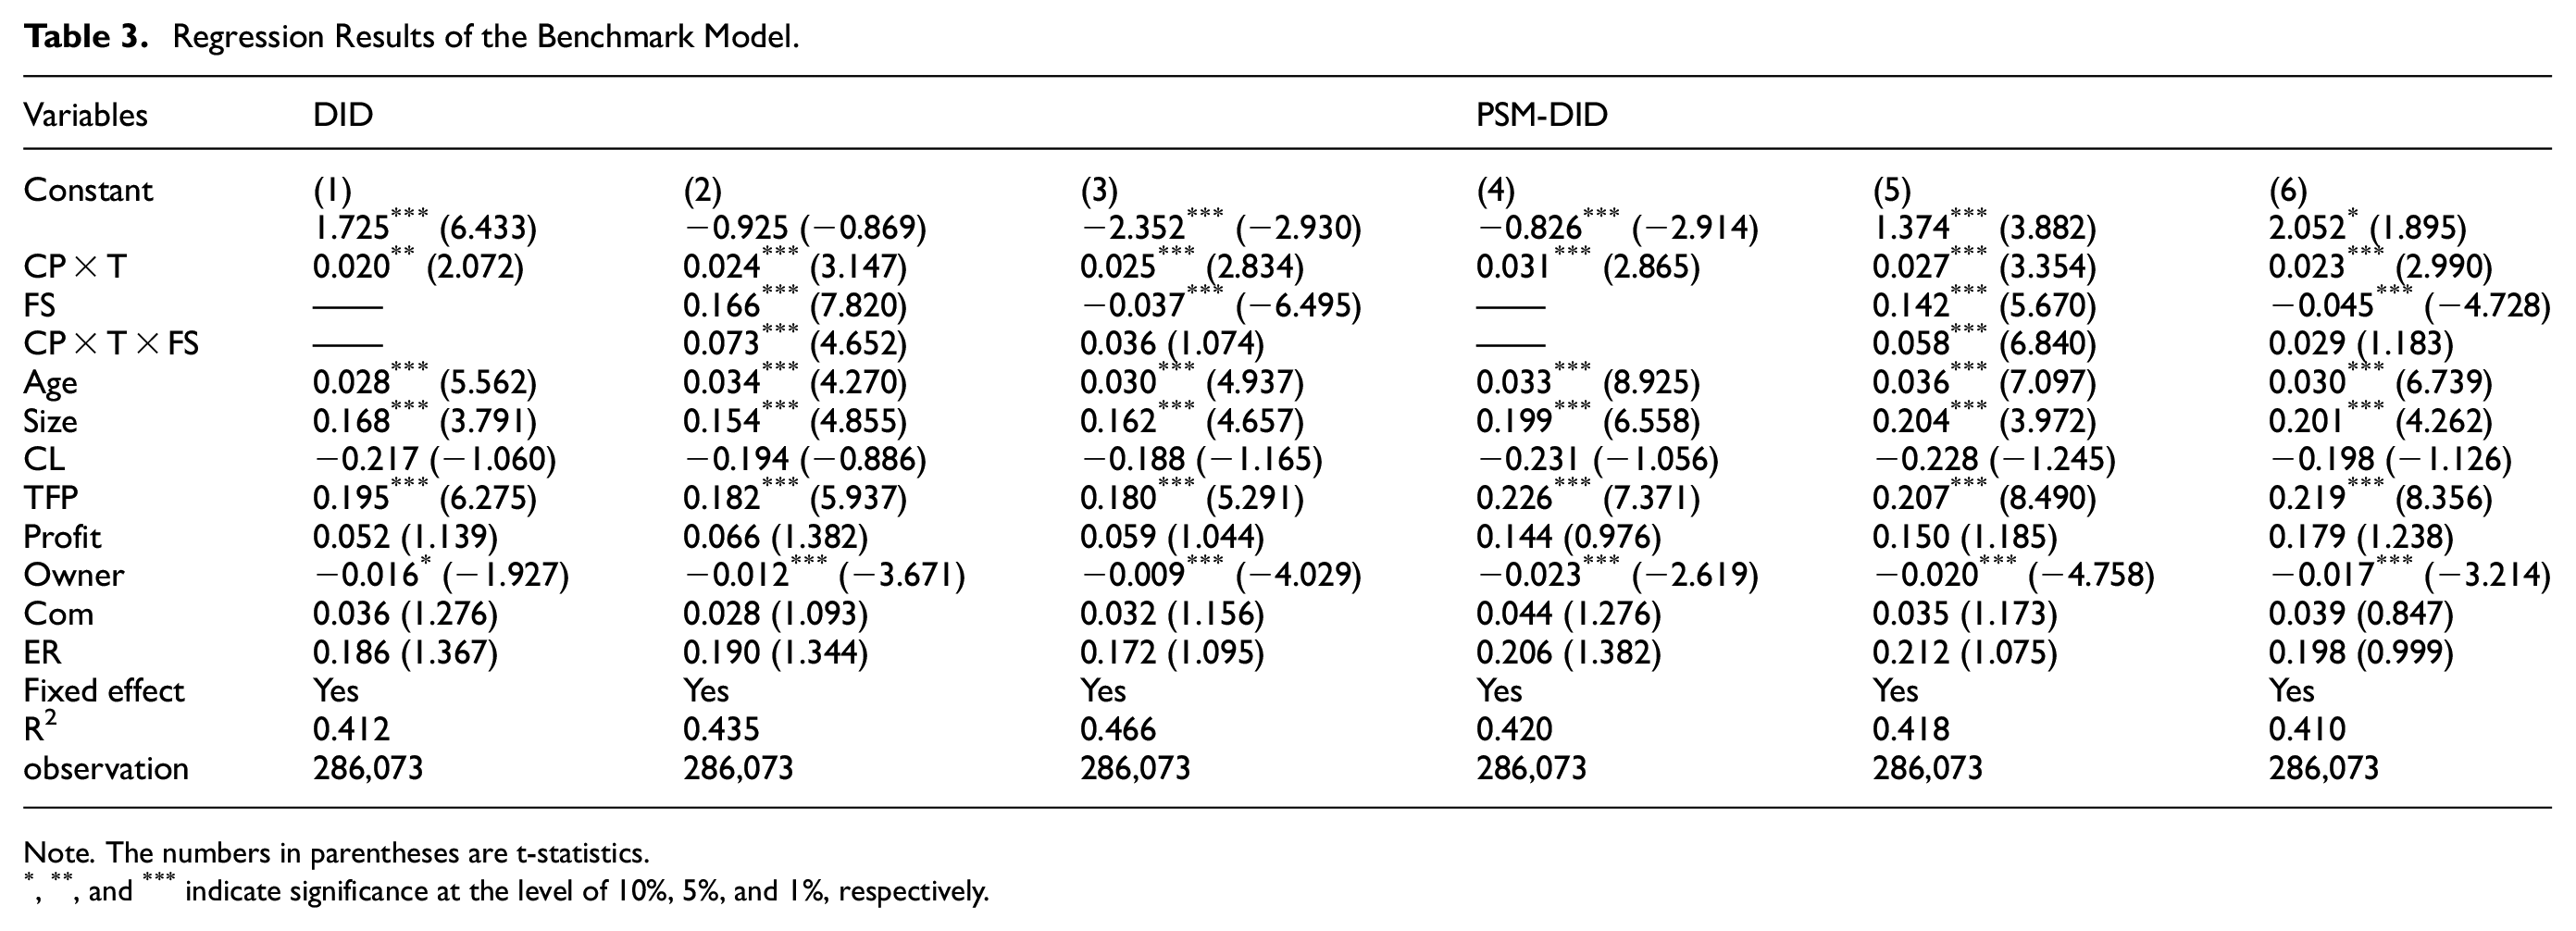
The regression results of the benchmark model are shown in Table 3. We present the results of both the fixed-effect DID and the PSM-DID. The first three columns correspond to the fixed-effect DID analysis, while the last three columns reflect the PSM-DID analysis. Specifically, in columns (2) and (5), FS denotes the spillover effects from JVs, whereas in columns (3) and (6), FS indicates the spillover effects from WFEOs. In each column, the coefficient of CP × T is significantly positive, indicating that cleaner production audits policy promotes firms’ GGVC position, thus confirming theoretical hypothesis 1a.
Regression Results of the Benchmark Model.
Note. The numbers in parentheses are t-statistics.
, **, and *** indicate significance at the level of 10%, 5%, and 1%, respectively.
In Table 3, the FS coefficients in columns (2) and (5) are both significantly positive, indicating that the horizontal spillover effect of JVs has a significant positive influence on the GGVC of enterprises. Conversely, the FS coefficients in columns (3) and (4) are −0.037 and −0.045, respectively, and are significantly negative at the 1% level of significance. It suggests that the horizontal spillover effect of WFOEs significantly impedes the enhancement of the GGVC. These findings confirm Hypothesis 2. The underlying rationale is that JVs, due to their closer collaboration with domestic enterprises, generate positive technological, and environmental spillover effects, thereby enhancing the GGVC of enterprises more effectively. However, WFOEs, lacking domestic partners, maintain stricter control over their technologies and effectively prevent technology leakage and spillover to domestic enterprises. Consequently, the positive technological spillover effects generated by WFOEs are relatively limited. Given the insufficient positive effects to counterbalance the negative ones, the negative FDI technological spillover effect may dominate. Specifically, the competitive disadvantage faced by domestic enterprises due to the stronger competitiveness of foreign-owned enterprises outweighs the relatively minor positive spillover effects, leading to a significant negative impact on the GGVC of enterprises within the same industry.
In the following, focus on the interaction terms (CP × T × FS). For the horizontal spillover of JVs, the coefficient of interaction terms is significantly positive at the level of 1%, indicating that cleaner production, and horizontal spillover of JVs have a significant synergistic effect and promote the improvement of firms’ GGVC position. But for the spillover of WOFEs, the coefficient of interaction terms is not significant, which indicates that there is no significant synergistic effect between cleaner production and WOFEs spillover. Therefore, hypothesis 3 is confirmed. It is mainly because the more prominent positive spillover effect of JVs enhances the “innovation compensation effect” of cleaner production, amplifies the “optimization of resource allocation effect among products,” and weakens the “cost compliance effect.” At the same time, enterprises that pass the cleaner production audit have more advantages in research and development investment, machinery and equipment renewal, talent introduction and training, and better absorb FDI technology and environmental spillover, so the two have a significant positive synergistic effect on the position of the GGVC. However, due to the prominent negative spillover effect of WOFEs on local enterprises, there is no significant synergistic effect between WOFEs and cleaner production audits. Therefore, it is imperative to enhance the collaboration between cleaner production firms and joint ventures, while also considering the potential “crowding out effect” of heightened market competitiveness from foreign-owned enterprises on host country firms.
Instrumental Variable Test
The presence of endogeneity in model estimation is a critical factor that can compromise the reliability and validity of the results, leading to potential biases. To address this issue, following B. Zhang et al. (2023), we construct an instrumental variable based on the promotion pressure faced by local government officials in the cities where the enterprises are located. The rationale for selecting this indicator is twofold: Firstly, higher promotion pressure on officials encourages local governments to implement stricter economic growth and comprehensive evaluation systems, which in turn facilitates the enforcement of environmental regulations. Consequently, enterprises in regions with greater official promotion pressure are more likely to be included in clean production audit lists. Therefore, officials’ promotion pressure is a valid instrumental variable supporting the correlation hypothesis. Secondly, while government officials influence corporate costs, technological innovation, and resource allocation through environmental regulation enforcement, the promotion pressure on officials is not influenced by firms’ positions in the green global value chain, thus satisfying the exogeneity assumption of the instrumental variable. We employ two-stage least squares regression for the instrumental variable test, with results reported in Table 4. The p-values of the K-P rk LM statistics in the second stage are all 0.000, rejecting the null hypothesis of weak identification. Additionally, the F-statistic from the relevance test confirms that the model passes the weak instrument test, validating the effectiveness of the chosen instrumental variables. After controlling for endogeneity using these instrumental variables, the coefficients and significance levels of the explanatory variables remain consistent with those of the baseline model.
IV Estimation Results.

Note. The numbers in parentheses are t-statistics.
, **, and *** indicate significance at the level of 10%, 5%, and 1%, respectively.
Robustness Tests
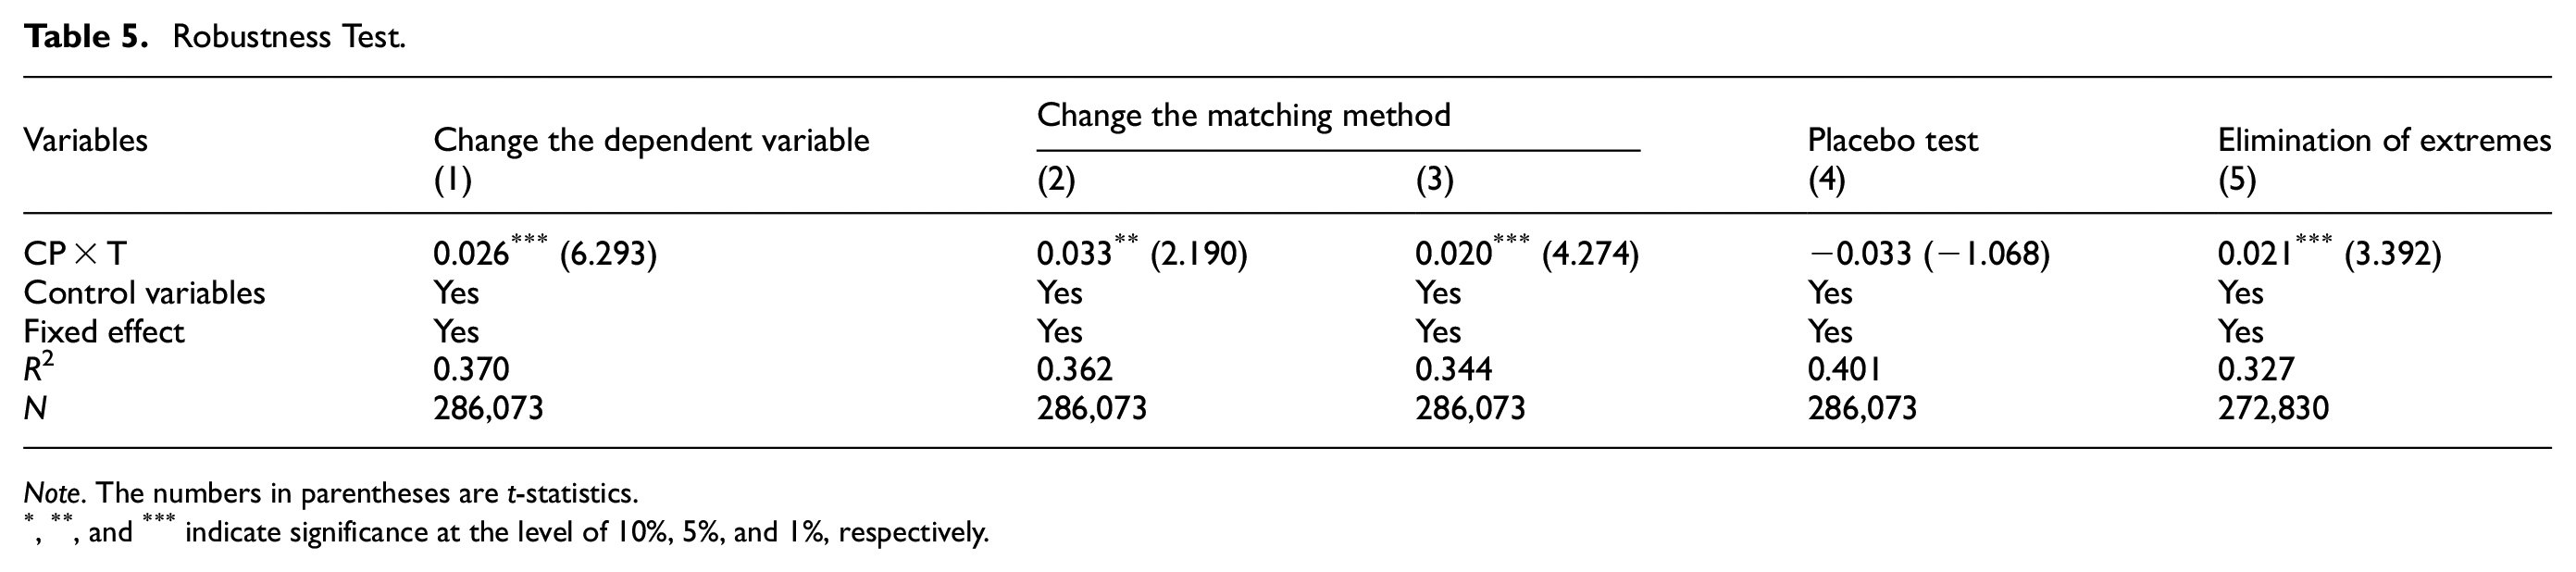
This paper conducts some robustness tests (Table 5). Firstly, the measurement method of the dependent variable is changed. Since the position and participation degree in the GVC respectively measure the depth and breadth of the GVC, the position or participation degree in the GVC is often used in the literature to measure the upgrading of the GVC (Fan et al., 2023). This paper replaces the index of firm GGVC position with the index of firm GGVC participation The calculation method of enterprises’ GVC participation refers to the practice of literature (Zheng et al., 2022), and the results are reported in columns (1) of Table 5. Secondly, to verify the robustness of our findings, we employed alternative matching methods, specifically the radius and kernel matching approaches. The results are presented in columns (2) and (3). The analysis reveals that the significance levels of the key variables and the directions of their coefficients remain unchanged. Thirdly, the placebo test. The “counterfactual” method is employed to verify whether a common trend exists between the treatment and control groups. The basic principle and process are as follows: Assume that the pilot period of the cleaner production audit policy was advanced to 2004, and construct corresponding dummy variables for DID. If the coefficients of CP × T are not statistically significant under this false policy setting, it indicates that a common trend exists between the treatment and control groups. It further corroborates the fact that the GGVC upgrade is driven by the policy. Fourthly, extreme values were excluded. The dependent variable was winsorized at the 5% level and retested. The results are reported in column (5). The results show that the regression results remain consistent with the basic regression results, further strengthening the conclusion of this paper.
Robustness Test.
Note. The numbers in parentheses are t-statistics.
, **, and *** indicate significance at the level of 10%, 5%, and 1%, respectively.
Heterogeneity Analysis
Regional Heterogeneity
Given the significant disparities in economic development, industrial structure, and pollution levels between China’s eastern region and its central and western regions, the impact of clean production audit policies on enterprises’ GGVC positions may differ across these regions. This study categorizes enterprises based on their provincial locations into the eastern region and the central and western regions for further analysis. The empirical results are presented in Table 6. Specifically, the estimated coefficients of CP × T in columns (1) and (2) are both significantly positive. Notably, the coefficient of CP × T is larger in the eastern region compared to the central and western regions. Additionally, the triple interaction term CP × T × FS is only significantly positive in the eastern region. These findings suggest: (1) Clean production standards have a positive effect on enhancing the green production levels of enterprises in both the eastern and central-western regions; (2) The impact is more pronounced in the eastern region; and (3) In the eastern region, there is a synergistic effect between clean production audits and JVs. This phenomenon can be attributed to the fact that the eastern region, being predominantly coastal and economically advanced, possesses abundant innovation resources, and talents, as well as superior financial environments. Consequently, enterprises in the eastern region are better positioned to engage in innovative activities, adopt new technologies for green innovation, and effectively absorb spillover effects from JVs.
Heterogeneity Test (1).

Note. The numbers in parentheses are t-statistics.
, **, and *** indicate significance at the level of 10%, 5%, and 1%, respectively.
Heterogeneity of Urban Environmental Protection Law Enforcement
Enhanced environmental law enforcement is a crucial instrument for urban governments to regulate and mitigate environmental pollution, with the local intensity of such enforcement playing a pivotal role in determining the effectiveness of environmental regulations. The robustness of urban environmental law enforcement can influence the implementation of cleaner production audit policies, and the entry and spillover effects of FDI, thereby shaping their combined impact on the firms’ GGVC position.
The data about the number of environmental administrative penalty cases were from the Peking University Fabao website for this study. Based on the median number of these cases, they were divided into two groups: those with strict environmental law enforcement and those with weak law enforcement. The findings are in Table 6. The results indicate that in cities with strict law enforcement, the coefficient of CP × T is significantly higher compared to those with weaker law enforcement, and there is also a larger coefficient for CP × T × FS. It suggests that clean production audit policies have a more pronounced positive impact and are more likely to synergize with FDI spillover effects in cities where environmental law enforcement is stricter. One possible explanation could be that such cities have stricter pollution emission standards and monitoring systems, creating an environment where enterprises can effectively implement clean production practices rather than merely fulfilling formalities. Additionally, there may be greater collaboration between clean production enterprises and clean FDI, generating stronger synergistic effects. These results highlight the significant positive impact when stringent end-of-pipe regulations complement front-end environmental regulations.
Heterogeneity of Industry Pollution Intensity
Industries with higher pollution intensity face greater pressure from environmental regulation policies (Färe et al., 2024). Consequently, these industries may be more motivated to enhance their position in the GGVC. Therefore, the impact of cleaner production audit policies may vary across industries with different pollution intensities.
This study employs the following methodologies to calculate the pollution emission intensity of each industry: firstly, calculating the pollution emissions per unit output value of pollutants in each two-digit sector; secondly, standardizing the pollution emission value of each industrial pollutant per unit output value; thirdly, obtaining the pollution emission intensity value of each industry through an equal-weighted average of various pollution emission scores, with SO2 and COD selected as key pollutants for determination. Based on the calculated pollution emission intensity values, industries falling within the highest 1/3 are classified as the high-pollution industry group, those within the lowest 1/3 are categorized as the low-pollution industry group, but others belong to the medium-pollution intensity group.
The results reported in Table 7 reveal that the cleaner production audit policy has a significantly negative impact on the firms’ GGVC position for industries with high pollution intensity. However, no significant effect is observed in industries with low pollution intensity, while a promotion effect is only evident in industries with medium pollution intensity. This discrepancy may be attributed to the fact that, in high-pollution intensity industries, the cost compliance effect resulting from cleaner production outweighs both the innovation compensation effect and optimal resource allocation among products, thereby hindering firms’ GGVC position. Conversely, low-pollution intensity industries experience relatively less pressure and exhibit minimal innovation pressure from front-end environmental governance and motivation for optimal resource allocation among products; hence no significant impact on firms’ GGVC position is observed. Furthermore, synergistic effects between cleaner production and foreign enterprise horizontal spillover are insignificant in high-pollution intensity industries. In contrast, only a small coefficient of positive synergistic effects exists between cleaner production and joint-venture horizontal spillover within low-pollution intensity industries; cleaner production and foreign enterprise horizontal spillover demonstrate significant positive synergistic effects within medium pollution-intensity industry groups. The primary reason behind this phenomenon lies in greater environmental pressures faced by cleaner production enterprises operating within medium pollution-intensity industry groups compared to their counterparts operating within low pollution-intensity groups.
Heterogeneity Test (2).

Note. The numbers in parentheses are t-statistics.
, **, and *** indicate significance at the level of 10%, 5%, and 1%, respectively.
Heterogeneity of Firm Financing Constraints
Enterprises require financial support to facilitate cleaner production and absorb FDI spillovers. Following the approach of literature (Ou & Wei, 2016), this study employs the proportion of net accounts receivable in total assets as a proxy variable for measuring financial constraints. Yang (2012) posited that accounts receivable reflect commercial credit generated through product credit in enterprise accounting records. In this paper, firms falling within the top third percentile of financial constraints are categorized as the high financial constraint group, while the remaining enterprises constitute the low financial constraint group.
It is evident from the results presented in Table 8 that within the high financial constraints group, the coefficient of CP × T exhibits a significantly negative effect, indicating that cleaner production inhibits the enhancement of firms’ GGVC position. Furthermore, the FDI spillover effect is not significant, and neither are the interaction terms between cleaner production and FDI spillover found to be significant. However, cleaner production promotes firms’ GGVC position in the low financing constraints group. The spillover index of JVs and its interaction term with cleaner production exhibit positive and statistically significant effects at a significance level of 1%. It can primarily be attributed to two factors: firstly, from a perspective of cleaner production, its implementation requires substantial funding support for mechanisms such as innovation compensation and optimal resource allocation among products. Within the low financing constraints group, these mechanisms can be better utilized due to access to funds more easily. Therefore, it enhances resource allocation efficiency among products to some extent. Secondly, financing constraints impede local firms’ absorptive capacity toward FDI spillovers. Absorptive capacity is a prerequisite for positive externalities resulting from FDI; however, financing constraints distort technology adoption and misallocate factor inputs.
Heterogeneity Test (3).

Note. The numbers in parentheses are t-statistics.
, **, and *** indicate significance at the level of 10%, 5%, and 1%, respectively.
Specifically, higher financing constraints distort the benefits derived from the adoption of foreign technology. The implementation of a novel process or technology always necessitates an upfront fixed cost payment, which can be attributed to investments in learning, renting, or acquiring technology patents and licenses. The economic viability of technology adoption relies on the ability of cost savings resulting from the new technology to offset these initial investment costs. Given that firms may need to borrow funds for such upfront expenses, it is natural for companies facing greater financing constraints to experience elevated initial costs. Consequently, financially constrained firms may find it economically unfeasible to adopt foreign technologies. Furthermore, even if they do adopt these technologies, their efficiency gains are likely to lag behind those achieved by their counterparts with lower financing constraints.
Heterogeneity of Enterprise Ownership
The unique ownership structure of state-owned enterprises (SOEs) dictates that their business objectives, and expanding operating profits, emphasize fulfilling political responsibilities such as maintaining social stability, and public interests. Consequently, SOEs are likely to exhibit higher levels of environmental compliance under clean production audits. Furthermore, SOEs have greater access to financial support from institutions, enabling them to overcome the cost constraints imposed by environmental regulations and more readily obtain green innovation funds to promote eco-friendly innovations. In contrast, non-state-owned enterprises (NSOEs), particularly private enterprises, primarily focus on profit maximization. When faced with clean production audits, these firms, driven by profit motives, may adopt flexible measures to circumvent environmental penalties. The results in Table 8 demonstrate that the clean production audit policy has a greater impact on SOEs than on NSOEs. Additionally, the synergistic effect between clean production audits and horizontal spillover from JVs is only significant for SOEs.
Heterogeneity of Enterprise Scale
When implementing the policy of clean production audits, enterprises must bear the compliance costs related to environmental regulations, such as those for machinery, personnel, and production raw materials. Large-scale enterprises can share these compliance costs through workshop sharing, and the average production cost increase for larger enterprises is smaller. Moreover, large-scale enterprises have relatively complete financial management mechanisms and better collateral guarantee capabilities, which facilitate them to obtain loans from financial institutions, broaden financing channels, and enhance the ability to disperse innovation risks. Based on the average enterprise size as the benchmark, the overall sample is divided into large-scale and small-scale enterprises. The results are reported in Table 9 in columns (1) and (2). The study finds that the coefficient of CP × T in the sample of large-scale enterprises is significantly positive, while that in the sample of small-scale enterprises is not. This indicates that the clean production audit policy may be more beneficial for the GGVC position of larger enterprises.
Heterogeneity Test (4).

Note. The numbers in parentheses are t-statistics.
, **, and *** indicate significance at the level of 10%, 5%, and 1%, respectively.
Heterogeneity of Enterprise TFP
To a certain extent, enterprise TFP reflects innovation capabilities and management quality. In developing countries, the level of TFP influences both the absorption of FDI spillovers (Ahmed & Kialashaki, 2023) and firms’ responses to environmental regulations. Based on the average TFP value, we divide the overall sample into high-TFP and low-TFP enterprises. The results are reported in columns (3) and (4) of Table 9. Our analysis reveals that the coefficient size and significance of CP × T in the high-TFP group are notably stronger than those in the low-TFP group. It suggests that the clean production audit policy may be more effective in enhancing the green global value chain position for high-TFP enterprises. One possible explanation is that low-TFP firms typically have higher pollution levels, leading to greater cost pressures from clean production audits, with some firms even exiting the market as a result. Moreover, the spillover effect of JVs and their synergy with clean production audits are only significant in the high-TFP group. It indicates that only high-TFP firms can effectively absorb the spillover effects of JVs, thereby forming a significant synergistic effect.
Further Research
In order to enhance our comprehension of the factors contributing to the diverse impacts of heterogeneous FDI spillovers on firms’ GGVC position, this study conducts a decomposition analysis of FDI horizontal spillovers. Existing literature suggests that FDI horizontal spillover can be broadly classified into competition effect, demonstration effect, and talent flow effect. Expanding upon the approach (Han & Wu, 2020), this paper incorporates JVs or WFOEs into the Herfindahl index to disentangle the heterogeneous FDI competition effect from horizontal spillover.


HHIJV and HHIWFO represent the competitive effects introduced by JVs and WFOEs, respectively.


Where labJV and labWFO represent the talent flow effect of JVs and WFOEs, respectively; and
Synergistic Effect Test of Cleaner Production and Decomposition Terms of FDI Horizontal Spillover.

Note. The numbers in parentheses are t-statistics.
, **, and *** indicate significance at the level of 10%, 5%, and 1%, respectively.
Regarding the talent flow effect, JVs exhibit a significantly positive spillover effect, whereas WFOEs do not show significant effects. This disparity can be attributed to JVs being more likely to generate positive spillover effects through talent flow in the host country, but WFOEs tend to impose strict restrictions on talent flow to maintain their competitive advantage. Conversely, this may attract highly skilled employees from local enterprises and result in an insignificant turnover effect for foreign-owned enterprises. The coefficients of the interaction terms between cleaner production and JV competition and talent flow effect are significantly positive at 0.034 and 0.059, respectively. These findings indicate that the cleaner production audit policies have a notable synergistic impact on both competition effects and talent flow effect of JVs. However, there is no significant relationship observed between the interaction terms involving WFOEs competition or talent flow effect, which further supports our previous analysis.
Discussion, Conclusions, and Policy Implications
Discussion
Currently, green trade has emerged as the predominant paradigm in international commerce, and enhancing the position of enterprises’ within the GGVC is crucial for achieving high-quality economic development. However, existing literature lacks comprehensive research on GGVCs and their influencing factors (Kano et al., 2020). This study integrates environmental regulations and FDI spillovers into a unified analytical framework to examine the synergistic effects of clean production audits and FDI spillovers on enterprises’ positions within the GGVC. Firstly, this study addresses a gap in the literature by incorporating environmental sustainability into the analysis of enterprises’ global value chain positions (Najarzadeh et al., 2021; Siewers et al., 2024), thereby extending the scope of research on front-end environmental regulations (Siewers et al., 2024). Secondly, it explores the interaction between clean production practices and heterogeneous FDI spillovers, enriching the literature on the collaborative effects of environmental regulations and FDI (Feng et al., 2019; Tan & Uprasen, 2022). Overall, this study offers valuable insights for developing countries aiming to harmonize environmental benefits with the technological spillover effects of FDI.
This study demonstrates that clean production positively influences the enterprises’ GGVC positions, thereby supporting the strong version of Porter’s hypothesis (Benatti et al., 2024; Sun et al., 2024), which posits that appropriate environmental regulations can enhance competitiveness. The significant improvement in enterprises’ GGVC positions due to the synergy between clean production audit policies and the spillover effects from JVs aligns with research on achieving a win-win scenario between Porter’s hypothesis and pollution havens (Ranocchia & Lambertini, 2021). However, this study finds that the synergy effect is only significant for JVs, not WFOEs. Although the performance of JVs and WFOEs is often not significantly different (Foster-McGregor et al., 2015), due to their higher control over technology, WFOEs tend to exert a “talent poaching” effect and a “resource competition effect” (Weche, 2018) on domestic enterprises in the host country. It can result in certain negative spillover effects on domestic enterprises, amplifying the cost compliance burden associated with clean production and thereby offsetting the innovation compensation effect as well as the resource allocation optimization effect among clean production products. This finding regarding WFOEs aligns with the literature, which suggests that the spillover effects of joint ventures are more positive than those of wholly foreign-owned enterprises in developing countries (Q. Liu et al., 2020). These insights have significant implications for maximizing the benefits of foreign investment during the process of attracting foreign capital in developing countries. Additionally, the study reveals that the synergy effect of clean production audits and FDI spillovers varies across regions, cities with differing levels of environmental enforcement, industries with varying pollution intensities, enterprises facing different financing constraints, ownership structures, scales, and TFP. These findings offer valuable policy insights for developing countries seeking to leverage FDI spillovers while strengthening environmental regulations.
Limitations and Future Research
While this paper offers significant theoretical and practical insights, it is not without limitations. The primary limitations are as follows: First, the data used in this study were sourced from the Chinese Industrial Enterprise Database. Due to data availability constraints, specific enterprise characteristics such as innovation capabilities and management practices were not included in the analysis. This omission may have influenced the model’s estimation results. Future research will incorporate data from listed companies, enabling a more comprehensive examination of enterprise characteristics at the firm level. Second, due to data availability limitations, our study is confined to data from Chinese enterprises that have undergone clean production audits. We were unable to access comparable data from enterprises in other countries. This limitation may restrict the generalizability and applicability of our conclusions and policy recommendations, particularly for developed countries. Future research will aim to gather and analyze clean production audit data from enterprises in other countries, enabling a comparative analysis with Chinese enterprises, to enhance the universality, and robustness of our findings.
Conclusions
This study leverages the unique dataset of enterprises that underwent clean production audits in the first five batches published by China’s Ministry of Ecology and Environment. Using a PSM-DID model, we investigate the impact of the synergy between the clean production audit policy and FDI spillovers on firms’ positions in the GGVC. Our findings indicate that the clean production audit policy exerts a significant positive influence on firms’ GGVC positions. Specifically, the synergy between JVs and clean production audits significantly enhances firms’ GGVC positions, whereas no suis observed for WFOEs. The synergistic effects are particularly pronounced for firms in eastern regions, cities with stringent environmental enforcement, those facing low financing constraints, industries with medium pollution intensity, state-owned enterprises, large-scale firms, and firms with high total factor productivity (TFP). Further analysis reveals that the clean production audit policy exhibits significant synergies with both the competitive and personnel flow effects of JVs.
Policy Implications
First, a cleaner production audit, as an important front-end environmental governance tool, can be promoted according to the actual situation, especially for the eastern region and pollution-intensive industries, should increase the implementation of cleaner production efforts, and expand the coverage. It can not only play a direct role in cleaner production but also facilitate the formation of a synergistic effect with FDI spillover, thus boosting the position of enterprises in the green global value chain. At the same time, it is necessary to strengthen the enforcement of local environmental regulations and increase the cost of environmental violations.
Second, a one-size-fits-all clean production standard is inappropriate. It is essential to further refine these standards and formulate differentiated clean production standards for enterprises of varying scales, ownership structures, and productivity levels. Special emphasis should be placed on guiding enterprises in the central and western regions, NSOEs, small enterprises, and low-productivity enterprises. Local governments can alleviate the cost pressures faced by these enterprises through targeted R&D policy incentives and environmental protection subsidies, thereby encouraging them to engage in green technological innovation activities and promote the greening of products.
Third, the government should focus on the quality of foreign investment and avoid introducing polluting foreign enterprises. It should encourage the establishment of JVs and promote cooperation between local enterprises and these JVs, particularly enhancing interactions between clean production enterprises and JVs to foster spillover synergies. Simultaneously, attention must be paid to the “crowding-out effect” of highly competitive WFOEs on the market and their “competition effect” on domestic high-quality production factors, especially talent.
Fourth, the government and the financial sector should enhance financial support for enterprises adopting cleaner production practices, particularly for smaller enterprises or those in industries with high compliance costs. This support should aim to assist these enterprises in diversifying their financing channels and alleviating their financing constraints. To facilitate this transition, it is crucial to provide enterprises with a grace period and technical assistance alongside cleaner production initiatives. Targeted subsidies should be allocated for research and development (R&D) innovation aligned with industrial upgrading objectives, thereby mitigating the potential negative impacts of environmental policies during the initial adjustment phase. This approach will not only bolster enterprises’ positions in the green global value chain through direct channels but also leverage synergies from FDI spillovers via indirect channels.
Footnotes
Ethical Considerations
This article does not contain any studies with human or animal participants.
Author Contributions
Conceptualization, Xiangmin He, Jianhua Zhou; Methodology, Xiangmin He; Formal analysis, Xiangmin He, Jianhua Zhou; Investigation, Xiangmin He, Jianhua Zhou; writing—original draft preparation, Xiangmin He, Jianhua Zhou. All authors have read and agreed to the published version of the manuscript.
Funding
The author(s) disclosed receipt of the following financial support for the research, authorship, and/or publication of this article: Funding for this project was provided by The National Social Science Fund of China (20BJL033).
Declaration of Conflicting Interests
The author(s) declared no potential conflicts of interest with respect to the research, authorship, and/or publication of this article.
Data Availability Statement
The data are available from the corresponding author on reasonable request.