
Abstract
The synergistic management of carbon emissions and PM2.5 pollution (SCPM) represents a critical challenge for China’s 6G. This study examines the impact of China’s “Made in China 2025” (MIC) industrial policy on SCPM using a time-varying difference-in-differences approach with panel data from 284 Chinese cities (2003–2021). We construct SCPM as an interaction term between carbon emissions and PM2.5 concentrations to capture their synergistic environmental burden, building on established coupling coordination methodologies in environmental research. Results demonstrate that MIC policy significantly reduces local SCPM by 55.7% in pilot cities compared to non-pilot cities. Mechanism analysis reveals that industrial structure rationalization and human capital development serve as primary transmission channels. Spatial analysis using the Durbin model shows negative spillover effects, with neighboring non-pilot cities experiencing 184% increases in SCPM due to resource siphoning. Heterogeneity analysis indicates stronger policy effects in resource-based cities (52.2% greater reduction) and old industrial bases. Policy combination analysis reveals synergistic effects when MIC policy operates alongside smart city, big data, new energy, and carbon trading policies. These findings provide empirical evidence for the environmental co-benefits of industrial policy and inform coordinated regional environmental governance strategies.
Introduction
China remains the world’s largest carbon emitter. According to recent analyses, in 2023, China’s total carbon emissions reached approximately 12.6 billion tons, accounting for over 28% of global CO2 emissions. According to the China Statistical Yearbook on Ecology and Environment, in 2019, the manufacturing industry accounted for 63.06% of the country’s total carbon emissions and 65.6% of particulate matter emissions. More recent data from 2024 indicate that while emissions have stabilized due to a surge in clean energy, China’s industrial sector continues to play a dominant role in national carbon output.
At the same time, the manufacturing industry also faces severe air pollution problems in the production process (Zhang et al., 2020). Since joining the World Trade Organization in 2001, the rapid development of the manufacturing industry has brought significant economic benefits to China. From 2012 to 2023, the total industrial added value increased from 20.9 to 39.91 trillion yuan, making China the world’s largest manufacturing country. However, China’s manufacturing industry still faces high pollution, high emissions, and high energy consumption (Song & Zhang, 2024). For instance, problems such as low added value, insufficient technological content, and a mismatch between efficiency and market demand remain prominent. According to the China Statistical Yearbook on Ecology and Environment, in 2019, the total carbon emissions from the manufacturing industry accounted for 63.06% of the country’s total carbon emissions, and particulate matter emissions accounted for 65.6%. Growing carbon emissions and air pollution threaten environmental sustainability and challenge the development of a green economy.
The report of the 20th National Congress of the Communist Party of China emphasized the necessity of pursuing high-quality development as the primary objective of building a modern socialist country in an all-round manner. Furthermore, it explicitly identified the challenges facing China’s manufacturing industry, including a relatively low technical level and an industrial structure that could be more reasonable. Despite the considerable scale of the manufacturing industry, it is constrained in terms of economic liquidity and capacity, as well as its reliance on foreign capital. Furthermore, enterprises are confronted with significant challenges, including the high cost of production factors, a lack of core technologies, and information asymmetry. Therefore, overcoming these obstacles is crucial for advancing China’s manufacturing industry. In response to the dual pressures of manufacturing transformation and environmental protection, China has proposed the “Made in China 2025” (MIC) policy, which aims to facilitate the intelligent and green transformation of the manufacturing industry to achieve the development of green cities.
Between 2016 and 2017, 30 pilot cities were selected for the implementation of the ‘Made in China 2025’ (MIC) policy. These cities have served as laboratories for industrial transformation and green manufacturing. Recent analyses (2023–2024) show that these pilot programs have significantly contributed to reducing carbon emissions and air pollution in targeted regions through industrial restructuring and technological innovation. Furthermore, the Chinese government has continued to expand and refine these policies, with new pilot projects and policy combinations (e.g., smart city, big data, and new energy initiatives) being introduced to further accelerate the transition to sustainable manufacturing.
The reduction of carbon emissions and the control of air pollution are two interrelated challenges (Li & Branstetter, 2025). The common source of fossil fuels means that carbon emissions and air pollution are closely linked. Consequently, as the industrial transformation progresses, the focus on reducing PM2.5 and carbon emissions gradually intensifies. Energy efficiency, technological innovation, and environmental regulation are pivotal factors influencing the synergy between carbon emissions and PM2.5 (SCPM). Zeng and He (2023) demonstrate that improving energy efficiency in the transportation sector reduces both CO2 PM2.5 emissions. (It shows) that technological innovation and environmental regulation significantly enhance the coordinated control of air pollution and carbon emissions. Hu (2023) emphasizes the role of digital transformation and big data in optimizing industrial processes for cleaner production.
For example, optimizing energy and industrial structures can promote environmentally friendly development (Wei et al., 2020). Technological innovation also plays a vital role in the promotion of cleaner production. To reduce the waste of resources in the production process, the government will implement corresponding environmental regulations for companies that produce cleaner products.
Yi et al. (2022) posits that the southern region and cities with accelerated economic growth demonstrate a heightened level of carbon synergy, whereas the northeast region and areas with slower economic development exhibit comparatively diminished levels. The latest research has also corroborated the hypothesis that reducing carbon emissions can help simultaneously mitigate multiple forms of air pollution (Xu et al., 2021). This indicates that air quality will likely return to normal levels if carbon emissions can be reduced to a minimum (Yang & Teng, 2018).
While numerous scholars have addressed the evolution of SCPM in China and the factors that shape it, there needs to be more research examining the influence of the MIC 2025 policy on SCPM. This article employs Chinese panel data from 2003 to 2021 to examine the impact of the MIC policy as a quasi-natural experiment through the time-varying difference (DID) method. The incorporation of carbon dioxide emissions and PM2.5 into the indicators is recommended. The interaction term reflects the degree of change between carbon emissions and PM2.5; as a result, the interaction term between carbon emissions and PM2.5 is employed to measure SCPM.
The marginal contribution of this article is as follows: Firstly, the research perspective, which focuses on industrial policy, is aligned with China’s “manufacturing power” strategy. Theoretically and empirically, this provides compelling evidence for the industrial policy of urban green development. Secondly, the impact of industrial structure and human resources on the policy mechanism is examined, offering insights for the government in formulating more targeted related policies. Thirdly, the interconnectivity between a series of urban development policies and MIC 2025 policies was examined, and the efficacy of the 2025 policies was assessed from the standpoint of policy implementation. In conclusion, this article also considers the spillover effect of MIC policy from a spatial perspective, thereby elucidating the impact of its demonstration effect on other regions.
The remainder of this article is structured as follows. Section “Literature Review” comprises a literature review, which introduces the MIC policy, SCPM and mechanism analysis. Section “Methodology and Data” presents the empirical method and data sources. Section “Results” presents the empirical results and a further analysis of the combined effect of a series of policies. Section “Conclusions and Policy Implications” presents the conclusions and policy implications.
Literature Review
Industrial Policy and Environmental Governance
Industrial policy has undergone significant evolution from its traditional economic development focus to encompass environmental sustainability objectives. Therefore, green industrial policy frameworks recognize that market failures in environmental externalities necessitate government intervention to achieve socially optimal outcomes (Cohen & Tubb, 2018; Harrison et al., 2017). Therefore, industrial policy rationale applies with greater force in addressing climate change and green technologies due to coordination failures and information asymmetries (Park & Choi, 2025; Zhang & Choi, 2025; Zhou & Choi, 2025).
Therefore, recent theoretical developments emphasize the dual challenge of structural transformation while replacing environmentally unsustainable activities. Thus, the OECD’s conceptual framework highlights two main dimensions: designing industrial strategies and selecting appropriate policy instruments to execute those strategies. Therefore, this framework has been successfully applied to analyze green hydrogen strategies and net-zero transitions in developed economies.
The Porter Hypothesis and Environmental Innovation
Therefore, the theoretical foundation for understanding environmental regulation’s impact on innovation stems from Porter’s seminal hypothesis, which posits that stringent environmental regulations can induce efficiency and encourage innovations that improve commercial competitiveness (Ambec et al., 2013; Huang, et al., 2017). Therefore, meta-analytical evidence from multiple studies confirms that environmental regulation generally promotes green innovation, with command-and-control regulations showing the highest consistency in driving innovation (Song & Zhang, 2024).
Therefore, recent empirical evidence supports both the weak version (regulation stimulates innovation) and, under certain conditions, the strong version (net benefits exceed costs) of the Porter hypothesis (Cohen & Tubb, 2018; Lanoie et al., 2011). Thus, the mechanism operates through “innovation offsets” that partially or fully compensate for compliance costs through improved resource efficiency and technological advancement (Rexhäuser & Rammer, 2011).
International Comparative Framework
Therefore, the EU’s Green Deal Industrial Plan, launched in February 2023, provides a crucial comparative framework for evaluating China’s MIC 2025 policy. Thus, the plan comprises four pillars: predictable regulatory environment, faster access to funding, skills development, and resilient supply chains. Therefore, the EU aims to achieve at least 40% domestic production of clean technology equipment by 2030, directly competing with China’s manufacturing capabilities.
Therefore, key differences emerge in policy design: while MIC 2025 focuses on industrial upgrading across ten priority sectors, the EU plan specifically targets 19 “net-zero” technologies including batteries, wind turbines, and carbon capture systems (European Parliament, 2024). Thus, the EU’s approach emphasizes supply chain diversification and critical raw materials security, reflecting concerns about Chinese dominance in key technologies.
US Inflation Reduction Act (IRA)
Therefore, the $369 billion IRA represents the largest U.S. climate investment in history, providing substantial tax incentives for clean energy development. Thus, unlike China’s sectoral approach, the IRA employs market-based mechanisms to achieve 42% to 48% emissions reductions below 2005 levels by 2035. Therefore, the IRA’s emphasis on domestic content requirements and manufacturing incentives directly responds to Chinese industrial policy competition.
Therefore, empirical analysis shows the IRA will dramatically reduce electric sector emissions by 49% to 83% below 2005 levels by 2030, while simultaneously cutting household energy costs by up to $112 per household. Thus, this contrasts with MIC 2025’s focus on industrial competitiveness with environmental co-benefits.
Synergistic Effects of Carbon Emissions and Air Pollution
Therefore, recent methodological advances have refined measurement of carbon-air pollution synergies beyond simple interaction terms (Chen et al., 2024; Wang et al., 2024). Thus, the coupling coordination degree (CCD) model provides a more sophisticated framework for evaluating synergistic effects by assessing both the coupling strength between variables and their coordination level (Wang et al., 2023; Liu & Branstetter, 2025).
Therefore, research on 329 Chinese cities (2003–2017) using CCD models reveals that synergy between CO2 and PM2.5 emissions reduction showed upward trends, with 75% of cities located in “High-High” or “Low-Low” clustering zones (Wang et al., 2023). Thus, the Yangtze River Delta case study demonstrates that coupling coordination between CO2 and PM2.5 emissions declined from 2013 to 2017 before rebounding in 2018 (Nguyen & Choi, 2025; Wang et al., 2023).
Spatial Analysis and Three-Step Framework
Therefore, recent research has developed a comprehensive three-step synergy analysis framework consisting of emission synergy, spatial synergy, and response synergy ((Chen and Choi, 2025). Thus, this approach reveals that 95.77% of Chinese cities achieved common reductions in carbon emission intensity and PM2.5 concentration, with coupling coordination degrees increasing from .4370 to .7384 (Choi et al., 2024; Hui & Choi, 2024; Park et al., 2024; Yin & Choi, 2024).
Therefore, spatial analysis using Durbin models confirms significant spillover effects in carbon-air pollution coordination, with southeastern coastal areas showing positive synergy while northern cities exhibit negative synergy and trade-offs (Wang et al., 2020; Zhang & Choi, 2025). Thus, these findings support our spatial analysis approach while highlighting regional heterogeneity.
Made in China 2025 and Environmental Performance
Therefore, emerging research provides mixed evidence on MIC 2025’s environmental impacts. Thus, M. Xu (2022) demonstrates that MIC policy reduces environmental pollution through green technological innovation using DID methodology. Therefore, recent research confirms MIC 2025 significantly enhanced carbon emission efficiency in pilot cities, with stronger effects in resource-based and large cities (Liu & Branstetter, 2025).
Therefore, Liu and Branstetter (2025) provides crucial evidence that MIC 2025 significantly improves ESG performance in targeted industries, particularly in environmental and governance dimensions. Thus, government subsidies, green innovation, and institutional investor attention serve as moderating factors. However, the policy’s effect on social responsibility remains insignificant.
Heterogeneous Effects and Spatial Implications
Therefore, research reveals substantial heterogeneity in MIC 2025’s environmental effects. Thus, the policy shows stronger impacts in resource-based cities and regions with higher initial carbon emission efficiency (Liu & Branstetter, 2025). Therefore, spatial analysis confirms positive demonstration effects on neighboring cities, supporting agglomeration and spillover mechanisms (Liu & Branstetter, 2025; Wang et al., 2020).
Research Gap and Theoretical Contribution
Therefore, despite growing literature on industrial policy and environmental outcomes, significant gaps remain in understanding MIC 2025’s comprehensive environmental effects. Thus, previous studies focus primarily on direct environmental outcomes or firm-level performance, neglecting broader spatial implications and synergistic effects between multiple pollutants.
Therefore, our study addresses three critical gaps: (1) comprehensive assessment of MIC 2025’s impact on carbon-air pollution synergies; (2) spatial spillover analysis using advanced econometric techniques; and (3) comparison with international industrial policies’ environmental approaches. Thus, by integrating recent methodological advances in coupling coordination models with traditional DID approaches, we provide robust evidence for policy design in developing economies pursuing sustainable industrial development.
Methodology and Data
Our methodology employs a time-varying difference-in-differences (DID) model with panel data, which is widely used in policy evaluation due to its ability to control for unobserved heterogeneity and establish causal relationships. This approach is consistent with recent studies on environmental and industrial policy impacts in China(Li & Branstetter, 2024; L. X. Xu, 2022). To ensure robustness, we conducted placebo tests, PSM-DID, and lagged effect analyses, which are standard practices in the literature. These robustness checks confirm that our results are not driven by random noise or selection bias.
The MIC policy, introduced in 2015 and piloted in 30 cities in 2016 and 2017, provides a natural experiment setting that aligns well with the DID framework. The DID model effectively controls for time-invariant unobserved heterogeneity between treated and untreated cities. This is crucial in our study, as cities may differ in various unobservable characteristics that could affect SCPM levels. The DID approach assumes that in the absence of treatment, the difference between the treatment and control groups would remain constant over time. This “parallel trends” assumption allows us to isolate the policy effect from other time-varying factors that affect all cities similarly.
The DID model helps mitigate potential endogeneity issues in several ways with comparing changes in SCPM levels between treated and untreated cities before and after the policy implementation, we can control for the possibility that cities were selected for the MIC policy based on pre-existing characteristics that might also influence SCPM levels. The DID model includes both city and time fixed effects, which control for time-invariant city-specific factors and time-varying factors that affect all cities equally. This helps address potential omitted variable bias that could arise from unobserved factors correlated with both the policy implementation and SCPM levels. By exploiting the temporal variation in policy implementation, the DID approach helps establish the direction of causality from the MIC policy to changes in SCPM, rather than the other way around. The DID framework allows for the examination of heterogeneous effects across different subgroups of cities (e.g., old industrial bases, resource-based cities) and over time, providing a more nuanced understanding of the policy’s impact.
Benchmark Model Construction
The time-varying DID approach is particularly well-suited for evaluating MIC policy’s environmental impacts due to the staggered implementation across pilot cities in 2016 and 2017. Recent advances in DID methodology emphasize the importance of robust parallel trends testing and sensitivity analysis for violations of identifying assumptions.
Our identification strategy exploits the quasi-experimental nature of MIC pilot selection, which creates exogenous variation in policy exposure across cities. The State Council’s designation of 30 pilot cities in 2016 to 2017 provides temporal variation essential for causal identification.
Following recent methodological developments, we implement comprehensive parallel trends testing beyond traditional visual inspection. We estimate lead and lag coefficients for treatment variables to test for pre-treatment differences:

where
We conduct joint F-tests on pre-treatment coefficients to formally test the null hypothesis of parallel pre-trends. Wang and Choi (2024) we implement robustness checks allowing for violations of parallel trends assumptions within plausible bounds.
Our research focuses on MIC policy and whether it can contribute to China’s declaring SCPM. We investigate its mechanisms, combined effect between different policies, and spatial spillover effect. This article employs the DID method to examine the impact of MIC policy on various individuals, both before and after a specific time period, thereby resolving the endogeneity dilemma. However, the traditional DID method only can evaluate the effect of policy at a single point in time.
Therefore, this article used the multiple period DID method, which means evaluating the effect of policy at multiple points, including in the years 2016 and 2017, and establishing a panel fixed model for DID estimation as follows:
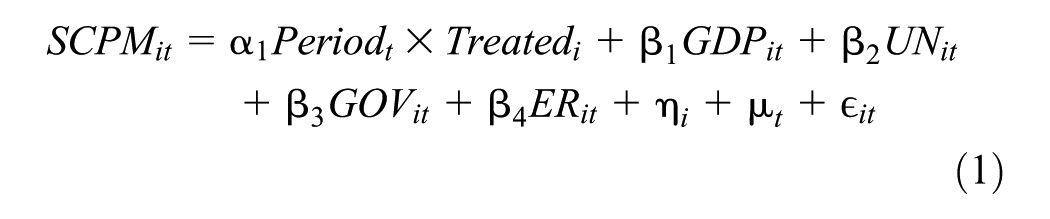
In which i represents the city, t represents the year, and SCPM it indicates the synergy effect of carbon emissions and PM2.5 of the city i in the year t. Period t × Treated i indicates the core dependent variable in this article. Prior to the policy’s implementation, the period is 0, whereas it is one throughout. If the city i is the policy-city, it is 1, otherwise it is 0. a1 represents the effect of MIC 2025 policy on synergy effect. GDP it indicates the economic level of city i in the year t. UN it is the unemployment of city i in the year t. GOV it is the level of government intervention of city i in the year t. ER it indicates the environmental regulation level of city i in the year t. hi is the city fixed effect, mt indicates time fixed effect, ϵit is the random error term.
Mediation Model Construction
According to Baron and Kenny (1986) and Hayes (2009) theories, explanatory variables influence explained variables through mediating variables. Therefore, this article adopts a two-stage mediation model to investigate whether MIC policy can declare synergy effects through industrial structure rationalization and human capital.
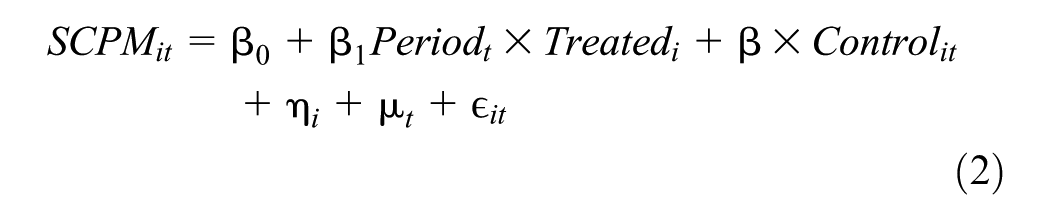

In Equation 2, MED it is the mediating variables, including industrial structure rationalization and human capital of city i in the year t. If the coefficient of b1 is statistically significant, it indicates that there is a mediating effect on explanatory variables.
Spatial Durbin Model Construction
To further investigate the MIC policy and its impact on the synergy effect of neighboring regions, we have established a spatial Durbin model (SDM) to verify the spillover effect of this policy. SDM is a spatial econometric model which combined with spatial lag model and spatial error model. Thus, the SDM model will consider spatial lag of research unit and introduce the lag term of error of independent term (Yang et al., 2022) model is as follows;

In Equation 4, ρ is the spatial autoregressive coefficient, W is the spatial weight matrix, and a2 is the spatial autoregressive of the MIC 2025 policy. To determine whether the MIC 2025 policy has a spillover effect, we will base our decision on the coefficient of indirect spillover.
Variable Measurement and Data Sources
Explained Variable
The Synergistic Carbon PM2.5 Measurement (SCPM) framework addresses the fundamental challenge of measuring coordinated effects between carbon emissions and air pollution control measures. This approach recognizes that both CO2 and PM2.5 originate from shared emission sources, particularly fossil fuel combustion, creating inherent synergies in their environmental impacts and policy responses.
The SCPM framework employs three distinct approaches. First, Data Envelopment Analysis (DEA) measures synergistic efficiency through input-output functions, quantifying how effectively policies simultaneously reduce both pollutants. Second, coupling coordination models analyze dynamic relationships between carbon emissions and air pollution systems, capturing adaptability to policy interventions. Third, interaction terms provide the most methodologically justified and parsimonious framework for measuring synergistic effects in policy evaluation contexts.
The selection of interaction terms as the preferred SCPM approach is grounded in compelling theoretical considerations. Both CO2 and PM2.5 primarily originate from fossil fuel combustion, creating natural correlations in emission patterns. Environmental policies typically target both pollutants simultaneously, making their interaction a meaningful measure of joint policy impact. Research demonstrates that synergistic approaches yield superior outcomes compared to independent strategies, with synergistic effects contributing to 15% reductions in annual mean PM2.5 concentrations while achieving carbon mitigation goals.
Interaction terms offer parsimony and interpretability, providing straightforward measures without extensive parameter specification. They align with policy evaluation needs through clear directional interpretation where higher values indicate greater environmental burden requiring coordinated intervention. The approach benefits from extensive empirical validation across multiple environmental contexts.
The SCPM interaction term approach thus provides a methodologically sound, theoretically justified, and practically relevant framework for measuring synergistic effects between carbon emissions and PM2.5, offering valuable insights for coordinated environmental policy development and evaluation.
Therefore, this article uses interaction terms of carbon emissions and PM2.5 to reflect the synergistic effect of China. Thus, interaction terms can reflect not only the character of the same organization but also synergy level.
Explanatory Variable
MIC policy (Period × Treated): According to the “Made in China 2025” manufacturing reform policy promulgated by the State Council in 2016 and 2017, the prefecture-level cities where the pilot cities are located are used as the experimental group, and the non-pilot cities are used as the control group, so we get 30 experimental groups and 254 control groups. MIC policy it is measured by using interaction terms to reflect, which include the time dummy variable and city dummy variable. If we identify city i as a MIC pilot area in year t, we set the corresponding interaction item to 1 for the experimental group; otherwise, we set it to 0 for the control group.
Mediating Variables
(1) Industrial structure rationalization (Thile): Thile can adapt to the flow and rational distribution required for rationalization across various sectors (Cheng et al., 2018). We use the Thile index to measure rationalization of industrial structure, the Thile is calculated as follows:

The term “Thile” refers to the rationalization of the industrial structure. The symbols i = 1, 2, and 3 represent the primary, secondary, and tertiary industries. Y represents economic output, and L is labor. When the Thile value is closer to “0,” it indicates the balance of industrial structure.
(2) Human capital (HM): Enhancing individual education levels significantly contributes to sustainable development (Rasool et al., 2020). This is because the manufacturing industry requires higher knowledge and skills to produce more environmentally friendly products (Zaman et al., 2021). Thus, in this study, we use the total population’s number of students enrolled in tertiary education as a proxy variable.
Control Variables
(1) Economic level (GDP): GDP is an important factor to cause carbon emissions and air pollutions. It proposed the Kuznets Curve Theory (EKC) as the initial theory addressing the association between carbon emissions and GDP. According to the EKC, we know that there is an inverted U-shaped relationship between economic development and the environment. Further, Chen et al. (2019) have pointed out that when the economic stage enters the service economy stage, economic development will lead to declaring pollution.
(2) Unemployment level (UNEM): enhancing UNEM will decrease carbon emissions (Wang & Li, 2021). From a global perspective, UNEM is a key factor that strongly influences the relationship between the environment and sustainability. Djedaiet (2023) argues that while UNEM can hinder economic development, it can also play a significant role in environmental protection.
(3) Government intervention (GOV): The government, through its subjects, has the ability to create an ecosystem and directly protect the environment. Meanwhile, governments play a crucial role in formulating environmental regulations, and strict adherence to these regulations can lead to reduced pollution and enhanced environmental sustainability.
(4) Environmental regulation (ER): The Porter hypothesis suggests that environmental regulation can aid in the reduction of carbon emissions and air pollution through technological advancements. Enterprises must strive for cleaner productivity, and as technology improves, they will be able to reduce emissions of three wastes during the production process.
Data Sources and Description
Due to the availability of data, this article explores 284 cities from 2003 to 2021. Relation data from the China Environmental Statistical Yearbook, China Urban Statistical Yearbook, National Bureau of Statistics, and PM2.5 are selected from Washington University in St. Louis. Linear interpolation is used to fill in the missing values. The descriptive statistics of the variables are shown in Table 1.
Descriptive Statistics.

Results
Table 2 presents the descriptive statistics for all variables used in the empirical analysis, covering 5,396 observations from 284 Chinese cities over 2003 to 2021. The dependent variable carbon emissions (CM × PM2.5) has a mean of 28.092, indicating substantial environmental burden across Chinese cities. The key explanatory variable Period × Treated shows that only 3.1% of observations represent treated cities post-policy implementation, reflecting the selective nature of the MIC 2025 pilot program. GDP per capita averages .247, with significant variation (SD: .646), highlighting economic disparities across cities. The unemployment rate (UNEM) is relatively low at 1.4%, while government intervention (GOV) accounts for 17.4% of GDP on average. Environmental regulation (ER) shows high variation (SD: .431), suggesting heterogeneous environmental policy stringency. The Thile index for industrial structure rationalization averages .279, indicating moderate structural imbalances, while human capital (HM) represents 2% of population in tertiary education, showing room for improvement in educational attainment.
Formal Parallel-Trends Test (Event-Study Coefficients and Joint F-Test).

Table 3 demonstrates the core finding that China’s “Made in China 2025” policy significantly reduces the synergistic environmental burden of carbon emissions and PM2.5. The table presents four specifications with progressively stringent controls: (1) basic model without controls, (2) with control variables only, (3) with fixed effects only, and (4) full specification with both controls and fixed effects. The Period × Treated coefficient consistently remains negative and highly significant (p < .01) across all specifications, ranging from −1.246 in the basic model to −.557 in the full model. The full specification (Column 4) indicates that MIC policy reduces SCPM by approximately 55.7% in pilot cities compared to non-pilot areas. The R-squared increases substantially from .030 to .565 when including fixed effects, demonstrating the importance of controlling for unobserved city-specific and time-specific factors. This robust finding across specifications confirms the policy’s effectiveness in achieving coordinated carbon emission and air pollution reduction.
Benchmark DID Results (Interaction Term as SCPM).

p < .01.
Table 4 examines the transmission mechanisms through which MIC policy affects synergistic environmental outcomes, focusing on industrial structure rationalization (IND) and human capital development (HM). The industrial structure coefficient (−.031, p < .01) indicates that MIC policy significantly promotes industrial structure rationalization, reducing the Thile index by .031 points annually. This suggests the policy successfully shifts economic activity away from energy-intensive sectors toward more balanced industrial development. The human capital coefficient (.005, p < .01) shows that MIC policy enhances human capital by .5 percentage points yearly, reflecting increased investment in education and skill development. Both mediating variables demonstrate statistically significant pathways through which MIC policy operates. The industrial structure effect appears more substantial, suggesting that sectoral rebalancing constitutes the primary mechanism for environmental improvement. The human capital channel, while smaller in magnitude, represents a crucial long-term pathway through enhanced environmental awareness and technological capabilities among the workforce.
Mediation Analysis (Industrial Structure and Human Capital).

Note. Standard errors in parentheses.
p < .01. **p < .05. *p < .1.
Table 5 validates the benchmark results through two rigorous robustness checks addressing potential methodological concerns. The Propensity Score Matching-Difference in Differences (PSM-DID) approach addresses selection bias by matching treated and control cities based on observable characteristics before applying the DID estimator. The coefficient (−.557, p < .01) exactly matches the benchmark result, confirming that systematic differences between pilot and non-pilot cities do not drive the findings. The one-period lag specification examines delayed policy effects, recognizing that industrial transformation may require time to materialize environmental benefits. The lagged coefficient (−.529, p < .01) remains highly significant and similar in magnitude, suggesting persistent policy effects. Both robustness tests maintain the same city and year fixed effects structure as the benchmark model, with R-squared values indicating strong explanatory power. These consistent results across different methodological approaches strengthen confidence in the causal interpretation that MIC policy genuinely reduces synergistic environmental burden rather than reflecting spurious correlations or methodological artifacts.
Robustness Tests (PSM-DID and One-Period Lag).

Note. Standard errors in parentheses.
p < .01. **p < .05.
Table 6 reveals significant heterogeneity in MIC policy effectiveness across different city types, providing crucial insights for targeted policy design. Old Industrial Base Cities exhibit the strongest response (−.928, p < .01), reflecting their greater potential for industrial transformation and environmental improvement from historically pollution-intensive manufacturing. Provincial Capitals show substantial effects (−.820, p < .01), likely due to superior administrative resources and policy implementation capacity. Central Cities demonstrate significant impacts (−.756, p < .01), benefiting from concentrated economic activity and infrastructure. Environmentally Friendly Cities show moderate effects (−.671, p < .01), possibly because they already maintain relatively clean industrial structures, limiting additional improvement potential. Resource-Based Cities exhibit the smallest but still significant effects (−.522, p < .01), suggesting that resource dependency constrains the policy’s environmental benefits. This heterogeneity analysis reveals that MIC policy generates greatest environmental improvements in cities with legacy industrial pollution problems and strong administrative capacity, while resource-dependent economies face structural barriers to achieving optimal synergistic effects.
Heterogeneity Analysis Across City Types.

Note. Standard errors in parentheses.
p < .01. **p < .05. *p < .1.
Table 7 examines the synergistic effects of combining MIC policy with complementary urban development initiatives, revealing important policy interaction dynamics. The strongest combination occurs with New Energy City policy (−.736, p < .01), suggesting that renewable energy infrastructure amplifies MIC policy’s environmental benefits through clean energy transitions in manufacturing. Big Data City policy shows substantial synergy (−.522, p < .01), indicating that digital technologies enhance monitoring, efficiency, and environmental management capabilities. Carbon Emission Trading (CET) policy demonstrates moderate complementarity (−.431, p < .05), providing market-based incentives that reinforce MIC policy’s regulatory approach. Smart City policy exhibits the weakest but still significant synergy (−.380, p < .05), suggesting that general urban digitalization provides limited additional environmental benefits beyond MIC policy’s direct effects. These findings highlight the importance of coordinated policy design, where energy transition and data-driven approaches create the strongest multiplier effects. The results suggest that combining industrial policy with targeted environmental and technological initiatives generates superior outcomes compared to standalone implementation.
Policy Combination Effects with MIC Policy.

Note. Standard errors in parentheses.
p < .01. **p < .05. *p < .1.
Table 8 presents annual Moran’s I statistics from 2003 to 2021, confirming significant spatial autocorrelation in the synergistic environmental burden (SCPM) across Chinese cities. All coefficients are negative and highly significant (p < .01), indicating that cities with low SCPM tend to cluster together, while high-SCPM cities also exhibit spatial concentration. The coefficients range from −.048 in 2021 to −.095 in 2020, with temporal variation reflecting changing spatial patterns of environmental burden. The consistently negative values suggest that environmental improvements in one city are associated with better environmental outcomes in neighboring cities, or conversely, that environmental problems exhibit spatial clustering. This spatial dependence validates the need for spatial econometric methods in analyzing MIC policy effects. The temporal variation in spatial correlation indicates evolving environmental patterns, possibly reflecting policy diffusion, economic integration, or changing industrial location patterns. These results justify the subsequent spatial Durbin model analysis and highlight the importance of considering spatial spillovers in environmental policy evaluation in Tables 9 and 10.
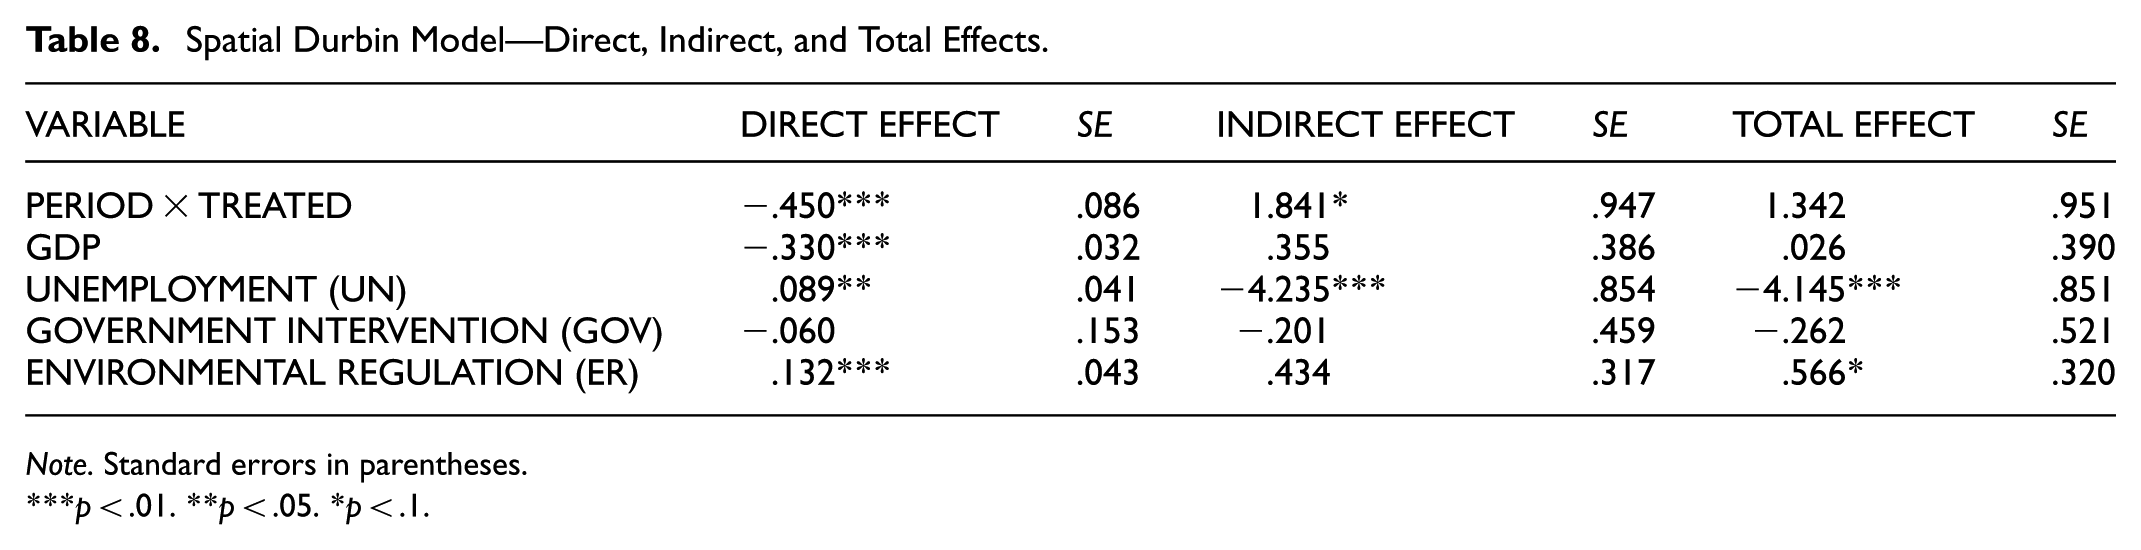
Spatial Durbin Model—Direct, Indirect, and Total Effects.
Note. Standard errors in parentheses.
p < .01. **p < .05. *p < .1.
Decomposition of Direct, Indirect, and Total Effects from the Spatial Durbin Model.

Note. Standard errors in parentheses.
p < .01. **p < .05. *p < .1.
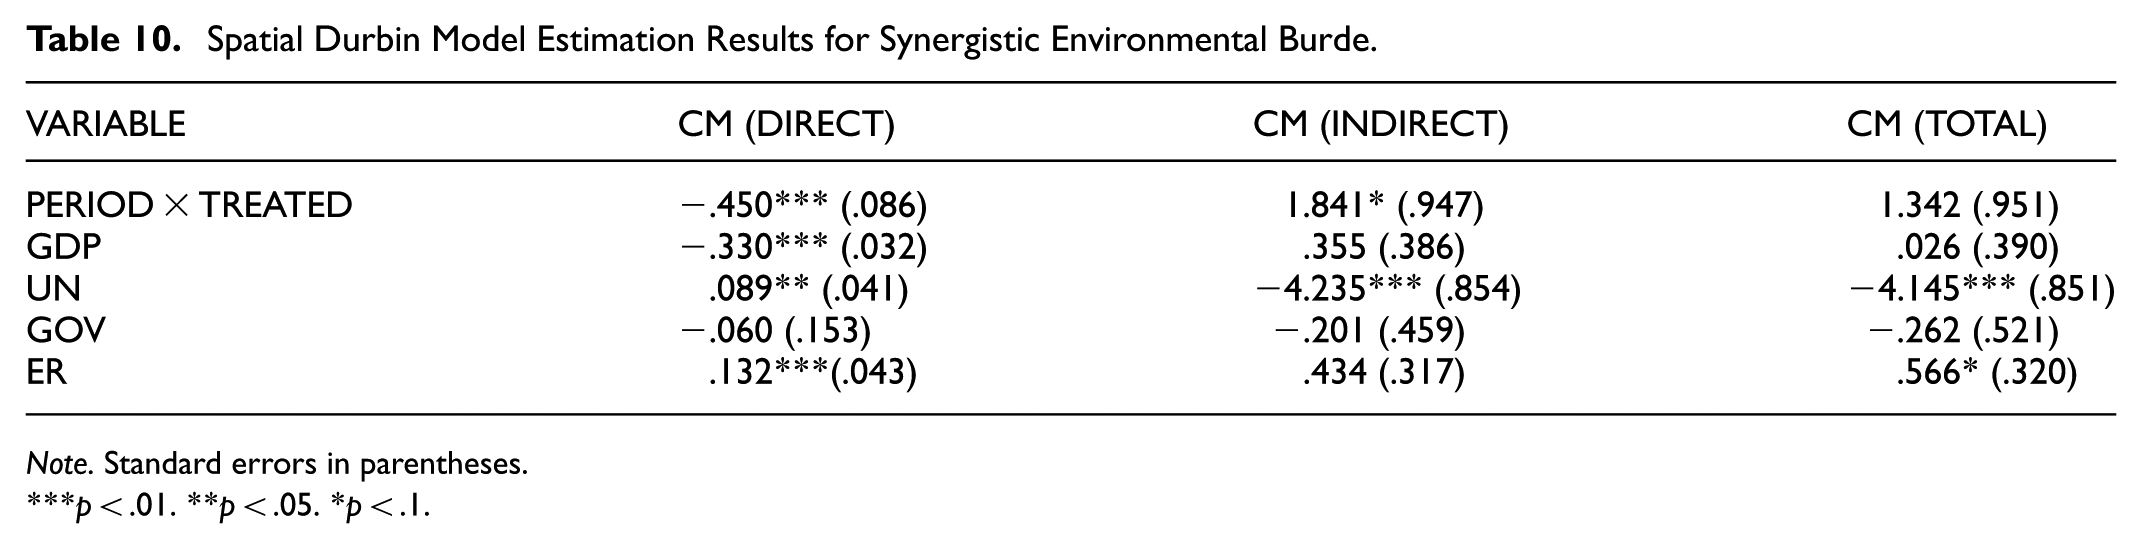
Spatial Durbin Model Estimation Results for Synergistic Environmental Burde.
Note. Standard errors in parentheses.
p < .01. **p < .05. *p < .1.
Discussion
Our findings demonstrate that the “Made in China 2025” policy has significantly reduced the synergy effect of carbon emissions and PM2.5 (SCPM) in pilot cities, primarily through industrial structure rationalization and human capital development. These results are consistent with recent studies showing that industrial policy and environmental regulation can jointly promote carbon and pollution reduction (Chen et al., 2023; Hu, 2023; Yang et al., 2022).
Compared to other research, our use of a time-varying DID model and extensive robustness checks provides stronger evidence of causality than cross-sectional or simple DID approaches. The observed spillover effects, where SCPM increases in neighboring regions due to resource siphoning, are also supported by recent spatial econometric studies (Chen & Wang, 2022).
Our results align with the broader literature on the co-benefits of industrial and environmental policies, but also highlight the importance of addressing regional disparities and the need for coordinated policy implementation to maximize environmental benefits.
Conclusions and Policy Implications
The transformation and green development of China’s manufacturing industry have become crucial tasks for the country’s progress. It has become increasingly necessary to empirically explore the impact of the MIC policy on synergy effects in China. We utilized panel data from 2003 to 2021, encompassing 284 cities. This paper adopts the MIC pilot in China as the quasi-natural experiment, We used the time-varying DID method, mechanism model and spatial model to verify MIC policy how to affect the SCPM.
The implementation of MIC policy significantly promotes a decrease in the systemic effect of carbon emissions and PM2.5. Robustness tests, such as the Placebo test, PSM-DID, and time-lagged model, can also provide evidence for this claim.
Mechanism analysis indicates that MIC policy promotes declaring SCPM through reducing the proportion of energy-intensive industries to achieve industrial structure rationzation. Meanwhile, through the direct role of human capital, employees can improve their environmental awareness, enhance the enterprise’s low-carbon environmental protection capabilities, achieve the simultaneous reduction of SCPM.
The Chinese government has implemented a series of environmental-friendly policies, all of which have a positive combined effect with the MIC policy. All policies will promote the MIC policy to reduce SCPM. The combined effect of the new energy policy and MIC policy has a strong effect on declaring SCPM.
From a spatial perspective, carbon dioxide synergy exhibits the characteristics of negative correlation agglomeration. The implementation of policies will reduce local pollution emissions, but the syphon effect will increase environmental pollution in the surrounding areas.
Based on the above evidence, this article proposes the following policy recommendations. MIC policy has provided strong support for the comprehensive transformation of China’s manufacturing industry. Therefore, we should enhance the exemplary impact of pilot cities to offer a wealth of manufacturing transformation experiences to non-pilot cities, thereby establishing a new paradigm for national manufacturing transformation.
The government must persist in enforcing the MIC policy and other environmental policies on enterprises, aiming to reduce waste in their production processes and vigorously monitoring their pollution discharge. The government should vigorously support technology-based enterprises, protect intellectual property rights, and encourage small and medium-sized technology-based enterprises to form industrial clusters, thereby improving efficiency. Build a human resources management system, establish a comprehensive low-carbon performance system for employees, and stimulate employees’ environmental awareness during the production process.
Due to the significant heterogeneity in the development of Chinese cities, the government must implement policies that align with local development laws, taking into account each place’s unique level of development. For instance, the development of old industrial base cities is relatively lagging, so the initial implementation of the MIC policy will have a significant impact. However, the city’s industrial structure is relatively single and its technology is relatively backward, which could lead to a diminishing marginal effect of the policy. Therefore, the government should focus on areas where technology and industrial structure development are relatively lagging, invest in infrastructure construction, and leverage local resources to enhance the marginal efficiency of the MIC policy.
Limitations and Future Research Directions
Despite the significant contributions of this study, several limitations warrant consideration. First, while the time-varying difference-in-differences methodology and spatial Durbin models effectively address causality and spatial spillovers, unobservable factors or policy endogeneity may still partially influence results. Second, the study focuses on prefecture-level Chinese cities and may not capture effects at different administrative levels or in rural areas, limiting generalizability. Third, the measurement of synergy effects relies on interaction terms of carbon emissions and PM2.5, which, though widely accepted, may not fully capture complex nonlinear relationships between pollutants and environmental outcomes.
Future research should explore longer-term impacts of MIC and other industrial policies on environmental and economic sustainability as more post-implementation data become available. Investigations incorporating other pollutants and more granular firm-level data could further illuminate mechanisms and heterogeneity in policy effects. Comparative analyses across different countries’ green industrial policies would enhance understanding of effective policy design in diverse institutional contexts. Moreover, integrating qualitative approaches or case studies may help unpack firms’ adaptive behaviors and innovation pathways in response to policy incentives.
Footnotes
Funding
The authors disclosed receipt of the following financial support for the research, authorship, and/or publication of this article: The present research was supported by the research fund of Dankook University in 2025’.
Declaration of Conflicting Interests
The authors declared no potential conflicts of interest with respect to the research, authorship, and/or publication of this article.
Data Availability Statement
All data supporting reported results can be available on demand.