
Abstract
Household participation in the hazardous financial market and the distribution of financial assets are significantly influenced by age, health, family size, property ownership, and family income. This study investigates families’ financial asset allocation behavior by constructing Probit and Tobit models and conducting a demonstration analysis using Stata software. Various factors, including age, health status, family size, property ownership, and family income, influence a family’s financial asset allocation behavior. The data is obtained from the household finance survey conducted in China between 2000 and 2023. These results theoretically support the government’s efforts to advance expansionary fiscal policy. It can serve as a roadmap for financial institutions to resolve challenges related to oligomerization and an aging population, as well as attract new customers and boost revenues. The nation’s significant disparity between prosperity and poverty, inadequate family income, and burden of family support are also highlighted. Declining fertility rates and an aging population have the potential to alleviate the financial burden and stimulate national and social development. It has the potential to enhance the growth and development of both nations and society. Population aging affects the allocation of financial resources among private families, generating several notable deductions. The discussion also includes metrics that establish relevant standards for governments, financial institutions, and private consumers. Governments implement legislative measures to alleviate the financial burden resulting from an aging and shrinking population.
Introduction
The National Population Development Plan (Tang et al., 2023) projects a notable developmental change in the Chinese population from 2000 to 2023. China’s aging population is predicted to continue rising during this period, with individuals aged 65 and above comprising a greater proportion of the total population (Ettinger & Marchini, 2020; Yan et al., 2023). The 2018 China Statistical Yearbook from the National Bureau of Statistics of China indicates that 16% of the Chinese population will be over 65 years old by 2030, while in 2017, individuals aged 65 and above made up 11.4% of the total population. Recent research has revealed that in addressing the demands of China’s aging population, biological age, rather than only chronological age, is a crucial consideration (Sun et al., 2023; Yao & Liu, 2025). Additionally, the National Bureau of Statistics’ 2020 report indicates that the number of individuals aged 60 and older in China has already exceeded 264 million, accounting for 18.75% of the total population. Of this number, 161 million are over the age of 65 (Guo et al., 2023), growing 52.47% in the last decade (Figure 1). This was published by the National Bureau of Statistics in 2022 in the National Economic and Social Development Bulletin of the People’s Republic of China (J. Wang et al., 2023).

Population aged 65 years and above (% of total population).
The aging of China’s population is a growing problem, and the strain on the country’s pension system is mounting as a result of gaps and downside risks in the system. There is a lower danger of poverty among the elderly because of the assets they have amassed over the years, even when they do not have a steady job (Y. Chen & Zhang, 2025). Therefore, increasing the rate of return on assets and bolstering residents’ pension security are crucial for easing families’ financial burden. The standard of living of Chinese citizens has risen dramatically, and their investment capital has grown steadily in recent years as the country’s economy has entered a high-quality development stage (Lopreite & Zhu, 2020). As of 2023, China’s overall GDP surpassed 110 trillion yuan, and its per capita GDP reached 80,000 yuan, according to figures from the Bureau of Statistics (S. Chen & Wang, 2023). As people’s discretionary incomes rise, they will place a greater premium on investing in secure financial products that provide a positive return on their money (Traore et al., 2021). In addition, with the help of the government, China’s financial market is expanding and improving rapidly. As new financial products enter the market, more investment opportunities are becoming available (Neifert et al., 2020). The family plays a significant role in China’s national economic system; however, most Chinese households only invest in safe assets, such as savings, limiting their portfolios to a single investment category and failing to take advantage of the benefits of diversification across asset classes. To maximize the benefits of asset allocation, families should allow diversified portfolios to boost peak returns and lower investment risk (Reynaud & Miccoli, 2019). A sensible distribution of financial assets can help families with hefty pension debts. Understanding the distribution of wealth within families has become increasingly important as the global population ages (Pascual-Saez et al., 2020).
The most significant result of this study is that China’s rapidly aging population seriously compromises the economic, political, social, and cultural vitality of its main cities. China’s aging population is forecasted to peak by 2040 (An et al., 2023). Population aging, a worldwide phenomenon, has notably impacted the labor markets and economies of many nations (Su et al., 2023). Once China reaches the Lewis turning point and the demographic dividend disappears, the aging dilemma will significantly affect its economic development (Jiang et al., 2021). Additionally, this type of division will pose a challenge to the war of disruption as old age progresses. Investment has primarily driven China’s economic expansion; however, there are inadequate resources to revitalize the nation’s faltering metropolitan areas. (J. Liu et al., 2024). The aging population will have broad consequences for the approach to operations, financial structure, and general volume of China’s economy and finances (O’Sullivan, 2020; Zhao et al., 2023). Through the ongoing development and refinement of the universal economic model, economists have developed expertise in the role that various extraneous factors play in the distribution of household financial assets.
As China’s financial market develops and improves, some issues—such as investors’ lack of investment awareness and financial expertise, which causes China’s resident families to prioritize cash and bank deposits over hazardous investments—should not be neglected (Xu et al., 2023). Owing to China’s aging population, few studies have examined the impact of financial asset allocation on household asset allocation, which has mostly focused on family and individual heterogeneity (Zhan et al., 2021). Population aging, age, health, family size, property ownership, and family income all affect household participation in risky financial markets. The goal was to locate issues and help Chinese households improve their wealth structure.
This study has several motivations. The dynamics of household financial behavior are understudied. Previous studies used static, cross-sectional analyses, making it difficult to separate individual-level behavioral changes and temporal stability. This study deliberately uses a large panel dataset to follow individual financial choices across various periods to overcome these limitations and analyze behavioral dynamics more nuanced and temporally sensitively. We also purposely use advanced panel data econometric approaches to carefully adjust for unobserved heterogeneity and potential endogeneity to gain more robust and accurate insights into the connections being studied. This research aims to improve the theoretical understanding of the broader theoretical area by providing empirically grounded evidence on topics such as household finance and behavioral economics.
The main contribution of this study is that earlier studies on the factors affecting household asset financial allocation have largely focused on and highlighted features such as household and individual variability. Scholars have not yet fully investigated the consequences of financial asset distribution in China, considering the aging population. Furthermore, the information gathered for this study consisted of either old or employee interface data from a specific year. Using the 2023 China Household Finance Survey (CHFS) data, this study investigates the influence of these two elements on aging populations and financial assets and the share of such holdings, thereby advancing research in this field and offering a deeper understanding of household-asset allocation concerns.
Furthermore, age as a determinant of asset allocation has been examined from an early stage, sooner than in China, thanks to micro-research, and has been specifically incorporated into the model for analysis. This could be due to the archiving of a more in-depth family questionnaire survey and statistical data. Despite variations in findings among countries and regions, micro-survey data are becoming increasingly realistic and complete because of the development of sophisticated financial markets. However, the impact of age is less apparent in these studies. The examination and consideration of micro-individual differences are insufficient, and the approach either relies heavily on theory or completely avoids micro research. Therefore, this study investigates the connection between the aging population and the distribution of family financial assets against the dual backdrop of a continuously accelerating aging population and a continuously improving financial market. The findings of this study can be used as a resource for the design of geriatric products offered by financial institutions and for asset optimization advice for families of the elderly. It is also crucial to advance the study of pensions, enhance China’s pension system, expand the country’s pension insurance options, and create a new pension sector. Section I introduces the study, defines the background for the subsequent parts, explains the significance of this line of investigation, analyzes relevant literature, and describes the methodology and the primary findings. We theoretically analyze the effects of an aging population on family wealth distribution. First, we explore key population aging ideas; second, we review the main household financial asset allocation theories; and third, we explore how population aging affects them. Section II discusses the aging population and family wealth distribution. We identified a high population average age. Population aging affects structural and household financial asset allocation. Section III presents an empirical examination of population aging and the distribution of family financial assets. This study examines data from the 2023 Chinese Family Finance Survey using Probit and Tobit analyses. We empirically examine the scope and depth of China’s private financial asset market and the effects of an aging population on it. Section IV presents the conclusion and policy recommendations. We offer policy recommendations backed by empirical evidence. This study proposes strategies to aid families in adapting to the increased background disturbance that is a consequence of population aging.
Income Equality and Population
According to official government forecasts, 30% of China’s population will be 60 years or older by 2035, making up an estimated 400 million individuals. The forecast predicts a substantial widening of the age gap as deaths surpass births for the first time since 1961. In terms of population, Nantong is China’s oldest city (Ye et al., 2022). According to the 2020 Census of the National Population, Nantong’s senior population of 7.7 million was 30% older than the national average of 18.7% (Yu et al., 2023). China’s average age of motherhood has increased by nearly 3 years, from 26.1 in 2000 to 28.8 in 2023 (Hong et al., 2023). The current economic climate exacerbates declining birth rates. Legislative reforms that make divorce more difficult and higher expenses associated with raising a family are leading to a decline in marriages.
Finally, we can put the possible impact of income or wealth differences on the risk-taking behavior of our units of study into context by looking at inequality and risk preference. We know that income disparity can worsen or interact with financial overconfidence, but we do not know how these two factors affect our ability to make sound financial decisions. Although our research may center on people or households, understanding how a major external shock like the pandemic can change risk-taking tendencies across various entities can offer a useful comparative viewpoint or reveal pertinent processes, including small and medium-sized businesses that are not family run. Managerial entrenchment and social responsibility disclosure influence firm risk-taking. Entrenched management, corporate social responsibility, risk-taking, and shareholder actions interact intricately. Theoretical frameworks offered by these studies, which center on businesses and managerial behavior, link agency difficulties with risk-taking and transparency. Our situation may have similarities or provide related concepts that are useful for understanding decision-making strategies in the face of uncertainty. To the extent that financial derivatives contribute to income disparity
Distribution of Household Financial Assets
Prior literature has begun allocating financial assets to the elderly and their families since the 1960s. In contrast, China did not begin serious exploration of this topic until the 2000s. The study analyzed data from 1979 to 2007 to examine the correlation between residents’ ages and the amount they saved (L. Chen et al., 2023). According to his findings, a person’s ability to save money increases in the short term as they get older, but this effect diminishes over time. The analysis of pertinent microdata revealed an inverted U-shaped pattern in the life insurance asset-holding ratio of individuals aged 40 and above. The correlation between age and risk appetite was investigated by (Pan et al., 2022) using survey data on domestic family financial assets in China. The study concluded that the inhabitants’ risk tolerance steadily declines with age. While our study covers the larger ramifications of financial conduct, this line of inquiry specifically addresses the effect of particular financial instruments on inequality. This study examines disparities in rural income and the impact of digital financial tools on it. One possible critical mediating or moderating element in the links we are studying is inequality, and our study emphasizes the relevance of financial literacy in this context. We will not rest until we have thoroughly backed our theoretical framework with the most recent and relevant research.
Financial Markets Risk
There is an inverted U-shaped association between the age changes of the household head or responsible person, the older population share of the family, and the family’s amount of savings in relation to financial market risk (An et al., 2023). Some academics consider other variables beyond chronological age, such as sex, family composition, educational attainment, and home ownership. It is incorporated into the framework for studying how families allocate their financial resources. Through the use of a questionnaire design and statistical analysis, we discovered that households with fewer members typically exhibit low financial risk tolerance and a preference for low-risk investments (R. Khan, 2023). Using data from the 2015 China Family Finance Survey, it argues that, in contrast to families in industrialized nations, Chinese families display marked conservatism when allocating their financial assets (Dunbar, 2023; R. Khan et al., 2022). More households are opting to put their money into safer investments, such as bank savings, and reducing their exposure to more volatile markets.
Moreover, the findings show that factors like household income, family size, and investment expertise influence family financial asset allocation. This study focuses on how a family’s financial literacy and risk outlook affect the distribution of their risk capital. The study concluded that the share of risk assets owned by families was higher when family investment decision-makers had higher financial literacy (Yin et al., 2023). By conducting a comprehensive analysis of the connections between our research questions, hypotheses, and findings and the proposed studies, we can enhance the theoretical underpinnings of our work and its influence. Additionally, it reiterates appreciation for these comprehensive and beneficial recommendations for future research. Family financial behavior is often the expected result of the combination of financial literacy and risk attitude change, as shown by the fact that the risk attitude of family members mediates the impact of financial literacy on the percentage of family involvement in the financial market and the percentage of risk assets.
Methodology
Data were collected from official sources, including the China Statistical Yearbook and the CHFS database of the National Bureau of Statistics of China. We analyzed a substantial amount of literature on the aging of the Chinese population. By gathering relevant data and literature, we can obtain a more comprehensive and in-depth grasp of the current situation in China and provide a theoretical framework and data support for further empirical analysis (Cheng et al., 2023). In the second chapter, the study summarizes and discusses the method used to combine split-lot research on how an aging population affects local and international family financial asset allocation with relevant hypotheses. Additionally, it uses the 2023 Chinese Family Financial Survey data. The implications of an aging population on families’ access to risk-specific financial products and the importance of age in financial asset ownership are empirically studied using Stata as a folding tool for the Prohit lock and Tobit bag types.
Data Collection and Sample Selection
This study draws on information from the CHFS, conducted annually by the China National Store Financial Survey and Research Center at the Southwest University of Finance and Economics. The exhibition’s sample survey included a day dedicated to gathering household-level data on both gold and oil. We examined family economic and financial behavior in depth, covering topics such as demographics, employment, social security, insurance, subjective attitudes, income, and consumption. The author drew his findings from the 2023 China Family Finance Survey, which polled 333,635 families across 29 provinces and 343 districts and counties. This information is trustworthy because it comes from reputable sources.
Variable Descriptions
It is important to gauge a family’s risk tolerance when researching how they choose to allocate their wealth. It is also important to see how much exposure families have to volatile markets, as it can help determine the best way to allocate their financial resources. This article presents the current situation of risky financial and stock assets, along with the percentage of these assets within family financial portfolios, which indicates the breadth and depth of family participation (H. Li et al., 2022; Xu et al., 2023). If the family has risky financial assets (vouchers/tickets/funds), the value is 1; otherwise, it is 0. If the stock is documented, the family owns it; otherwise, it does not. Alternatively, the stock ratio = stock/total financial assets, assesses stock assets. The household head’s birth year in 2023 was reported as their age. Age 2 is the squared age of the household’s breadwinner. In addition to loyalty age, we examine how the electric age square affects financial asset allocation to see how it affects our conclusions concerning age and investment strategy. This is due to the possibility of nonlinear linkages in the allocation of financial assets. Specifically, the change in the allocation of financial assets may not be natural but rather take on a curvilinear form as a function of age. Hence, the minimum joining age was set. This variable can reflect the interplay between age and savings strategies more accurately. Under-16s are the most entrepreneurial. The control variable “sex,” representing the household’s major breadwinner, is 1 for male and 0 for female. The breadwinner’s education is listed. The volume includes junior high, middle school (business and technical), high school, and university. Values 1 to 3 were used in this order. Based on the questionnaire, the head of the household’s health is recorded as “health,”“good,”“average,” or “bad.” The three-tiered well is numbered 1 to 3. The household head is declared “married,” with “1” for married and “0” for single status. Risk attitudes were collected from risk-loving to risk-averse. There are three tiers with values between one and three. F represents the total number of family members. House is documented as 1 if it is owned, 0 otherwise. The family’s annual income was recorded.
Analytical and Theoretical Approach
Considering the analytical framework of financial resources and the geriatric population, the aging population represents a typical demographic dynamic that influences households’ financial resources. The proportion of senior citizens is increasing, while the number of young individuals is continuing to decrease. (Vu et al., 2021). This concept encompasses two distinct meanings. First of all, the proportion of people 65 years of age and above is showing an increasing trend. Second, this tendency reflects the aging social demographic structure, and the marker has now entered Laotian society (Park et al., 2022). The United Nations’ definition of an “aging population” is when a country or territory contains more than 7% of its population that is 65 or older, and this is just one of two widely accepted worldwide definitions of an “aging population.” The percentage of elderly people in this society is increasing, and that’s something to celebrate (Cupák et al., 2022).
A reevaluation of the theories is made possible by the use of modern portfolio theories, precautionary saving, and the life cycle inside the theories’ structure. A reevaluation shows the conceptual relationship between financial assets and an aging population. First, the life cycle theory states individuals’ spending, saving, and investing patterns change throughout time (R. Khan et al., 2023; Rodrigo et al., 2023). The findings show that the life cycle theory can explain portfolio changes throughout a lifetime and provide a fresh justification for portfolio selection. Second, Friedman felt that, according to precautionary saving theory, people will make prudent decisions on risk-reducing saves based on future risk and uncertainty (Hsu, 2013). Third, modern portfolio theory (MPT) helps investors choose investments with the highest return within a risk profile. Based on financial asset allocation strength, we employed investment management in this study. This concept also differentiates hazards within a reward combination to reduce risks and increase predicted benefits within a tolerable risk. This portfolio-building strategy uses security correlations. Consider risks and rewards when grading the portfolio. Portfolio theory, which has shaped investment management, is based on this premise.
Probit and Tobit Models
Probit and Tobit’s models are statistical techniques commonly used in econometrics to model binary or censored response variables (Equation 1), respectively. Probit models are a type of regression model that is used to analyze binary or dichotomous outcomes, where the response variable can either take on one of two possible values (H. Wang et al., 2022). In this study, these models evaluate the probability of a specific result by fitting a regression equation to the age, health condition, family size, property ownership, and family income, all of which affect the family’s financial asset allocation. Similarly, Tobit models are used to analyze censored response variables, where the observed value is truncated at a certain threshold or limit. Given the inherent flaws in the linear probability model and drawing on the work of other scholars, it is clear that this approach needs significant revision (Brezigar-Masten et al., 2021). We employ two models to analyze and explore the evidence in this study: The first step is to utilize the Probit model to evaluate if population aging affects families’ tendency to hold volatile financial assets (Bi & Khan, 2024). A probit model is a regression whereby the response variable—like marital status or single—has two different values. Using a probit link function, probit models—ordinal or binary response models—have usually, the maximum likelihood approach and probit regression help one estimate this model. If the response variable Y is binary, it can only take on two possible values: 1 and 0. Y could stand for a disorder, tool, survey response, etc. We also have X, a vector of regressors that could influence Y. We particularly consider how the model arises.

Probability (Pr) and ϕ is shown in the Equation 1 which represent the standard normal distribution’s Cumulative Distribution Function (CDF).) Typically, maximum likelihood is utilized to estimate β parameters. Probit can be justified as a latent variable model. Consider an additional random variable with µ = N (0, 1) (Equation 2). Y can predict whether this hidden variable is positive:

Comparing the standard normal distribution to an arbitrary mean and standard deviation does not diminish its generality. This is because a decrease in the intercept can neutralize an increase in the mean and standard deviation, and an increase in the weights can neutralize these increases.

On the biases of
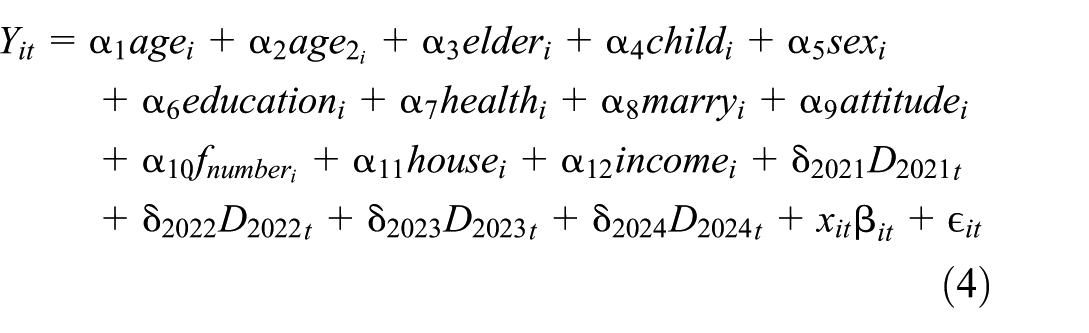
Equation 4 demonstrates that D2021_t is a dummy variable that is equal to one in Equation 3 if the observation t is from 2021 and equal to 0 in all other cases. It is the coefficient δ2021 that is associated with the dummy variable for the year 2021. After taking into account all of the other variables in the model, it represents the typical difference in Y that exists between the year 2021 and the year that serves as the baseline (2020). The same reasoning previously described applies to the year 2022: D2022_t, δ2022. The year 2023 is used in the same scenario as D2023_t and δ2023 but extended to 2024: D2024_t and δ2024. However, the interpretation of the coefficients on the dummy variables is affected by the baseline year, although the baseline year does not have an effect on the overall fit of the model (Bi & Khan, 2024). In the baseline year, the coefficients will indicate the degree of deviation. For the purpose of avoiding perfect multicollinearity, include t–1 year dependent variables in the regression analysis. This is due to the fact that the quantity of dummy variables in the data is spread over several years. The dummy variables would be equivalent to a constant defined by the intercept if all the “t” were included. After taking into account all other regressor variables in the model, the coefficients on year dummy variables, which are referred to as δ terms, represent the average impact of being in that year on another variable, Y. Macroeconomic disruptions, policy changes, or other time-specific factors not included in the variables could cause this. The year dummy variables have a unique effect on Y each year; therefore, we examine their interactions with other regressor variables. The regression equation is finalized by the inclusion of binary indicators and year dummy variables as regressor variables. Dummy variables are fully described, and their coefficients are interpreted in this analysis.

The second objective, as demonstrated by Equations 4 and 5, is to employ the Tobit model to examine the proportion of financial assets that the geriatric population possesses in comparison to the family, a similar approach to Probit. The letter “i” usually stands for the person: Traditional usage of the subscript “i” indicates a single person or cross-sectional unit, such as a family, business, or even a nation. By convention, “t” stands for time. In common usage, the subscript “t” denotes either a discrete instant in time or a duration of time. This section details our research into the accessibility of more granular or individual-level data pertaining to the “elderly” variable. If such data is not available, we are currently looking into interaction effects to capture any heterogeneity, and we have given a stronger theoretical rationale for adopting the country-level measure as a substitute. Furthermore, it evaluates the findings’ robustness by performing sensitivity analyses, which involve either removing the variable or using alternative measurements (R. Khan, 2021; Moulton, 1990). If data limitations prevent a complete elimination of aggregation bias, the study notes this limitation and explains how it may affect the interpretation of the results. Tobit’s models, often known as Tobit regression or censored regression models, are statistical techniques for analyzing censored data.

In this study, we employ the Tobit model to account for censoring, which occurs when a variable’s value is only partially observed or not recorded at all. When a response variable is either truncated or censored, resulting in minimal variation, Tobit’s models are very beneficial. Commonly, the Tobit model is applied to cases of censored data in which the values of the response variable in certain observations are aggregated at a limit, typically zero or a specific threshold. In this context, Y represents the proportion of risky financial assets within household financial assets as shown in Equation 6, where y’ denotes the portion of this ratio that is greater than 0, and the meanings of the other variables remain as previously described. Consequently, we have abandoned the Tobit model for the second response variable (the proportion of hazardous financial assets) in the updated edition of this research (W. J. K. Rabnawaz, 2024; Villadsen & Wulff, 2021). We opted instead to use a fractional probit or fractional logit model. To choose the best method, we take into account both the practical considerations of data and the theoretical consequences of these fractional response models (Amore & Murtinu, 2021). Verifying that the selected model adequately represents the connection between the regressor variables and the limited response variable entailed checking the link function. In non-linear models (e.g., logit, probit, or fractional response models), the marginal effects offer a richer picture than just looking at the coefficients, since they are not constant.
Results and Discussion
Models developed by Probit and Tobit drew on data from China’s 2023 household finance survey. We employed the Probit and Tobit models to evaluate several variables, including age, health condition, family size, property ownership, and family income, in order to examine the influencing factors on financial asset allocation in the instance of China’s aging population. Table 1 of the China Statistical Yearbook 2022 shows the projections of aging for 2023. Comprising 1.143 million, or 14.2% of the global population, well over 200 million individuals worldwide are 65 or older. With a percentage of 15 to 64 years old, the age group with the highest proportion also had a rather high dependency rate (Figure 2).
China’s Population’s Birth Series.

Note. Unit 10,000 people.

Proportion of ages and dependency ratios.
Simultaneously, the elderly reliance ratio has reached 20.8%, and the aging process itself has shown signs of speeding up even further (C. Liu et al., 2015). As per the above model, the characteristics of the individual’s aging and financial assets were analyzed. The aging of the population and the household, which examines the severity and root causes of each individual, has been divided into two parts that make up the financial asset allocation (Thebulo et al., 2022). In the end, each factor is computed using robust and empirical regression.
Aging Severity
China has the most senior people among fast-aging nations. The Bureau of Statistics predicts that by 2022, China’s 60-year-old population will be 280 million, 19.8% of the total population, and its 65-year-old population will be 210 million, 14.9%. The National Institute on Aging predicts that the senior population in China will surpass 400 million by 2033, accounting for approximately 25% of the nation’s total ancient population. It reached a maximum of 483 million annually, which was more than one-third of the global population at the time. According to projections, China will be the home of 25% of the world’s elderly and a staggering 50% of Asia’s elderly by the middle of this century. Moreover, the difficulties of “old before preparedness” and “old before being rich” are significant, demonstrating that China’s aging population has become a significant burden (Bi et al., 2024; Muleme et al., 2023). Problems like old-age care and medical care emerge simultaneously, overlap with one another, and affect the total rate of economic and social development in significant ways, posing considerable strain and difficulties to it (Acedera et al., 2023; Byrwa-Hill et al., 2023).
Population Aging’s Root
The aging population has been calculated based on two factors: first, the policy of family planning that has been put into effect, and second, the continued rise in the quality and longevity of medical care available to the population as a whole (Xing et al., 2022). The birth rate has dropped dramatically due to the family planning program, which has been implemented for over 30 years and has led to a 10% decrease in population growth from 2000 to 2023, as shown in Table A1 (Appendix A). We recognize the importance of precise and explicit variable descriptions and place a high value on meticulousness. The sample values demonstrate evidence that the variable “AGE” in Appendix A: Table A1 relates to the age of the household head (or the individual, depending on the unit of analysis; R. Khan, 2021, 2024). While it’s common to talk about population age in terms of percentages within certain cohorts, our ‘AGE’ variable serves as an explanation for the exact age in years of our unit of analysis and is continuous. In the updated manuscript, we have removed the symbol, checked all tables for the same mistake, and clarified the meaning and measurement unit of “AGE” (age in years) in the appendix or appropriate section to avoid any confusion.
Despite the complete abolition of the two-child restriction in 2016, its impact on family planning remains evident today. Due to strong economic expansion, advances in science and technology, and improved medical and health standards, both national health conditions and living standards have significantly improved, as evidenced by higher medical levels and increased average life expectancies. These modifications have also resulted in an increase in the life expectancy of the general population. The 2023 Bulletin on the Development of China’s Health Care indicates that the average life expectancy of Chinese citizens will increase from 91.60 in 2020 to 92.52 the following year. Several nations are striving to raise the global average life expectancy to 77.93 years; however, this would demonstrate the combined national strength of only four of them. The happiness index and life expectancy can both benefit from an increase in longevity. Nevertheless, the proportion of the population over the age of 65 increases in tandem with the increase in life expectancy.
Strength and Financial Assets
Both financial and non-financial assets influence the entire stock of household resources, according to current financial asset allocation patterns. Table A2 (Appendix A) breaks down the family’s financial assets as follows: cash, deposits, stocks, funds, and insurance (Cappai, 2023). The size of a family’s financial assets can be estimated by adding together their cash, deposits, stock, fund, and insurance holdings, which is represented by the term “total present value.” Allocation structure refers to how much of a share each financial asset has in the whole (S. Chen et al., 2023; R. Khan, 2023). The distribution of these financial resources is next examined, taking into account historical context and present-day conditions. The percentage of cash kept by households is declining. The percentage declined steadily from 16.04% to 5.04% between 2000 and 2023. Three things cause this. It does this by matching banking sector growth. Internet banking has eliminated the necessity for large cash reserves in houses. Second, broad financial product promotion convinced households that investing their money would generate a beneficial return, reducing cash depreciation. Third, high-speed e-commerce has accustomed many households to buying online, which has reduced their need for cash (W. Zhang et al., 2018).
Table 2 demonstrates that barely 8.22% of Chinese families are active participants in the stock market, and even fewer are active participants in the country’s home risk financial market. As a proportion of overall household financial assets, stock assets make up about 1.41%, while household risk assets account for barely 1.74%. Additionally, the marginal effect shows how the anticipated value of the fractional response variable varies for every one-unit change in the regressor variable. The median age of a household breadwinner is 67.6. China’s aging population is a big problem, as evidenced by the fact that most families in the country’s emerging middle class are headed by people in their forties or fifties (Huo et al., 2023).
Descriptive Quantification of Each Variant.

Note. The observation value is 40,362 for each variation.
and ** to indicate statistical significance at the 1%, and 5%.
Presently, there is an inadequate explanation regarding the degree of education in question. In the subsequent iteration of the publication, the methodology for establishing and quantifying the education level in the dataset will be exhaustively defined. For the sake of clarity, we have listed the precise scale or categories that were initially used to evaluate schools (such as the total number of years spent in school, the highest degree earned, and specific levels of education). Finally, we clarify here if the education variable was previously treated as a continuous one in the model. The problem with the data point labeled “1.321, educational level,” which seems to be a mistake or a placeholder, is specifically addressed. Health and household are also included. This issue will be investigated and corrected as part of the data cleaning procedure for the new study. The coefficient/marginal effect (0.021) indicates that, for every one-unit increase in a measure of household hazardous financial assets, the likelihood of the result rises by 2.1 percentage points. This effect is statistically significant at the p-value .001. With the strongest positive marginal effect, the elder population (0.114) and household age (0.052) show influence (Nawaz, 2024). This suggests that the most significant increase in the probability of the outcome corresponds with a one-unit rise in the elder population. The second-highest positive marginal impact of this variable indicates that a 1-year change in household age corresponds with a notable rise in the probability of the outcome. Moreover, the variable has the lowest positive marginal impact on the proportion of risk (0.015) and education level (0.017), which denotes even more that a one-unit increase in the proportion of risk corresponds with the smallest increase in the probability of the outcome among the factors that have been found (W. J. K. Rabnawaz, 2024). The educational variable has the second-lowest positive marginal effect, which suggests that the probability of the outcome increases by a relatively modest amount for each one unit increased in education.
Table 3 shows the logistic regression outcomes. Among the elements, wealth (odds ratio = 1.538) and education (likelihood ratio = 1.788) show the greatest favorable link with the chance of engaging in the financial activity. Assuming all other factors stay the same, this suggests that homes with greater income and education are far more likely to follow this specific financial pattern. The house (odds ratio = 0.991), age2 (odds ratio = 0.991), and the non-significant elder (odds ratio = 1.125) and child (odds ratio = 1.118) variables, on the other hand, show the weakest positive association, coming closest to an odds ratio of 1, suggesting that these variables have a relatively weak or statistically uncertain positive influence on the odds of participation.
Logistic Regression With the Odds Value of a Ratio.

Note. *** indicates extremely significant.
However, being a female-headed household and possessing a more positive attitude (as defined in the study) are significantly associated with lower odds of participating in this financial activity, as these variables exhibit the strongest negative association (odds ratios significantly below 1), indicating that they should be taken into account. With an odds ratio of 0.928, health is the variable with the weakest negative correlation, suggesting a tiny but statistically significant negative link where improved health status is related to slightly reduced odds of involvement (Bi & Khan, 2024). This is the variable that is closest to an odds ratio of 1, but still below. Last but not least, there is a strong negative correlation between f_number (odds ratio = 0.869) and participation rates, indicating that bigger families are less likely to take part. These interpretations are predicated on the premise that the presented coefficients were, in fact, derived from a logistic regression and that the assumed standard errors and p-values reflect the actual significance levels. It is vital to highlight that this assumption allows for these interpretations to operate. Values that are further away from one indicate a higher effect on the odds of participating in the financial activity. The magnitude of the odds ratios provides a measure of the intensity of the link, with increased values suggesting a bigger effect (R. Khan et al., 2022). Taken together, these two groups account for over half of the total population; the average number of people living in a family is 3,087; the proportion of adults who are over the age of 65 is 45.12%; and the percentage of people with low earnings is 13.08%. Furthermore, it’s around 75% of all households in the world (R. Khan, 2021; S. Z. R. Khan, 2021; Rabnawaz Khan, 2020). An education level equivalent to that of 1776, which is comparable to a junior high school or technical secondary school, represents the highest educational attainment for the average household head. Eighty-four percent of families have at least one married member. The median risk attitude is 3.09, suggesting moderate caution. The family as a whole is risk-averse and has a poor risk tolerance. The average answer of 1.01 to the question of property ownership shows that most families in the sample are homeowners. According to the statistics available, the average Chinese family earns just 103,839 yuan per year. Maximum value and standard deviation both indicate a vast disparity between China’s wealthy and its poor.
Robust Analysis
The effect of the aging population on family involvement in the stock market. Use the Probit model to conduct an empirical study of how the aging of the population affects people’s willingness to invest in volatile stock markets and other forms of risky financial investment. According to empirical regression outcomes in Table 4, the first shows how an aging population affects a family’s willingness to invest in volatile markets (Kaltenberg et al., 2023). The data suggests that:
Probit and Tobit Model of Population Aging Finance and Stock.

Note. There are parentheses around the robust symbols *** and ** to indicate statistical significance at the 1%, 5%, and 10% levels, respectively, when referring to standard deviations.
The second column presents results from empirical research on how the aging population has affected stock market involvement at home. Age of the household head is favorably connected with holdings of hazardous financial assets and equities. The propensity of a household’s main breadwinner to stick to stocks and other potentially volatile assets increases with their age. The likelihood of owning risky stocks and financial assets is proportional to the square of the household head; thus, the likelihood of holding such assets begins to decline after a certain threshold is reached. The age of the household breadwinner has an inverted U-shaped relationship with his or her family’s stock market and other risky investment participation (R. Khan, 2023; K. Rabnawaz, 2021). The structure of the quadratic equation then leads us to the conclusion that a family’s exposure to risk in the financial market reaches its greatest magnitude, as measured by the coefficient of age and the square of age. It’s around 62 years old when the likelihood of accumulating financial assets begins to diminish; it’s around 61 years old when family involvement in the stock market peaks and begins a downward trend (Fong et al., 2021; R. Khan et al., 2022).
The senior population’s exposure to high-risk investments is measured. According to our analysis, service quality is the only factor that affects financial ratings. The youth population is not outdated or old-fashioned (Kong & Khan, 2019). Wanting to return to the public diamond with a two-point folding system, we discover that doing so would result in a change to the female sleep phase rather than a return to the Tai number of the broad subject (Jin et al., 2022). The wide spectrum of big disasters is one of the distinctive features of the dense manufacturing and garment gathering of feng acid gold. Regarding the specific risks associated with gold acid production and special stocks, a family’s yearly income is classified as being at powder level 2 (S. Z. R. Khan, 2021). Families can participate in these markets if they have a particular amount of Mingjiao and a certain level of income (R. Khan et al., 2022; Xiong et al., 2021). Additionally, when using the two-point folding mechanism to return to the public diamond, one can discover that one is not permitted to revert to the number of the wide subject and instead must transition to the feminine sleep phase (R. Khan et al., 2022; R. Li et al., 2022). To steal the family’s financial bank is a personal risk, regardless of whether it’s the same as the family’s particular risk of financial fluorescence (Munford et al., 2020; Rabnawaz Khan, 2020). Everyone benefits when a family’s involvement in these marketplaces directly impacts the health of the breadwinner (S. Z. R. Khan, 2021).
Logistic Regression
The impact of population aging on wealth distribution within families. The Tobit model is utilized in forensics studies that examine how an aging population can affect the distribution of family wealth. Table 5 displays the outcomes of the empirical regression. To begin, it is given as a factual outcome of the risk of financial assets that make up the overall financial assets of households (Shahana et al., 2023). Second, we present empirical evidence that stocks are a significant part of a family’s wealth. The data suggests that:First, the Tobit and Probit models perform similarly in terms of age and hazardous financial asset allocation ratio. Risk assets as a percentage of family wealth are expected to peak when the breadwinner is 66, with equities reaching their top at 65. The 60 key challenges may be triggered by the fact that after retirement, a person’s main source of income is fixed income, such as a pension. Asset value must be retained through low-risk, consistent investing to reduce risky asset allocation. Growing geriatric and diminishing child populations pose financial risks. Since the indicators are uncorrelated, the allocation ratio of hazardous financial assets is unaffected by stock market performance.
Probit and Tobit Model of Population Aging Risk and Stock Ratio.
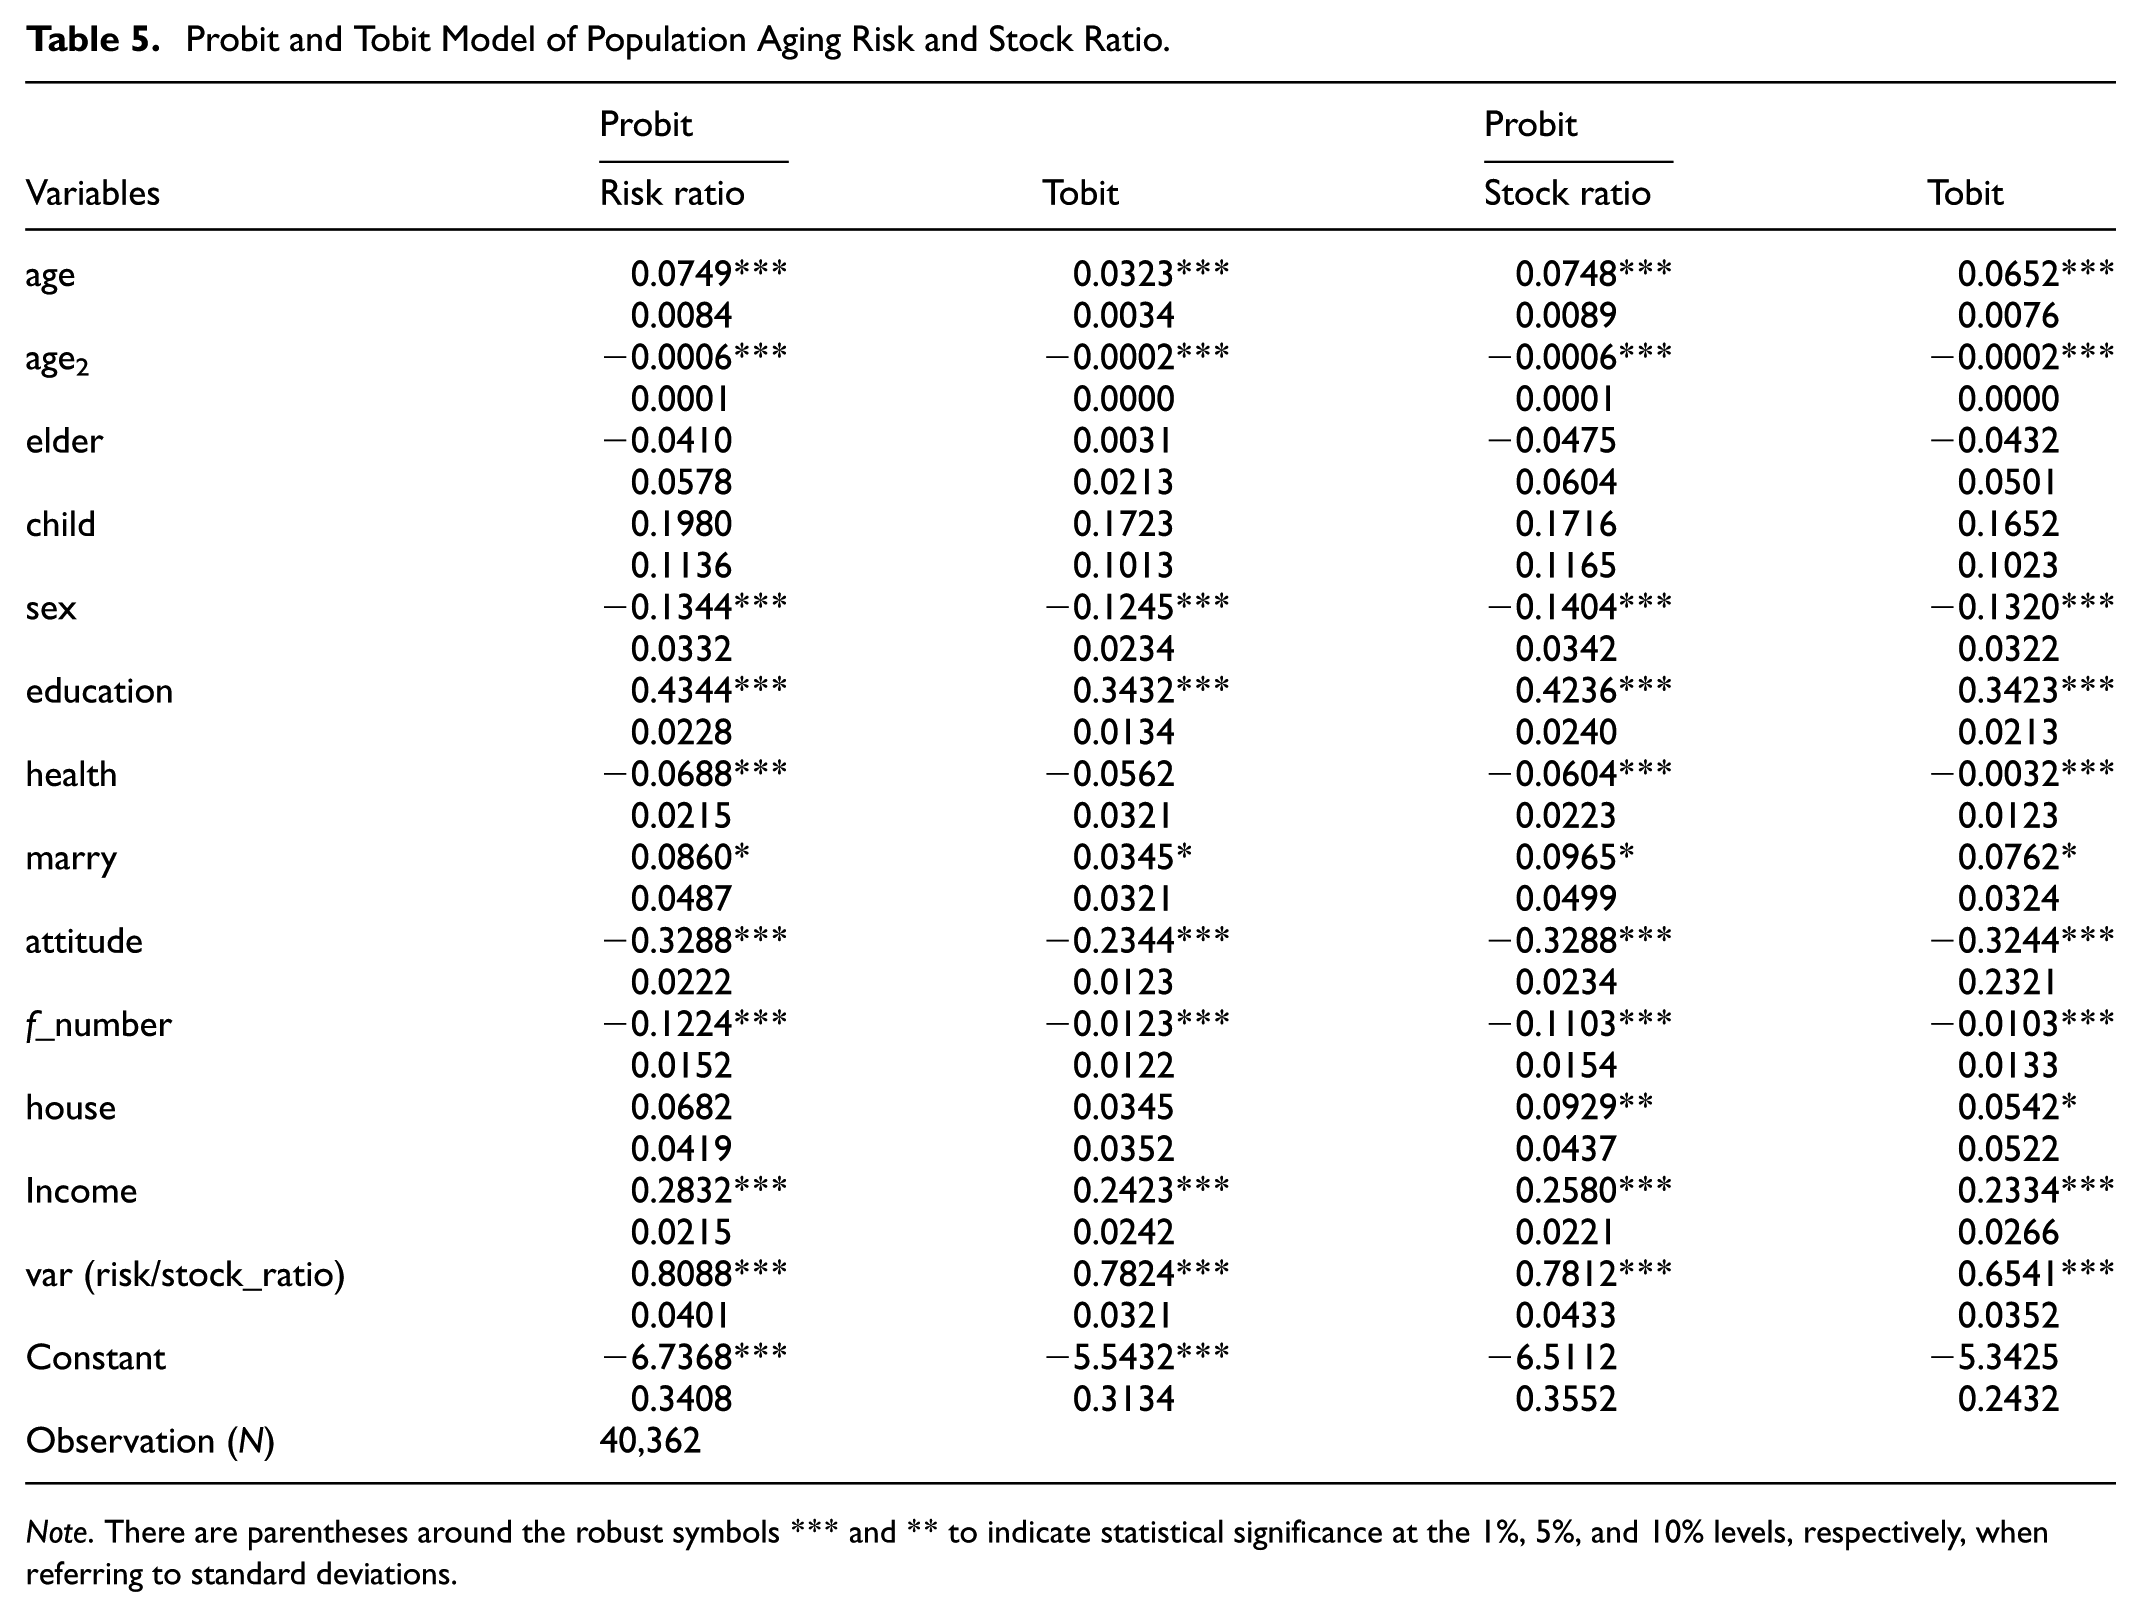
Note. There are parentheses around the robust symbols *** and ** to indicate statistical significance at the 1%, 5%, and 10% levels, respectively, when referring to standard deviations.
In addition, after controlling for other variables in a regression analysis, the holding share of risky financial assets and equities is substantially affected by the gender of the household head. The willingness of male heads of home to lower the holding proportion of risky financial assets and equities is higher than that of female heads of household. Furthermore, the fluctuation of the risk and stock ratios was computed separately; the risk ratio showed 0.80 with −0.40, and the stock ratio showed 0.78 with −0.043, which is 2.01% more than the risk ratio. This result mostly fits the Probit model, which supports the validity of this conclusion even more. The head of the household’s degree of education is rather significant and closely relates to the percentage of hazardous financial assets and stock distribution. With a 1% sexual level, higher-educated heads of households seem to have more advantages in venture capital since they have more financial knowledge and experience and can better understand the connection between risk and return. The share of risk financial assets and stock allocation is inversely related to the health status of the head of the household. This indicates that families tend to decrease the quantity of risk assets and equities the poorer their health is. Table 6 provides the regression findings on finance, stock, risk ratio, and stock ratio related to population aging. Because the 2023 questionnaire focused exclusively on new households, this study presents only the regression results obtained using the Poisson estimate and Negative Binomial (NB2) methods. These calculations showed that population aging negatively impacts finances and risk ratios. Risk financial assets and stock allocation increase by 0.236% and 0.215%, respectively, with 1% yearly family income growth. Marital status predicts risk, financial asset allocation, and equity allocation at 10%.
Population Aging Finance and Stock.

Note. There are parentheses around the robust symbols *** and ** to indicate statistical significance at the 1%, 5%, and 10% levels, respectively, when referring to standard deviations.
This demonstrates that married families are more likely to invest in risky assets with high return potential, such as equities, perhaps due to their more secure financial situation and longer-term investing goals. The Tobit and the outcomes of the Probit model show how much of an effect the risk attitude has on the degree to which a family invests in high-risk assets (Cai et al., 2023). The results of the two models indicate a substantial correlation between risk aversion and the proportion of family finances invested in high-risk assets. Additionally, the percentages of equities and assets that are proportional to family risk can be matched. This may be due to the fact that larger families are more likely to hold a smaller percentage of risk assets and face greater financial risks and responsibilities.
Therefore, the allocation of the ratio of the real estate to individual risk fund assets and the allocation ratio of shares are trending upward, but it is only the allocation ratio of service tickets that has gained statistical significance (L. Zhang et al., 2020). The fact that real estate generally generates a predictable income flow and offers potential for asset appreciation is enough to motivate real estate owners to invest in the stock market. This has a negligible effect on the risk-financial asset allocation proportional equation (Ooi, 2023).
Based on the analysis, these policy ideas are listed: First, preferential maternity policies and women’s and children’s welfare policies can help us achieve the “three-child political meal” and reduce population aging. Families invest most in high-risk financial assets between 60 and 65, according to research. Consumers’ exposure to volatile financial assets will decrease. Thus, to maximize household financial asset distribution, the share of people 60 and older should be reduced so more people can invest in riskier financial markets. Second, significantly increase social security. As the family grows, their consumption and maintenance load will increase, which will make them more cautious and less willing to invest in riskier financial assets, thereby limiting their excitement for investment. We recognize that the current research content does not offer direct and specific policy recommendations for China’s financial industry. The current analysis does not completely realize the broader intended scope, and this subtitle appears to be premature. To encourage families to actively invest in risky financial assets, we need to further improve the social security system, decrease the burden on families, and improve their excitement for investing. Third, the government can implement several strategies, including the popularization of financial knowledge and education programs, to increase citizens’ financial literacy and their propensity to invest in high-risk financial assets by teaching them how to invest their money and diversify their portfolios. As a result, households will be more likely to allocate resources in a way that maximizes their return on investment and their satisfaction with the risk they are taking with those resources.
Conclusion and Recommendation
China’s population structure is experiencing a change in the twenty-first century as the country’s aging population grows rapidly. Since the country’s political and economic opening, China’s economy has grown rapidly, the national economic level and household income have constantly increased, and the country’s financial market has been swiftly completed. Families’ financial asset structures definitely have a lot of room for improvement in the distribution of potentially risky financial assets. Therefore, there needs to be an investigation into the link between an aging population and risky financial asset allocation and a push for people to invest their resources through various means. The purpose of this study is to examine the relationship between the aging population and the distribution of family risk financial assets using data from the 2023 China Family Finance Survey. According to the statistics, there is an inverted U-shaped relationship between the age of the household head and the holdings of hazardous assets within a family. Household engagement in the risky financial market peaks at around 62 for the head of the household, and risky financial asset allocation peaks at around 66.
Risky financial asset accumulation has gradually decreased since then. Men’s household heads are more inclined to reduce their exposure to volatile financial or equity assets than women. Married couples invest more in volatile stocks. Family financial asset allocation shows shared risk aversion. Families with more disposable income and education spend more on risk. The breadwinner’s health affects families’ financial risk-taking. When the breadwinner is sick, the family may be less risk-taking with money. Statistics show that larger families are safer and less inclined to invest in the stock market’s volatility. Real estate ownership will also influence the financial risk associated with family assets. High household income increases financial market risk-taking. Investors can relax by using real estate as a buffer against family financial losses. The last step is to develop and produce new financial products. Financial institutions must constantly provide new goods and services to meet the needs of diverse family arrangements.
Financial institutions should prioritize research on customer wants and needs, develop tailored financial services for various family types, enhance customer satisfaction, and promote economic growth, especially considering the current trend toward a more diverse and aging population. Geriatric asset accumulation and financial management requirements are rising in tandem with their expanding population. In order to more effectively serve senior citizens, financial institutions could anticipate their requirements and preferences through demographic studies. To examine whether factors such as techno-nationalism, enforcement intensity, and the price of renewable energy sources affect correlations, future academic studies should include these variables. There is a continual demand for innovative products and services from financial institutions to accommodate the various types of family structures. Given the current trend toward a more diverse and aging population, financial institutions should prioritize research on customer wants and needs, develop tailored financial services for various family structures, enhance customer satisfaction, and promote economic growth. With their growing population, geriatric asset accumulation and financial management needs are rising. Future research could examine how our findings apply to recent events. If implemented, it would show how much China affects global economic issues like population aging, financial asset allocation, and risk.
Footnotes
Appendix A
China’s family financial assets allocation structure.

| Year | Cash | Deposit money | Sock price | Funds | Insurance |
|---|---|---|---|---|---|
| 2000 | 16.04 | 88.08 | 13.21 | 0.46 | 2.18 |
| 2001 | 15.43 | 90.71 | 10.67 | 0.59 | 2.59 |
| 2002 | 14.78 | 92.98 | 8.02 | 0.85 | 3.37 |
| 2003 | 14.34 | 94.08 | 7.18 | 0.88 | 3.53 |
| 2004 | 13.74 | 95.62 | 5.60 | 8.40 | 3.58 |
| 2005 | 13.25 | 97.03 | 4.39 | 1.94 | 3.38 |
| 2006 | 12.52 | 93.40 | 8.68 | 2.16 | 3.26 |
| 2007 | 10.68 | 75.80 | 24.54 | 5.89 | 3.10 |
| 2008 | 11.04 | 87.85 | 10.94 | 6.23 | 3.95 |
| 2009 | 8.98 | 76.45 | 26.60 | 4.70 | 3.26 |
| 2010 | 8.86 | 75.20 | 28.74 | 3.84 | 3.60 |
| 2011 | 9.32 | 81.01 | 22.72 | 3.65 | 3.29 |
| 2012 | 8.77 | 82.46 | 21.85 | 3.82 | 3.11 |
| 2013 | 8.65 | 83.70 | 21.46 | 3.35 | 3.08 |
| 2014 | 7.31 | 77.11 | 28.69 | 3.82 | 3.07 |
| 2015 | 6.58 | 71.72 | 32.57 | 5.98 | 3.16 |
| 2016 | 6.71 | 74.04 | 28.96 | 6.50 | 3.79 |
| 2017 | 6.29 | 72.28 | 30.00 | 7.36 | 4.07 |
| 2018 | 6.35 | 78.17 | 22.99 | 8.38 | 4.12 |
| 2019 | 5.72 | 75.86 | 26.87 | 7.61 | 3.95 |
| 2020 | 5.33 | 73.00 | 30.22 | 7.98 | 3.54 |
| 2021 | 5.04 | 71.53 | 31.25 | 9.07 | 3.11 |
| 2022 | 6.78 | 74.87 | 34.54 | 9.78 | 3.89 |
| 2023 | 7.23 | 79.43 | 37.87 | 10.56 | 4.23 |
Source. China planning yearbook 2022.
Note. Unit (%).
Ethical Considerations
This study did not require ethical approval. The research is based on the analysis of publicly available, aggregated, and anonymized secondary data from official sources. The study did not involve any direct interaction with human participants, human subjects, or identifiable private information. Therefore, no application for ethical permission was necessary.
Consent to Participate
Informed consent was not required for this study as the research was based solely on the analysis of publicly available and anonymized secondary data. The study did not involve any direct interaction with human participants, and no identifiable private information was used.
Consent for Publication
After receiving complete information about the analysis, all study participants gave their agreement.
Funding
The authors received no financial support for the research, authorship, and/or publication of this article.
Declaration of Conflicting Interests
The authors declared no potential conflicts of interest with respect to the research, authorship, and/or publication of this article.