
Abstract
This study examines the asymmetric effect of stock market uncertainty on the safe-haven status, asymmetric volatility, and contagion/flight characteristics of gold, bonds, exchange rates, crude oil, and Bitcoin during the COVID-19 pandemic in the US, Eurozone and Japan. Utilizing a quantile-based double-threshold GJR-GARCH model, we analyze how increased stock market uncertainty, indicated by high implied volatility, impacts the behavior of these assets. Our findings reveal that gold, bonds, and exchange rates exhibit safe-haven properties and inverted asymmetric volatility (where volatility spikes during market upswings due to liquidity strains, contrasting traditional leverage effects) during periods of high stock market uncertainty. In this phenomenon, volatility spikes during market upswings due to liquidity strains and surging demand as investors rush toward these assets, contrasting with traditional leverage effects where volatility rises after negative shocks. Notably, investors flee stocks toward gold and bonds during periods of high uncertainty, while contagion emerges during periods of low uncertainty due to shared investor sentiment driving correlated movements. These discoveries challenge conventional views of uniform co-movements during crises and have significant policy implications for financial regulators, policymakers, and investors alike. By understanding how safe-haven assets respond to varying levels of stock market uncertainty, policymakers can design policies to maintain market stability and prevent systemic risks. For example, measures to ensure liquidity and stability in safe-haven markets during periods of heightened uncertainty could mitigate adverse market reactions. Similarly, investors can optimize their portfolios by strategically allocating assets based on prevailing market conditions, while financial regulators can anticipate and mitigate potential market stresses.
Plain language summary
This study looks at how uncertainty in the stock market affects certain assets that are considered safe havens, like gold, bonds, exchange rates, crude oil, and Bitcoin, during the COVID-19 pandemic in the US, Eurozone, and Japan. We used a special model to analyze how high levels of uncertainty, shown by high implied volatility, change the way these assets behave. We found that when the stock market is very uncertain, gold, bonds, and exchange rates often act as safe havens. This means people tend to sell stocks and buy these assets instead because they’re seen as less risky. But interestingly, we also found that these safe-haven assets sometimes react in unexpected ways – for example, they might become more volatile when the market is very uncertain, which is the opposite of what you’d expect. We also noticed that when the stock market is less uncertain, there’s more of a connection between stocks and these safe-haven assets, which means they might move in similar ways. These findings are important for policymakers, financial regulators, and investors. For policymakers, understanding how safe-haven assets react to stock market uncertainty can help them design policies to keep the market stable and prevent big risks. For example, they might make sure there’s enough money flowing in these markets during uncertain times to prevent bad reactions. Investors can use this information to make better decisions about their investments. They can choose to put their money in different assets depending on how uncertain the market is. Financial regulators can also use these findings to predict and reduce potential stress in the market. Overall, this study helps us understand how different assets behave during uncertain times, which can help everyone make better financial decisions.
Introduction
The COVID-19 pandemic significantly impacted global financial markets, leading to heightened uncertainty and volatility. This heightened uncertainty, signaled by the rising implied volatility index (VIX), prompted investors to reallocate portfolios strategically toward assets perceived as safe havens. While previous studies have explored the correlation between market uncertainty and the performance of various safe-haven assets such as gold, bonds, and the US dollar (USD), most analyses have not accounted for the varying levels of stock market uncertainty. Boscaljon and Clark (2013) reveal that significant spikes in stock market uncertainty, indicated by the market implied volatility index (VIX), prompt investors to strategically reallocate their assets toward gold and gold-related investments. This gap necessitates a granular analysis of how discrete tiers of uncertainty influence safe-haven dynamics, setting the stage for our examination of volatility-asset correlations.
Based on this foundation, extensive research explores correlations between the VIX and traditional safe havens. Connolly et al. (2005) reveal a negative correlation between the VIX and future stock-bond relations. Thomas (2015) and Baele et al. (2020) find that safety-seeking behavior often coincides with elevated VIX levels, which the VIX can typically predict. Sarwar (2017) shows that higher VIX corresponds to increased gold price volatilities, aligning with the flight-to-safety effect. Troster et al. (2019) perform a quantile regression analysis to verify whether flights-to-safety from US equities to gold are significant under different volatility conditions. Ma et al. (2021) explore the impacts of VIX on stock-bond and stock-gold correlations and compares the effectiveness of bonds with gold hedging the stock market risk. Bouri and Jalkh (2024) investigate the predictability from the implied volatility of risky assets and find that flight-to-safety is linked with the high and median volatility regime in US equities. These studies establish the VIX as a predictor of safe-haven demand but leave unresolved how regime-specific uncertainty interacts with another key phenomenon: inverted asymmetric volatility.
This phenomenon, inverted asymmetric volatility, is critical to safe-haven behavior (Baur, 2012; Chiarella et al., 2016). Inverted asymmetric volatility describes a phenomenon where safe-haven assets exhibit higher volatility during market rallies (positive returns) than during declines. For example, during the COVID-19 market rebound in April 2020, gold prices surged amid a flight-to-safety but experienced extreme intraday swings as liquidity providers struggled to meet demand (Baur & Dimpfl, 2018). This contrasts with traditional “leverage effects,” where volatility rises after negative shocks (e.g., stock crashes). M. S. Chang et al. (2021) explore the correlation between volatility patterns and flights specifically in the gold market and find that there is a noticeable flight from stocks to gold in the highly volatile gold market, yet they overlook the potential disruption from stock market uncertainty, argued by Boscaljon and Clark (2013). Thus, prior work fragments the analysis of uncertainty regimes, asymmetric volatility, and contagion, a limitation our methodology addresses.
Despite extensive literature discussing the impact of implied volatility index on safe havens and flights to safety, prior studies inadequately considered the specific effects of different levels of stock market uncertainty on asset performance. While threshold models (e.g., TGARCH and GJR-GARCH) have been applied to volatility dynamics, our study introduces a quantile-based double-threshold GJR-GARCH regression (DT-GJR-GARCH). Our model is characterized by three main features: (1) embedding quantile-specific regressors (Baur & Lucey, 2010) within a double-threshold GJR-GARCH framework (Cochran et al., 2015) to analyze extreme downside risks at 1%, 5% and 10% critical thresholds; (2) joint estimation of asymmetric volatility, safe-haven coefficients, and crisis-driven contagion effects across uncertainty regimes, resolving prior fragmentation in threshold methodologies; and (3) interpreting regime-dependent inverted asymmetry as liquidity-induced volatility surges in safe havens during high-uncertainty rallies, contrasting with traditional leverage effects. This approach thereby captures how hedging behaviors, volatility asymmetries, and contagion patterns co-evolve with equity market uncertainty regimes during systemic crises.
We conduct a fresh empirical analysis to connect the implied volatility index, safe havens, asymmetric volatility, and contagion/flight characteristics of gold, bonds, the US dollar (USD), crude oil, and Bitcoin across the US, Eurozone, and Japan during the COVID-19 pandemic. This crisis provides a unique laboratory for financial stress analysis, as it triggered a globally synchronized shock marked by supply-chain disruptions (far exceeding the 2008 crisis in severity), demand collapses, and unprecedented policy interventions like the Fed’s $2.3 trillion stimulus. Unlike localized crises, the pandemic tested safe-haven assets amid a perfect storm of simultaneous equity sell-offs, oil price crashes, and cryptocurrency volatility, thus making it ideal for studying regime-dependent asset behavior. Our findings confirm that gold, bonds, and the USD retain their safe-haven roles during periods of high stock market uncertainty, complementing prior work by Lahiani et al. (2021) and Choudhury et al. (2022).
The empirical results further reveal an inverted asymmetric effect of lagged shocks on volatility of gold, bonds, and the USD under high stock market uncertainty. Notably, this inverted asymmetric volatility aligns with safe-haven status for all assets except crude oil, a pattern consistent with Baur’s (2012) association between inverted asymmetry and safe-haven traits. However, our study extends Baur’s (2012) framework by conditioning this effect on high stock market uncertainty regimes. By integrating asymmetric volatility and contagion dynamics into a unified quantile-based double-threshold GJR-GARCH model, we demonstrate that the safe-haven properties of these assets are regime-specific rather than universal. This methodological advancement offers nuanced insights into how investors should recalibrate their risk management strategies during extreme market stress.
The inverted asymmetry and safe haven nexus likely stems from liquidity constraints during flight-to-safety episodes. As extreme uncertainty triggers surging demand for safe-haven assets (e.g., gold, bonds), market maker inventories become overwhelmed (Baur & Dimpfl, 2018), causing asymmetric liquidity depletion. Notably, crude oil—despite exhibiting inverted asymmetric volatility—fails to qualify as a safe haven due to its strong positive correlation with equities (Al-Nassar et al., 2022). Our COVID-19 analysis confirms that stock-to-gold and stock-to-bond flights materialize exclusively under high stock market uncertainty, aligning with Baele et al.’s (2020) findings. This dynamic suggests that flight-to-safety pressures dominate liquidity conditions, inducing inverted volatility patterns in safe havens (e.g., gold volatility spikes during demand surges) when uncertainty is elevated.
Conversely, stock-gold and stock-bond contagion emerges during low stock market uncertainty, driven by homogeneous investor sentiment synchronizing asset movements. For instance, optimism may lift both equities and gold prices through correlated risk appetites. While Baele et al. (2020) emphasize flight-to-safety during volatility spikes (e.g., VIX surges), our double-threshold framework reveals a critical duality: contagion and safe-haven behaviors coexist across uncertainty regimes. This resolves prior contradictions by contextualizing co-movements within specific market conditions. Collectively, these findings underscore how the interplay between stock market uncertainty regimes shapes whether risk-off flight or sentiment-driven contagion dominates relationships between equities and traditional/alternative safe havens. Thus, our double-threshold framework reveals a critical duality: safe-haven flights dominate high uncertainty, while sentiment-led contagion prevails in low uncertainty.
While prior studies (e.g., Partalidou et al., 2016; Sharma & Karmakar, 2023; Triki & Ben Maatoug, 2021) have examined safe-haven asset dynamics during market volatility, research employing the regime-dependent GJR-GARCH model to analyze asset behavior under COVID-19 pandemic-level uncertainty remains limited. This study addresses this gap by introducing the DT-GJR-GARCH framework, which integrates multiple factors to investigate differentiated impacts of varying stock market uncertainty tiers on safe-haven asset performance. The findings offer dual practical value, guiding investors in portfolio optimization during crises and assisting regulators in risk management. By disaggregating extreme uncertainty thresholds, this research advances theoretical understanding of crisis-era asset responses while providing actionable insights for both academic and industry stakeholders.
The remainder of this paper is organized as follows. Section 2 introduces the literature review. Sections 3 and 4 describe the model and data and present the empirical results, respectively. The final section concludes with policy implications.
Literature Review
Following the introduction, we have expanded the literature review to comprehensively examine existing research on market uncertainty, safe-haven assets, asymmetric volatility, and contagion dynamics. This enhanced section establishes theoretical groundwork by analyzing how market uncertainty—a defining characteristic of financial systems—influences investor behavior and asset performance (Boscaljon & Clark, 2013). It further explores uncertainty’s role in shaping asset price volatility and correlations (Connolly et al., 2005), while investigating cross-asset contagion mechanisms through the lens of systemic risk spillovers (Thomas, 2015). This integrated analysis provides contextual support for understanding uncertainty’s multifaceted impacts on financial markets.
Regarding safe-haven assets, traditional options such as gold and bonds often perform exceptionally well during periods of increased market uncertainty. Baur and Lucey (2010) demonstrate that gold offers significant safe-haven performance during market turmoil. Similarly, government bonds are considered a crucial destination for safe-haven funds, particularly during economic recessions or heightened market uncertainty (Ilmanen, 2011).
Asymmetric volatility is another critical aspect of financial market volatility. While traditional leverage effects tie volatility to negative returns (Black, 1976), Baur (2012) documents inverted asymmetry in gold, characterized by higher volatility during rallies. This anomaly is theorized to reflect liquidity constraints during safe-haven demand surges (Gromb & Vayanos, 2010). Baur and Dimpfl (2018) formalize this, showing that commodities exhibit inverted asymmetry when order flows overwhelm market depth. The GJR-GARCH model, proposed by Glosten et al. (1993), offers a robust tool for capturing this asymmetry. This model distinguishes between the effects of positive and negative news on asset price volatility, thereby providing a more accurate portrayal of the dynamic characteristics of market volatility.
Concerning contagion/safe-haven characteristics, existing research primarily focuses on risk transmission and safe-haven effects across different assets or markets. For instance, Bekaert and Harvey (2003) investigate risk contagion and safe-haven strategies between emerging and mature markets. Guidolin et al. (2019) examine risk contagion mechanisms among various assets during the financial crisis. M.-S. Chang et al. (2023) reveal that safe-haven effect generally increases with the quantiles of asset returns and find an asymmetric flight from stocks to the US dollar as well as asymmetric stock-gold, stock-bond, and stock-oil contagion. Recent threshold-GARCH models (e.g., M. S. Chang et al., 2021; Cochran et al., 2015) focus primarily on volatility spillovers or correlation shifts. However, they either fail to incorporate quantile-based tail-risk regressors to test safe-haven properties during extreme market downturns, fail to jointly estimate asymmetric volatility responses and contagion/flight dynamics within threshold regimes, or fail to link inverted asymmetry mechanistically to liquidity constraints in safe havens (e.g., demand surges overwhelming supply during flights to safety). Our DT-GJR-GARCH model bridges these gaps by unifying these dimensions, enabling a detailed analysis of how uncertainty regimes reconfigure asset interactions.
While the broader literature explores diverse uncertainty drivers (e.g., climate policy, oil prices, interest rates), our study exclusively focuses on stock market uncertainty (proxied by implied volatility indices) and its regime-dependent effects on safe-haven assets during systemic crises. For instance, Olasehinde-Williams et al. (2023) examine environmental policy shifts affecting sustainable investments, while Ali et al. (2019) employ symmetric/ asymmetric GARCH to link oil volatility to macroeconomic outcomes. Employing a novel wild bootstrap likelihood ratio approach, Olasehinde-Williams and Özkan (2022) investigate the ability of interest rate uncertainty to predict investment volatility in nine selected countries. Williams (2018) uses an ARMA (1, 2)-GARCH (1, 1)-M technique to examine the impact of volatility on BRVM stock returns in the integrated regional West African stock market. There prior studies diverge from our focus on financial market uncertainty (VIX) and flight-to-safety behavior.
However, despite the wealth of research on market uncertainty, safe-haven assets, asymmetric volatility, and contagion/safe-haven characteristics, few studies have comprehensively considered the specific impacts of varying levels of market uncertainty on asset performance. Therefore, this paper aims to fill this research gap by empirically analyzing the effects of different levels of stock market uncertainty on safe-haven asset capabilities, asymmetric volatility, and contagion/safe-haven characteristics. The findings will offer valuable insights for investors, policymakers, and financial regulators.
The Model and Data
This study introduces a quantile-based DT-GJR-GARCH model to investigate relationships among safe-haven capacity, asymmetric volatility, and flight-to-safety/contagion effects across volatility regimes. The model includes regressors for stock returns in the 1%, 5%, and 10% lower quantiles from Baur and Lucey (2010) model, and integrates the leverage term from Cochran et al.’s (2015) DT-GARCH model. Our study uses the implied volatility index as a threshold for detecting market shifts, given its role as a stock market uncertainty indicator (Birru & Young, 2022). When the implied volatility index rises, signaling higher volatility, investors move to safer investments, a common “flight-to-safety” trend. The changes in the implied volatility index act as market timing cues, helping optimize portfolios through shifts between value and growth stocks.
The proposed model is specified as follows:


with
Equations 1 and 2 represent the conditional mean and conditional variance, respectively, depending on the regime at time t. Superscripts 1 and 2 on coefficients denote regimes above/at or below the threshold level of implied volatility index (r), respectively. These constraints are imposed to ensure stationary and positive volatility. The threshold “r” is endogeneously determined. Please refer to Cochran et al. (2015) for details.
The quantile-based DT-GJR-GARCH model captures how asset dynamics shift between “high” and “low” stock market uncertainty regimes, triggered when the VIX crosses an estimated threshold r. Below is an economic interpretation of key components: A critical VIX level endogenously determined for each market (Tsay (1998) use a sup-Wald test to identify the threshold endogenously. This procedure identifies the optimal volatility level that maximizes regime separation in the conditional mean and variance equations. Thresholds are market-specific due to differences in implied volatility dynamics. Consequently, r is estimated separately for each region to capture local uncertainty regimes, see Tsay (1998 for technological details of the threshold identification procedure). Markets are in a state of high uncertainty when VIX ≥ r, and low uncertainty prevails when VIX < r. Quantile Regressors (
Following Baur and Lucey (2010) and Baur and McDermott (2010), an asset exhibits weak safe-haven properties if the sum of its quantile-specific coefficients
Unlike standard threshold-GARCH models that apply thresholds only to volatility parameters, our framework applies thresholds to both conditional mean (Equation 1) and variance (Equation 2), capturing regime shifts in returns dependence and volatility asymmetry simultaneously and embeds extreme quantile regressors directly into the mean equation to test safe-haven properties within each regime. Our model also introduces a crisis dummy interacting with stock returns to isolate COVID-19-specific contagion/flight effects conditional on uncertainty regimes.
Daily data collected includes stock indices, implied volatility indices, gold prices, bonds indices, exchange rates, WTI crude oil prices, and the Bitcoin index, covering the period from January 1, 2011, to December 30, 2023, to encompass the COVID-19 pandemic where the period of COVID-19 started from January 1st 2020 to May 5th 2023 because the COVID-19 outbreak emerged at the end of 2019 and the World Health Organization (WHO) declared the end to COVID-19 as a global health emergency on May 5th 2023. Specifically, we focus on the S&P500 composite index in the United States (US), the Dow Jones Euro Stoxx 50 in the Eurozone, and the Nikkei 225 Stock Average in Japan. Additionally, the corresponding implied volatility indices include the CBOE Volatility Index (VIX), the EURO STOXX 50 Volatility Index (VSTOXX), and the Nikkei Stock Average Volatility Index (JNIV). Gold prices are converted to local currency to reflect diverse market conditions accurately. The bond market indices examined are country-specific 10-year government bonds. Nominal exchange rates refer to the value of domestic currency per USD. Exchange rate data are collected for the Euro and Japanese Yen (JPY). For the US, we incorporate the Broad Trade-Weighted Exchange Index (TWEXB) provided by the US Federal Reserve. Additionally, we include the West Texas Intermediate (WTI) spot price for crude oil, and the Bitcoin price index, denominated in USD, sourced from www.coindesk.com. The stocks, bonds, exchange rates, gold, and crude oil data are retrieved from Datastream, while the implied volatility indices are obtained from the respective Exchange websites. The return series
Table 1 summarizes the sample statistics. Stocks, bonds, and exchange rates show average returns (absolute) exceeding their standard deviations, indicating high volatilities. Stock returns’ negative skewness suggests a risk of adverse outcomes, highlighting the importance of safe haven assets in portfolios. All asset returns demonstrate kurtosis from 4.04 to 22.63, indicating significant fat tails compared to a normal distribution.
Descriptive Statistics of Daily Stock, Bonds, Exchange Rate, and Gold Percentage Return Series and Daily Implied Volatility Indices.

Note. This table presents the description for the daily return series of stock, bonds, exchange rate, and gold prices. Panel A reports the descriptive statistics over the whole samples for each country. Panel B report the descriptive statistics before, during and after the global financial crisis for each country. “SD” denotes the standard deviation.
This study looks at how uncertainty in the stock market affects certain assets that are considered safe havens, like gold, bonds, exchange rates, crude oil, and Bitcoin, during the COVID-19 pandemic in the US, Eurozone, and Japan. We used a special model to analyze how high levels of uncertainty, shown by high implied volatility, change the way these assets behave. We found that when the stock market is very uncertain, gold, bonds, and exchange rates often act as safe havens. This means people tend to sell stocks and buy these assets instead because they’re seen as less risky. But interestingly, we also found that these safe-haven assets sometimes react in unexpected ways—for example, they might become more volatile when the market is very uncertain, which is the opposite of what you’d expect. We also noticed that when the stock market is less uncertain, there’s more of a connection between stocks and these safe-haven assets, which means they might move in similar ways. These findings are important for policymakers, financial regulators, and investors. For policymakers, understanding how safe-haven assets react to stock market uncertainty can help them design policies to keep the market stable and prevent big risks. For example, they might make sure there’s enough money flowing in these markets during uncertain times to prevent bad reactions. Investors can use this information to make better decisions about their investments. They can choose to put their money in different assets depending on how uncertain the market is. Financial regulators can also use these findings to predict and reduce potential stress in the market. Overall, this study helps us understand how different assets behave during uncertain times, which can help everyone make better financial decisions.
Empirical Analysis
Estimation Results
This section details the estimation outcomes for the volatility models across assets and regions. The analysis begins by estimating a single-regime GJR-GARCH model as a benchmark specification, followed by the double threshold DT-GJR-GARCH framework to capture regime-dependent volatility dynamics. The estimation outcomes for gold, bonds, the USD, crude oil, and Bitcoin are presented in Tables 2 to 6, respectively. Each tables showcases results specifically for the USA, Eurozone, and Japan. To mitigate potential confounding effects between flight-to-safety and contagion dynamics, we set β5 = 0 and report the baseline results accordingly. All β estimates vary considerably between high and low uncertainty regimes, validating the need to distinguish these regimes in our analysis. The asymmetric link between stock market uncertainty and equity returns is widely recognized in researches. Notably, Hibbert et al. (2008) and Whaley (2009) have demonstrated a negative and asymmetric return-volatility correlation between S&P500 returns and VIX fluctuations. These initial results establish the foundation for examining regime-specific dynamics.
Estimation Results of DT-GJR-GARCH Model for Gold During the COVID-19 Period.

Note. This table presents the estimates of the DT-GJR-GARCH regression for the daily return series of stock index, and asset prices for the considered countries. “High” and “Low” denote the high and low uncertainty states, individually. “r” denotes the threshold level of implied volatility indices. ***, **, and * denote significance at 1%, 5%, and 10%, respectively. Numbers in parentheses are standard errors. The results reveals that gold’s relationship with market drivers (β coefficients) and its volatility dynamics differ significantly between high and low uncertainty states Notably, the US shows a strong negative relationship (β1 = −.0723) during high uncertainty, while Japan exhibits a significant positive impact on extreme negative returns (β4 = .3757) in its high-volatility regime.
Model:
Estimation Results of DT-GJR-GARCH Model for Bonds During the COVID-19 Period.

Note. This table presents the estimates of the DT-GJR-GARCH regression for the daily return series of stock index, and asset prices for the considered countries. “High” and “Low” denote the high and low uncertainty states, individually. “r” denotes the threshold level of implied volatility indices. ***, **, and * denote significance at 1%, 5%, and 10%, respectively. Numbers in parentheses are standard errors. The results shows bond return sensitivities (β coefficients) and volatility processes shift markedly between high and low uncertainty states. The US exhibits a strong negative relationship with the primary driver (β1 = −.0367) only during high uncertainty, contrasting with insignificant effects in the low state. Model: Please refer to the footnote in Table 2.
Estimation Results of DT-GJR-GARCH Model for Exchange Rates During the COVID-19 Period.

Note. This table presents the estimates of the DT-GJR-GARCH regression for the daily return series of stock index, and asset prices for the considered countries. “High” and “Low” denote the high and low uncertainty states, individually. “r” denotes the threshold level of implied volatility indices. ***, **, and * denote significance at 1%, 5%, and 10%, respectively. Numbers in parentheses are standard errors. DT-DT-GJR-GARCH estimates for exchange rates during COVID-19 show distinct parameter shifts between high and low uncertainty regimes. High uncertainty states amplify asymmetric effects (USA) and alter extreme return impact (e.g., Eurozone, β4 ) Model: Please refer to the footnote in Table 2.
Estimation Results of DT-GJR-GARCH Model for Crude Oil During the COVID-19 Period.

Note. This table presents the estimates of the DT-GJR-GARCH regression for the daily return series of stock index, and asset prices for the considered countries. “High” and “Low” denote the high and low uncertainty states, individually. “r” denotes the threshold level of implied volatility indices. ***, **, and * denote significance at 1%, 5%, and 10%, respectively. Numbers in parentheses are standard errors. DT-GJR-GARCH results reveal dramatic shifts in parameter estimates between high/low uncertainty states, especially for the extreme returns impact. Mean equation coefficients (β1–β4 ) collapse in magnitude and significance under DT regimes compared to values of baseline model.
Model: Please refer to the footnote in Table 2.
Estimation Results of DT-GJR-GARCH Model for Bitcoin During the COVID-19 Period.

Note. This table presents the estimates of the DT-GJR-GARCH regression for the daily return series of stock index, and asset prices for the considered countries. “High” and “Low” denote the high and low uncertainty states, individually. “r” denotes the threshold level of implied volatility indices. ***, **, and * denote significance at 1%, 5%, and 10%, respectively. Numbers in parentheses are standard errors. Key parameters shift significantly between high/low uncertainty states. Persistence (ν) decreases during high uncertainty. Asymmetry (γ) is significant only in high uncertainty for Japan. Thresholds (r) define distinct uncertainty regimes per region (USA, Eurozone, Japan).
Model: Please refer to the footnote in Table 2.
The estimates reveal significant regime dependence. Excluding Bitcoin, the
Safe-Haven Analysis
In terms of the correlation results, we now evaluate safe-haven properties across regimes. The safe-haven estimations are presented in the first row of Panels A, B, C, D, and E of Table 7, respectively. As indicated in Tables 2 to 6, the estimated safe-haven effect ranges from −0.146 to 8.551 for the USA, −0.009 to 7.145 for the Eurozone, and −0.041 to 10.246 for Japan in the benchmark GJR-GARCH model. Specifically, across all the considered countries, gold, crude oil, and Bitcoin do not function as safe havens against stock market downturns, whereas the USD consistently fulfills this role. This benchmark finding necessitates a deeper regime-specific analysis (Table 7).
Estimation Results of Safe Haven and Signs of Leverage Coefficient During the COVID-19 Period.
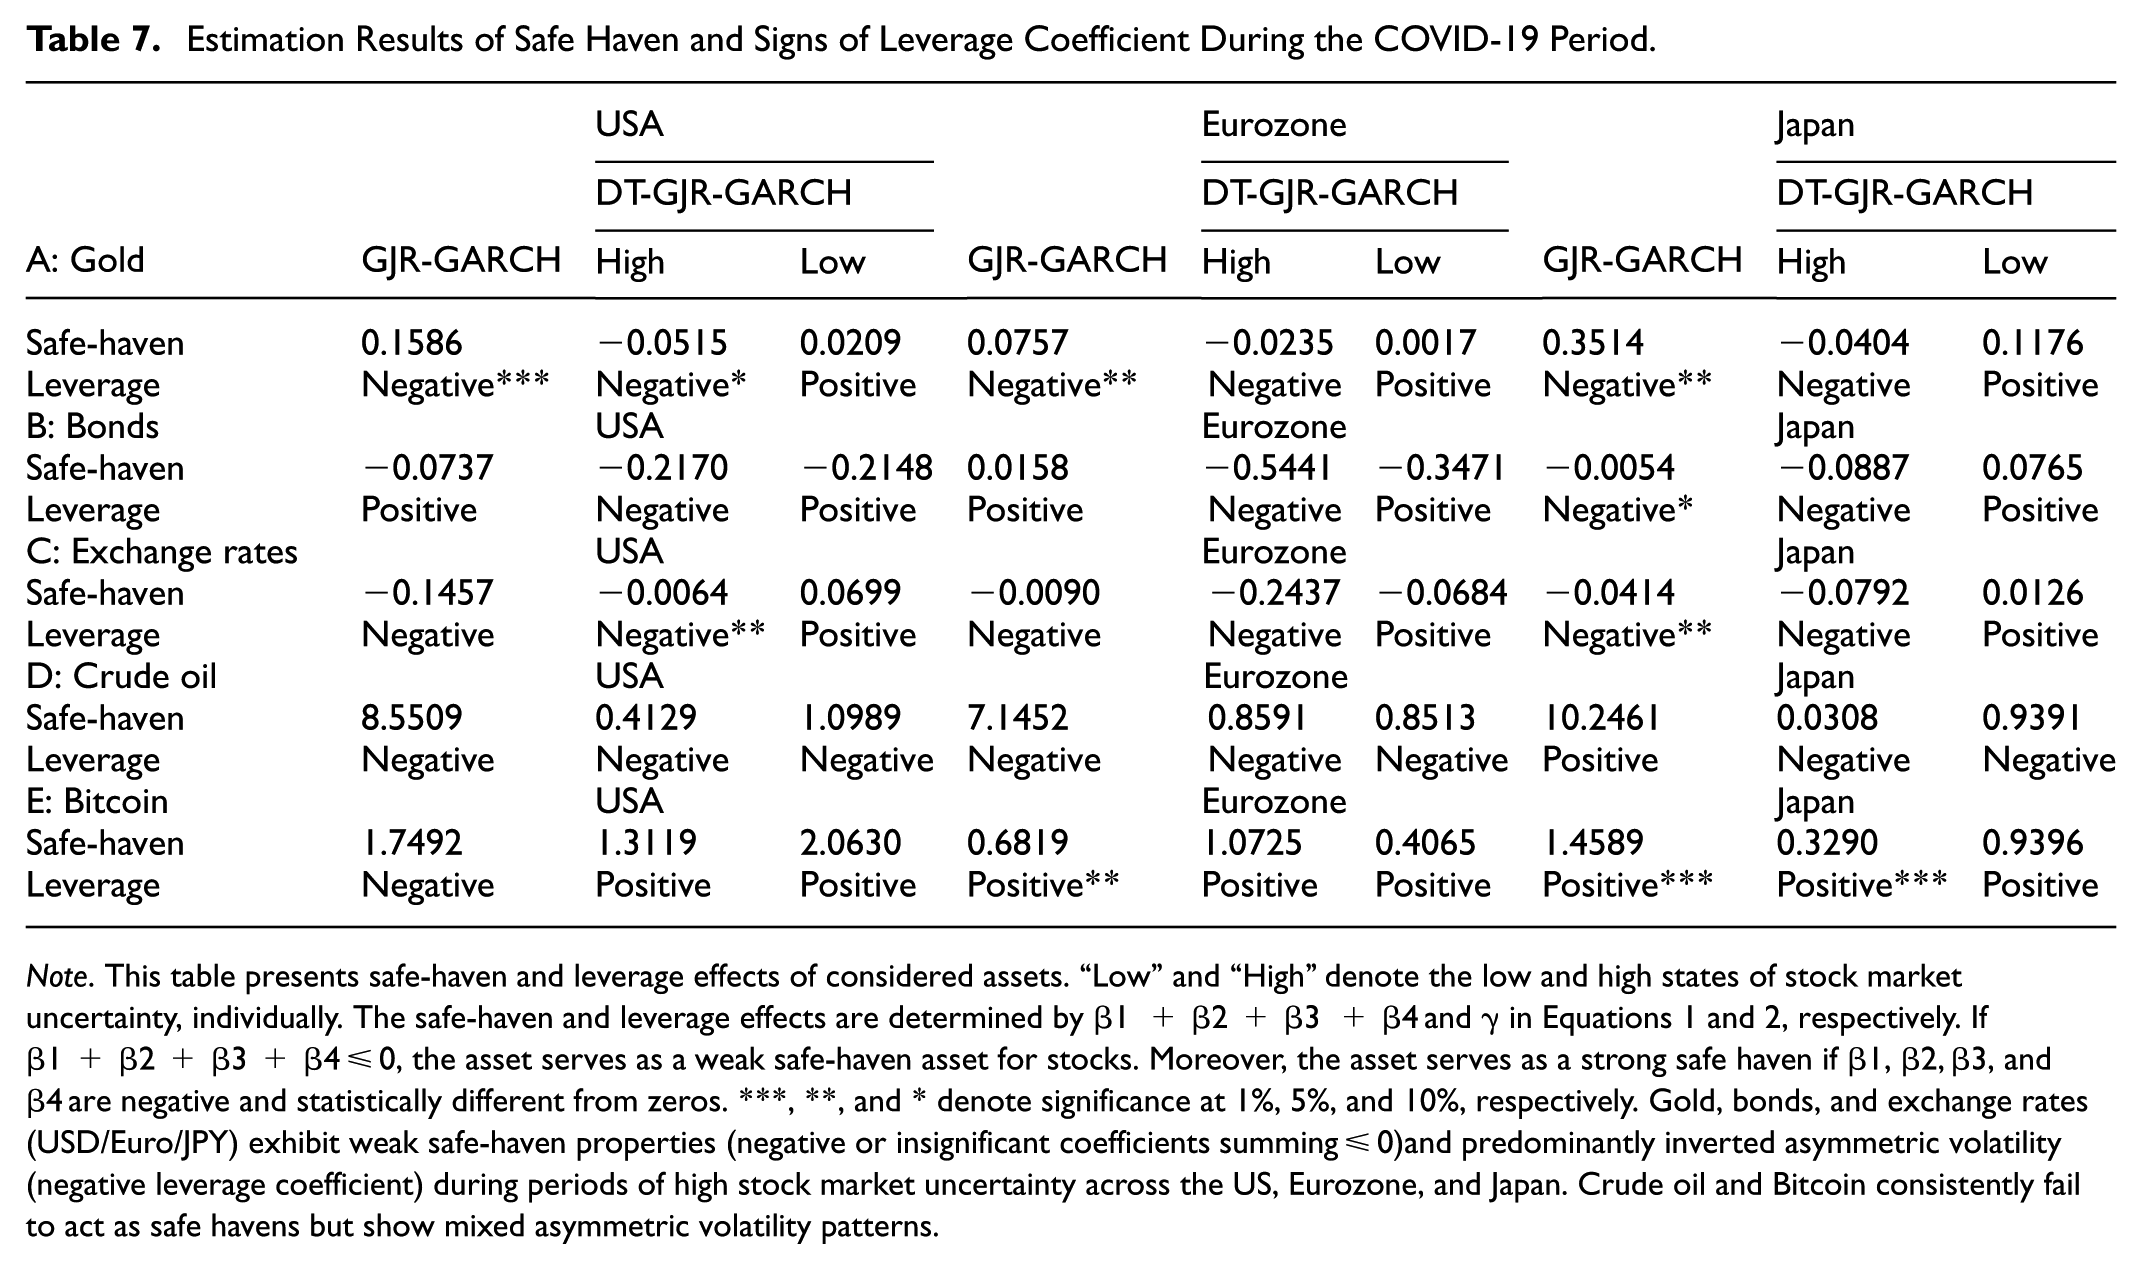
Note. This table presents safe-haven and leverage effects of considered assets. “Low” and “High” denote the low and high states of stock market uncertainty, individually. The safe-haven and leverage effects are determined by β1 + β2 + β3 + β4 and γ in Equations 1 and 2, respectively. If β1 + β2 + β3 + β4 ≤ 0, the asset serves as a weak safe-haven asset for stocks. Moreover, the asset serves as a strong safe haven if β1, β2, β3, and β4 are negative and statistically different from zeros. ***, **, and * denote significance at 1%, 5%, and 10%, respectively. Gold, bonds, and exchange rates (USD/Euro/JPY) exhibit weak safe-haven properties (negative or insignificant coefficients summing ≤ 0)and predominantly inverted asymmetric volatility (negative leverage coefficient) during periods of high stock market uncertainty across the US, Eurozone, and Japan. Crude oil and Bitcoin consistently fail to act as safe havens but show mixed asymmetric volatility patterns.
Summary of Contagion and Flights During the COVID-19 Period.

Note. This table summarizes contagion/flights. “Low” and “High” denote the low and high regimes of stock market uncertainty, individually. According to Baur and Lucey (2009), a flight from stocks to an alternative asset is identified if β5 < 0 and β1 + β5 < 0, while a stock-alternative asset contagion is confirmed if β5 > 0 and β1 + β5 > 0. If β5 < 0 and β1 + β5 > 0, stocks and the alternative asset decouple compared to a benchmark level. High uncertainty regimes consistently trigger flights from stocks to traditional safe havens (gold and bonds) across all regions (US, Eurozone, Japan), while low uncertainty regimes exhibit contagion between stocks and these assets.
Model:
Our DT-GJR-GARCH model reveals nuanced safe-haven behavior during high uncertainty. Our findings indicate that gold acts as a weak safe haven (not all β coefficients significant and negative but the sum of β≤ 0) for stocks during the COVID-19 period, specifically in high uncertainty stocks regimes. For example, in the US high-uncertainty regime, gold’s β estimates range from −0.1948 to 0.1659. and the sum of β is −0.0515. This finding aligns with Chemkha et al. (2021) and Choudhury et al. (2022), which highlights gold’s diversification benefits during periods of elevated stock market volatility. Similarly, bonds and the USD exhibit weak safe-haven characteristics in high uncertainty regimes, consistent with the capital preservation function of bonds and the USD’s role as a traditional safe haven (Choudhury et al., 2022). Conversely, in low-uncertainty regimes, these assets show either weak (sum of β≤ 0) or insignificant safe-haven properties. This regime-contingent behavior points to a flight-to-safety mechanism.
The observed safe-haven effects align with established financial behavior. These results suggest that during periods of high stock market uncertainty, the increasing prices of these assets (gold, bonds and the USD) tend to compensate for losses sustained through stock investments. The flight-to-safety hypothesis, as postulated by Caballero and Krishnamurthy (2008), likely underlies the safe-haven effects observed in extreme market conditions. Conversely, our data reveals that crude oil and Bitcoin do not function as safe havens during the COVID-19 pandemic (Chemkha et al., 2021). To further validate the safe-haven property of gold during the high uncertainty period of the COVID-19 pandemic, we examine the daily conditional correlations between gold and the S&P500 in the US for the year 2020. Figure 1 plots these conditional correlations under various uncertainty regimes. We observe that during the high uncertainty periods (when VIX is above the estimated threshold r), the conditional correlations are predominantly negative, indicating that gold tended to move inversely to stocks. This is consistent with the safe-haven property. In contrast, during low uncertainty periods (VIX below r), the correlations are more often positive, aligning with our finding of contagion in low uncertainty regimes. Having established safe-haven properties, we next explore asymmetric volatility dynamics.

Conditional correlation between gold and S&P 500 in 2000.
Results of Asymmetric Volatility Analysis
This section explores how negative shocks affect asset volatility differently based on stock market uncertainty levels. In the standard GJR-GARCH model, the estimates of the asymmetry parameter (γ), presented in the second row of Table 7, for both gold returns and the USD exchange rate are consistently negative during the COVID-19 pandemic, suggesting an inverse asymmetry in these markets. In contrast, our findings reveal that during periods of high stock market uncertainty, the DT GJR-GARCH model predominantly demonstrates negative
The asymmetric volatility state is contingent on the uncertainty regime. When uncertainty is low, gold, bonds, and the USD transition into a state of asymmetric volatility (positive γ). This demonstrates how stock market uncertainty governs an asset’s volatility asymmetry, a nuance missed by past studies not accounting for different levels. Past studies missed this by not accounting for different uncertainty levels. Note that the inverted asymmetric volatility is found in crude oil. The possible reason is the high positive correlation between crude oil and stocks, in line with Al-Nassar et al. (2022). Understanding these volatility patterns helps interpret contagion and flight phenomena.
Contagion and Flights
We now investigate contagion and flight-to-safety by statistically comparing dependence structures between regimes. Referring to Baur and Lucey’s (2009) criteria, a flight is determined when
The DT-GJR-GARCH estimation reveals contrasting dynamics across regimes. In high stock market uncertainty, flights from stocks to gold and bonds are confirmed, while stocks decouple from crude oil. In contrast, low stock market uncertainty sees contagion between stocks-gold, stocks-bonds, stocks-oil, and stocks-Bitcoins pairs. The contagion may originate from investor sentiment. When stock market uncertainty is low, investors are optimistic, pushing up stock prices. This optimism often affects the alternative market too, leading to rising market prices. Thus, changes in investor sentiment can strongly influence the interconnectedness of the alternative and stock markets and lead to contagion. These findings on dependence structures culminate in a summary integrating safe-haven, volatility, and contagion results.
Summary of Safe-Haven, Asymmetric Volatility and Contagion and Flights Analyses
The results show that asset properties like safe-haven status, asymmetric volatility, and contagion/flight vary based on stock market uncertainty levels. Thus, it’s prudent to take these states of uncertainty into account during discussions.
During the high stock market uncertainty, gold and bonds exhibit similar properties during COVID-19 period. Gold and bonds are recognized as safe-haven assets, exhibiting inverted asymmetric volatility as well as flight from stocks. Crude oil and Bitcoin have different properties from bonds and the USD in times of the high stock market uncertainty. In general, crude oil and Bitcoin can not act as safe-haven assets. Meanwhile, decoupling and contagion effects with stocks are observed. However, crude oil demonstrates inverted asymmetric volatility. This discovery suggests that safe-haven characteristics do not necessarily coexist with inverted asymmetric volatility.
The inverted asymmetric volatility found in this study suggests that under extreme market uncertainty, safe-haven assets may exhibit volatility characteristics different from traditional assets, which may be related to factors such as a sharp decline in investor risk appetite. The contagion effects observed during periods of low uncertainty remind us that the safe-haven function of assets is not absolute, and their relationship with the stock market dynamically adjusts with changing stock market conditions.
During high uncertainty, safe havens like gold/bonds exhibit inverted asymmetric volatility due to one-sided demand shocks. For example, market makers struggle to absorb inflows into gold/bonds, amplifying price surges (and volatility) during rallies (Baur & Dimpfl, 2018). This contrasts with traditional assets, where bad news increases volatility, that is, leverage effect. In low uncertainty, contagion between stocks and safe havens may arise from sentiment synchronization. For example, bullish sentiment may lift all assets, weakening safe-haven decoupling (Baker & Wurgler, 2006). This may explain why co-movements strengthen in low-stress regimes, opposing the volatility spillover narrative but aligning with behavioral theories, explains the regime-specific dynamics we document.
In summary, while the regular GJR-GARCH model reveals contagion between stocks and gold, it is evident that flights may occur in these scenarios when the stock market encounters high uncertainty. The benefits of incorporating market uncertainty regimes into a flights/contagion analysis become apparent through the contrasting results obtained from the regular GJR-GARCH and DT-GJR-GARCH models. The proposed model uncovers a connection between safe-haven effects, (inverted) asymmetric volatility, and contagion/flights based on different market uncertainty regimes
Robustness Analysis
To assess the robustness of our findings, we extend the DT-GJR-GARCH framework by incorporating lagged equity returns across extreme quantiles (1%, 5%, 10%) as additional regressors (Equations 3–4). This tests whether the interplay between contemporaneous and lagged market returns systematically biases our baseline estimates of safe-haven effects, asymmetric volatility, and contagion dynamics.
For instance, the augmented DT-GJR-GARCH model is presented below.


with
The results reported in Table 9 demonstrate that the signs, magnitudes, and statistical significance of the contemporaneous quantile coefficients for all assets in high-uncertainty regimes remain virtually unchanged. This confirms that safe-haven effects are driven by contemporaneous market stress. The regime-dependent asymmetry parameter (γ) retains its sign and significance. The stability of γ estimates underscores that liquidity-driven volatility surges (Baur & Dimpfl, 2018) are instantaneous responses to uncertainty shocks. This stability of core coefficients demonstrates that the core findings of the baseline model are robust to the inclusion of lagged equity returns.
Estimation Results of Safe Haven and Signs of Leverage Coefficient in the Augmented DT-GARCH Model.

Note. This table presents safe-haven and leverage effects of considered assets for five countries. “L.V.” and “H.V.” denote the low and high states of implied volatility, individually. The safe-haven and leverage effects are determined by β1 + β2 +β3 + β4 and γ in Equations 3 and 4, respectively. If β1 + β2 + β3 + β4 ≤ 0, the asset serves as a weak safe-haven asset for stocks. Moreover, the asset serves as a strong safe haven if β1, β2, β3, and β4 are negative and statistically different from zeros.
Conclusion
This study employs a quantile-based double threshold GJR-GARCH model to deeply explore the impact of stock market uncertainty on the safe-haven attributes, asymmetric volatility, and contagion/flights characteristics of assets such as gold, bonds, the US dollar, crude oil, and Bitcoin during the COVID-19 pandemic. The findings reveal that under high stock market uncertainty, gold, bonds, and the US dollar exhibit significant safe-haven functions and demonstrate inverse asymmetric volatility, indicating investors’ tendency to shift funds from the stock market to these assets during such periods. Furthermore, this study uncovers the asymmetric effects of market uncertainty on the correlations and volatilities among assets. For example, in periods of low stock market uncertainty, gold and bonds may exhibit contagion effects with the stock market, potentially influenced by investor sentiment.
These results underscore the importance of considering market uncertainty when assessing financial assets as potential safe havens against stocks. For investors, our study provides valuable insights into the behavior of safe-haven assets during periods of stock market uncertainty. By understanding how gold, bonds, currencies, and other assets respond to such uncertainty, investors can make more informed decisions about portfolio allocation. For example, our findings suggest that certain assets, such as gold and bonds, may offer protection against stock market volatility. Investors can use this knowledge to hedge their portfolios and reduce risk. For policymakers, the study highlights the importance of monitoring and understanding the interactions between stock market uncertainty and safe-haven assets. This understanding can inform policy decisions aimed at maintaining market stability and preventing systemic risk. For example, if policymakers observe a significant shift in investor preferences toward safe-haven assets, they may consider implementing measures to ensure the liquidity and stability of these markets, for example, the Primary Market Corporate Credit Facility (PMCCF) created by the Fed to buy corporate bonds to ensure corporations could obtain credit. Financial regulators can also benefit from our findings. By understanding how investors respond to stock market uncertainty, regulators can better anticipate potential market stresses and take proactive measures to mitigate risks. This could include setting appropriate capital requirements for financial institutions or establishing circuit breakers to prevent excessive market volatility, for example, Switzerland’s CHF/EUR floor policy to stabilize capital flows during taper tantrums. Additionally, our findings have implications for market makers and exchanges. Understanding the demand for safe-haven assets during uncertain times can help these stakeholders manage liquidity and pricing risks more effectively.
Although this study has conducted in-depth analyses of multiple markets, future research can further expand into the cryptocurrency market or other crisis events to gain a more comprehensive understanding of the behavioral characteristics of safe-haven assets under different market environments. While our findings apply to major developed economies, emerging markets may exhibit distinct dynamics. For instance, emerging markets often face currency depreciation during crises, potentially weakening USD’s safe-haven role. Meanwhile, some countries impose capital controls that may influence the performance of safe haven assets. For example, China’s capital control restrictions may dampen flight-to-safety effects. Future larger and more diverse sample, including emerging markets, could provide a more comprehensive understanding of safe-haven asset behavior under stock market uncertainty.
Footnotes
Acknowledgements
We thank the assistance of students from Putian University.
Ethical Considerations
No ethics statement is needed.
Funding
The authors received no financial support for the research, authorship, and/or publication of this article.
Declaration of Conflicting Interests
The authors declared no potential conflicts of interest with respect to the research, authorship, and/or publication of this article.
Data Availability Statement
Data sharing not applicable to this article as no datasets were generated or analyzed during the current study.