
Abstract
We examine whether gold and China’s government bonds are safe-haven assets against the turbulence of the Shanghai Stock Exchange Composite Index by employing vine copula models during the 2003 to 2015 period. We find that either bonds or gold can be a weak safe haven but only gold can be a strong safe haven. Our simultaneous analysis advises against a joint safe-haven strategy of gold and bonds, given the high- to low-tail correlation. This result highlights an investment strategy of using a single safe-haven asset against the Chinese stock market turbulences.
Introduction
Extreme market conditions have reminded investors of the essentialness of risk management. The recent extreme events highlight the demand for tools to hedge the risk related to extremely severe market conditions. Based on Baur and Lucey (2010) and Baur and McDermott (2010), an asset is considered a safe haven when it is unrelated or negatively related to another asset during market turmoil. In this study, we follow their definition to clearly distinguish the role of safe-haven assets.
Conventional wisdom holds that assets such as government bonds and gold are safe havens in bad times in the United States and the European Union (e.g., Baur & Lucey, 2010; Baur & McDermott, 2010; Connolly et al., 2005; Longstaff, 2004). However, there is no consensus about the safe-haven role of these assets in China. Dee et al. (2013) revealed that gold was not a safe haven in China’s capital markets but Gürgün and Unalmis (2014), Arouri et al. (2015), and Beckmann et al. (2018) demonstrated that gold performed as a weak safe haven for Chinese stock markets. So far, most studies have only examined the pairwise correlation between stocks and the selected safe-haven asset. To the best of our knowledge, no extant studies have simultaneously considered the extreme dependence among multiple safe-haven assets with respect to the Chinese stock market.
Many skewed/fat-tailed distributions were suggested to interpret the dynamic nature of asset returns (Kollo & Pettere, 2010). Copula functions with skewed/fat-tailed distribution are widely suggested in finance, particularly in the field of risk management (Azzalini & Capitanio, 2003; Christoffersen & Langlois, 2013). However, few models allowed for a thin-tailed distribution. We suggest a multivariate extended skew-t (MEST) copula model (Arellano-Valle & Genton, 2010; Liu et al., 2016), extended to a vine copula construction to examine the joint tail dependence and multivariate tail dependence among the Shanghai Stock Exchange Composite Index, government bonds, and gold for the 2003 to 2015 period. Although past studies, for example, H. G. Min et al. (2016), suggested the U.S. dollar is able to be a safe-haven asset for stocks, the U.S. dollar is not included in our study owing to foreign exchange controls in China.
Empirically, we examine the potential of a safe-haven combination of stocks–bonds–gold from an investor’s perspective. Most prior studies simply combined these data without considering whether investment strategies implied by the study results could be obtained by domestic investors. Empirically, we find that the MEST copula accommodates strong asymmetric tail dependencies among assets. The significant estimates of the shape and extension parameters in the MEST copula indicate the presence of skewed and heavy/thin tails in most Chinese capital markets.
First, we consider only one safe-haven asset in the portfolio and find that government bonds serve, at best, as a weak safe-haven asset against stock market downturns. However, we find that gold may serve as a strong safe-haven asset under extreme conditions.
Next, we allow a portfolio to include multiple safe-haven assets to verify whether this provides better portfolio diversification. We take two steps to test the portfolio strategy of jointly or independently safe-haven assets. First, we employ the multivariate model to test whether bonds (gold) acts as a strong safe-haven asset when gold (bonds) is in extreme (good or bad) market conditions. By examining the unconditional and conditional joint lower tailed probabilities of stocks, bonds, and gold, we conclude that neither bonds nor gold can be a reliable safe haven; their effectiveness as a safe-haven asset depends on the alternative investment. Second, we apply the vine copula method to estimate the multivariate lower tailed dependence coefficient. The results show that the estimated lower tailed dependence coefficient of the combination of all three assets is larger than that of bonds–stocks and that of gold–stocks, implying that a portfolio including multiple safe havens does not dominate that including a single safe haven.
This study proceeds as follows. Sections “Literature Review” and “The Model” provide the literature review and the model. In the “Empirical Analysis” section, we present the empirical analysis. Section “Concluding Remarks” concludes.
Literature Review
Safe-Haven Effect of Government Bonds and Gold
Both long-term government bonds and gold have been continuously used by international investors to protect from stock market losses and other macroeconomic variables. The long-term government bond is an obvious choice as a safe-haven asset, in that, it offers fixed returns if held to maturity. In contrast, gold has been considered the best asset for long-run investment. (Saad, 2012). The role of gold and bond in investors’ portfolios has been examined in different ways. In this section, we first review existing literature on the safe-haven effects of gold and bonds on stock markets.
A natural candidate for a safe-haven asset against the stock market is the long-term government bond, which shows a negative correlation with stock returns and is considered to have no default risk (Baur & McDermott, 2013; Connolly et al., 2005; Longstaff, 2004). During stock market turbulence, the demand for government-backed assets surges as their liquidity function is supported by governments (Ilmanen, 2003; Kim et al., 2006). Barsky (1989) concluded that comovements of stock and bond markets are state dependent. Fleming et al. (1998) demonstrated that strong linkages exist across stock, bond, and money markets, particularly in terms of volatility spillovers. Piplack and Straetmans (2010) showed that U.S. Treasury bonds are negatively correlated with financial assets in times of market turbulences. Baur (2010) analyzed stock–bond comovements and their relationship to cross-country linkages, and found that the flight from stocks to bonds and cross-country stock market contagions happen simultaneously.
Whether gold is a safe-haven asset is a debatable question in the literature. For instance, Baur and Lucey (2010) showed that gold is a safe haven only in the very short term; Ciner et al. (2013) found that gold consistently acts as a safe haven during market crashes. Baur and McDermott (2010) found that gold is a safe-haven asset for major European the U.S. stock markets but not for Australian, Canadian, and Japanese markets. Dee et al. (2013) revealed that gold is not a safe haven when investors face stock risk in China’s capital market. Gürgün and Unalmis (2014) demonstrated that gold performs as a weak safe haven in Chinese stock markets for domestic investors. When considering the recent global financial crisis, Arouri et al. (2015) found that the gold asset serves as a safe haven for stocks in China. Moreover, Lucey and Li (2015) found that gold is not the strongest safe-haven asset in the United States. However, most studies examine the marginal effects of gold index on stock index on the basis of the coefficients from univariate or multivariate regressions. However, the results obtained from linear regressions may not completely explain extreme comovements among markets. Therefore, we attempt to use innovative econometric tools to fill this gap by considering the performance of jointly using government bonds and gold as safe havens against stocks.
Review of Nonnormal Copula Function in Financial Application
Multivariate symmetric distributions have emerged in the literature in the recent two decades (Fang et al., 1990). Nevertheless, symmetric distributions cannot capture some features of financial data, such as the skewness of returns. In many cases, assuming asymmetric distributions is more appropriate for representing financial returns (Campbell et al., 1997).
A number of papers incorporate skewed tails in the development of multivariate distributions. For instance, Sahu et al. (2003) centered on skewness properties of multivariate symmetric distributions, whereas Azzalini and Capitanio (2003) studied how to generate a family of nonsymmetric multivariate densities. Arellano-Valle and Genton (2010) proposed the MEST distribution to take into account the asymmetric and heavy/thin-tailed properties. For the relevant development of these distributions in financial studies, see Adcock (2010) and Liu et al. (2016).
In the recent two decades, more studies have begun to construct asymmetric copulas to support financial data. For instance, Demarta and McNeil (2005) suggested a skew-t copula in terms of a Gaussian mixture representation. Kollo and Pettere (2010) proposed a multivariate skew-t copula, whereas Smith et al. (2012) established skew-t copulas. Christoffersen et al. (2012) proposed a dynamic asymmetric copula model to describe not only long-term but also short-term dynamic correlation. Christoffersen and Langlois (2013) established a four-factor Capital Asset Pricing Model (CAPM) by applying a dynamic asymmetric copula. González-Pedraz et al. (2015) proposed a conditional skew-t copula to model returns. However, these models can only account for asymmetry and fat tails in dependence; they are not flexible enough to accommodate various types of distributions and tail properties.
The Model
Vine Copula Structure
Most existing papers on vine copulas use conventional copula functions, for example, Aas et al (2009), Mendes et al. (2010), and Low et al. (2013), which fail to capture either skewed tails or heavy/thin tails. Liu et al. (2016) construct a multivariate copula model based on Arellano-Valle and Genton (2010) to deal with both skewness and heavy/thin-tail properties, called the MEST copula. It comprises three kinds of parameters to control the degree of freedom, skewness, and heavy/thin-tail property. Owing to its flexibility, we use the bivariate extended skew-t (BEST) copula for the estimation of each pair copula.
Although an R-vine model provides maximum flexibility, this study only considers the most common vine structures, D-vine, as our study only includes three assets (Chollete et al., 2009; Fischer et al., 2009; Mendes et al., 2010; A. Min & Czado, 2010). Let
BEST Copula
Suppose

where
In Equation 1,
where
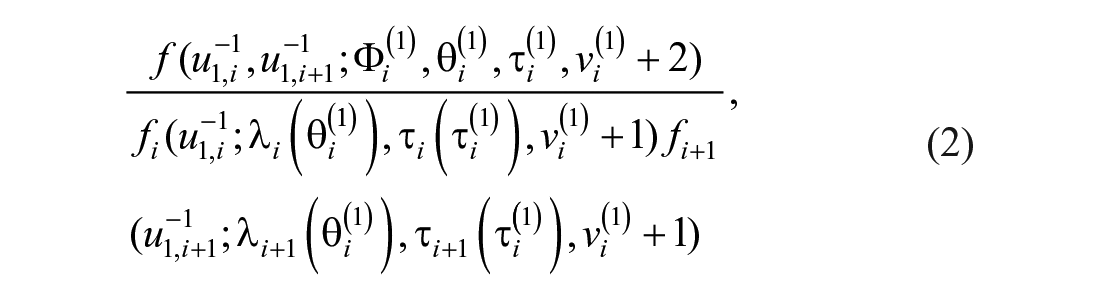
Equation 2 gives the unconditional BEST copula densities for each pair in the first tree in a D-vine model. The BEST copula functions in the first tree involve the unconditional marginal distribution functions of each variable. However, in the higher tree, the BEST copula functions involve the conditional distribution functions. For example,

where
When the degree of freedom goes to infinity and one, a BEST distribution reduces to a bivariate skewed normal distribution and the bivariate skewed Cauchy distribution, respectively.
Multivariate Lower Tail Dependence Function of a D-Vine Mode
Liu et al. (2016) gives the lower tail dependence function of the BEST copula model, which takes the form:

where

Chang et al. (2019) show the trivariate lower tail dependence, function which is
Empirical Analysis
Data
Daily data on the Shanghai Stock Exchange Composite stock market index, Shanghai Stock Exchange government bond index, and gold prices are collected from March 04, 2003, to May 29, 2015. The price of gold is measured in Chinese yuan per troy ounce. The return series are constructed by using the log-difference of the asset prices. The paths followed by the stock market returns, government bond returns, and gold returns are depicted in Figure 1. During the 2008 to 2009 crisis period, gold returns are clearly negatively correlated with stock returns, but bond returns are not, implying gold may act as a stronger safe haven than government bonds.

Stock, bond, and gold returns.
Table 1 provides summary statistics. The averages (in absolute values) are larger than the standard deviations, indicating relatively low volatilities. The returns for all assets are skewed to the left, suggesting the possibility of extremely bad outcomes. All return series also showed excessive kurtosis, ranging from 7.46 to 33.22, denoting heavy tails comparing with the normal distribution. The large values from the Jarque–Bera test strongly reject the assumption of normality of all series distributions.
Descriptive Statistics of Stock, Bond, and Gold Return Series.

Note. This table presents the description for the daily return series of China Shanghai stock market index, 10-year government bond, and gold prices. “SD” and “J-B test” denote the standard deviation and the Jarque–Bera normality test, respectively. “Pearson” denotes the Pearson’s correlation and the partial correlation, respectively. “ADF” and “PP” denote the augmented Dickey–Fuller and Phillips–Perron unit root tests.
Significance at 1%.
We conduct the augmented Dickey–Fuller (ADF) and Phillips–Perron (PP) unit root tests for the considered returns. The results indicate that the nonstationary hypothesis is rejected at 1% significance level, which means that all considered returns are stationary.
Estimation Procedure
This article applies the canonical maximum likelihood to estimate the MEST copula model. The procedures are presented as follows:
First, we fit each return series with two different models, an AR(p)-GARCH model and an AR(p)-GJR model, in terms of the quasi-maximum likelihood estimator. We select the optimal order of lag and the choice between GARCH and GJR in terms of the Bayesian information criterion.
Based on the residuals and the associated standardized residuals, we can estimate the parameters
Estimation of Marginal Distribution and MEST Copula Model
Table 2 lists the results of the marginal density estimations. The slope parameters are generally significant at 5% significance levels. To check the specification of selected models, we use the Q and Lagrange multiplier (LM) tests for serial correlation and autoregressive conditional heteroscedasticity. The Q and LM values fail to reject the null hypothesis both of no serial correlation and of no conditional heteroscedasticity in the residuals at the 5% level.
Estimation Results of Marginal Functions.

Note. This table presents the estimates of the marginal models for returns of the China stock index, government bond, and gold price. Numbers in brackets are p values and numbers in parentheses are standard deviations. Q stands for Q statistics for testing the hypothesis of no serial correlation. LM stands for ARCH-LM statistics for the hypothesis of no autoregressive conditional heteroscedasticity. LM = Lagrange multiplier.
, **, and * denote significance at 1%, 5%, and 10%, respectively.
In Table 3, the estimates of
Estimation Results of MEST Copula Functions and the Associated Tail Dependence Coefficient.

Note. Panel A reports the estimates of the MEST copula model for China and the pairwise lower tail dependence coefficient; whereas Panel B reports those with negative gold returns and negative bond yields. Numbers in parentheses are standard deviations. λ s are the shape parameters for marginal distribution, τ is an extension. Parameter and v are the degree of freedom. λL stands for the lower tail dependence coefficient. MEST = multivariate extended skew-t.
, **, and * denote significance at 1%, 5%, and 10%, respectively.
Analysis of Single Safe-Haven Effect Strategy
To verify whether either bonds or gold is a safe haven for stocks, we employ the lower tailed dependence coefficient
Panel A of Table 3 reports the estimates of
During a stock market crisis, the 10-year government bond is at best a weak safe-haven asset for stocks, and gold is not only a strong but also a weak safe-haven asset. The findings are consistent with the results of Baur and McDermott (2013), Bulut and Rizvanoghlu (2019), and Lee et al. (2019).
Conditional Analysis of Safe-Haven Effect of Bond and Gold
In this section, we examine whether bonds (gold) are a weak safe haven for stocks conditional on extremes in negative returns for gold (bonds). We study the extreme dependence of the two pairs of assets: stocks–bonds conditional on the gold market and stocks–gold conditional on the bond market.
First, we consider the conditional joint probability to investigate whether bonds (gold) work as a strong safe-haven asset if gold (bonds) has an extreme poor performance.
For estimating the probability, we evaluate the joint density of

where
If the series of stock and bond returns are perfectly correlated, the joint probability is
Joint Safe-Haven Effects: Conditional Joint Lower Tail Probability.

Note. This table reports the estimates of the conditional joint tail probability for stock–bond and stock–gold pairs. Panel A reports the estimated joint probabilities of stock and bond returns, conditioning on gold market, under the 5% and 1% quantiles. Panel B reports the estimated joint probabilities of stock and gold returns, conditioning on bond market, under the 5% and 1% quantiles.
Second, we investigate whether bonds (gold) is a weak safe-haven asset for stocks if assuming the poor gold (bonds) returns.
From the results in Table 5, the absolute difference between the two conditional probabilities for stock–bond and stock–gold pairs is larger than 1%, indicating that stocks and bonds (gold) are not independent conditional on gold (bonds). Thus, we argue that neither bonds nor gold is able to be a weak safe-haven asset conditional on the poor performance of the other alternative investment.
Joint Safe-Haven Effects: Conditional Independence Test.
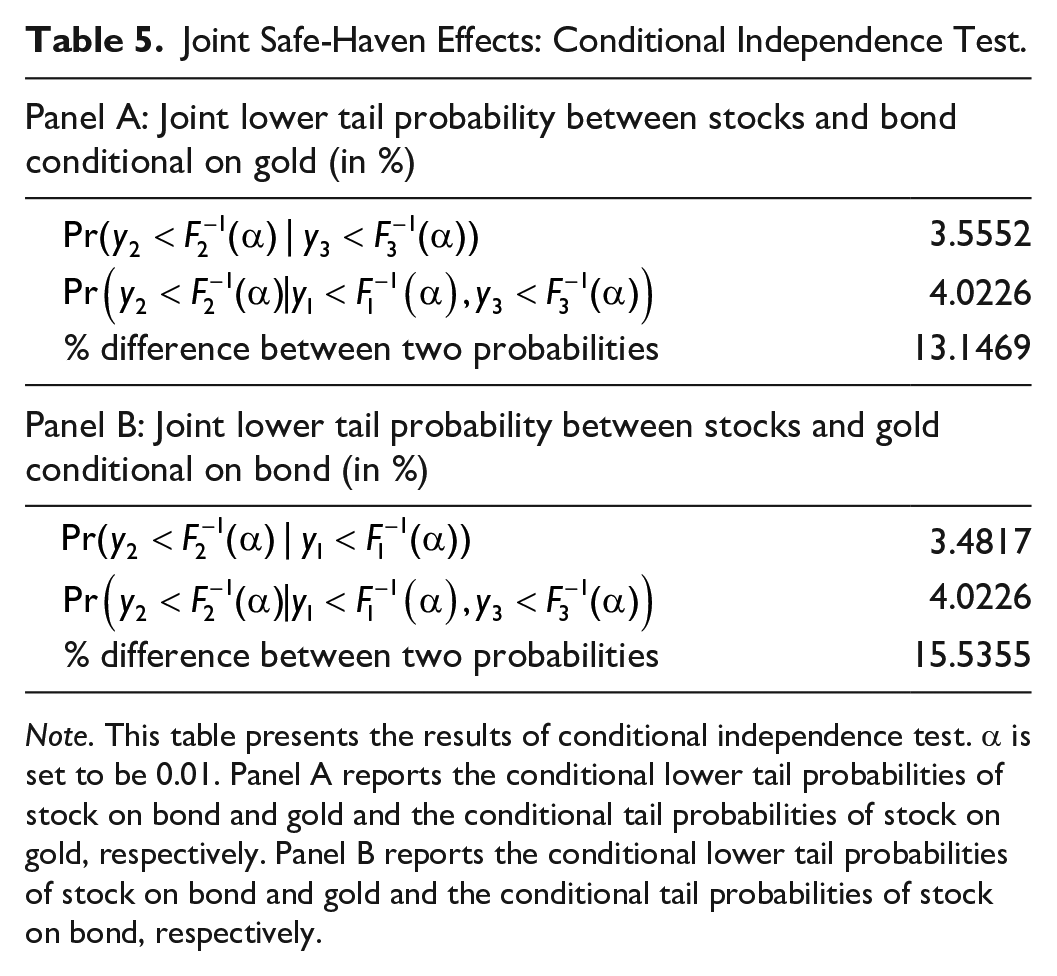
Note. This table presents the results of conditional independence test. α is set to be 0.01. Panel A reports the conditional lower tail probabilities of stock on bond and gold and the conditional tail probabilities of stock on gold, respectively. Panel B reports the conditional lower tail probabilities of stock on bond and gold and the conditional tail probabilities of stock on bond, respectively.
When bond (gold) declines dramatically, stocks and gold (bonds) also decline dramatically. Hence, gold is not a strong safe haven for stocks when bonds perform poorly. Furthermore, the conditional independence analysis indicates that bonds (gold) are no longer treated as a weak safe-haven asset when the alternative investment is included in the portfolio.
Sandoval and Franca (2012) showed that the stock markets have a tendency to have a higher correlation during markets crash. Therefore, the conditional distributions of stocks and gold (bonds) have a tendency to have heavier tails than the unconditional distributions.
Multivariate Lower Tail Dependence Analysis
Finally, we estimate the multivariate lower tailed dependence coefficient via a D-vine MEST copula method to provide a straightforward insight regarding the multivariate tail dependence among stocks, bonds, and gold. Panel A of Table 6 reports the results of the copula and conditional functions estimation. The estimated
Estimation Results of the Vine Copula Model.

Note. c1,2, c3,2, and c1,3|2 denote the copula densities of stock and bond, of stock and gold, and of bond and gold conditional on stock, respectively. Numbers in parentheses are standard deviations. λs are the shape parameters for marginal distribution, τ is an extension parameter, and v is the degree of freedom.
, **, and * denote significance at 1%, 5%, and 10%, respectively.
The estimates of
Correlation With Value-at-Risk (VaR)
Finally, we investigate the VaR in terms of the MEST copula function. We evaluate the 1% Portfolio value-at-risk (PVaR) in terms of an equally weighted portfolio. We choose the large negative stocks returns (2%, 4%, . . ., 20%) to calculate 1% PVaR. Based on the choices of the stock returns, we can search for the corresponding returns of bonds or gold to obtain a joint probability of 1%. For ease of interpretation, we discuss the average PVaR across different combinations. The average 1% PVaR for stock–bonds, stock–gold, and stock–bonds–gold are −0.0051, −0.0074, and −0.0082, respectively. This implies that, on average, there is a 1% probability so that the daily portfolio loss is larger than 0.51% for stock–bonds pair, 0.74% for stock–gold pair, and 0.24% for stock–bonds–gold pair. That is, if a portfolio contains US$500 in stocks and US$500 in bonds (gold), the PVaR is US$5.1 (US$7.4) on average. Moreover, if a portfolio includes US$333.33 in stocks, US$333.33 in bonds, and US$333.33 in gold, the PVaR is US$8.2 on average. Thus, the average 1% VaR of stock–bonds–gold portfolio is larger than both the average 1% VaRs of stock–bonds portfolio and of stock–gold portfolio. This is consistent with the previous findings in the “Multivariate Lower Tail Dependence Analysis” section.
Conclusion
Since the recent stock markets crash, risk management of the Chinese stock market has attracted increasing attention. This study attempts to investigate whether government bonds and gold can serve as safe-haven assets for Chinese stocks. We utilize an MEST copula model as well as the coefficient of tail dependence to verify the tail correlation for stock, bond, and gold markets. Our study finds that bonds and gold are weak safe havens. In addition, gold provides a strong safe-haven ability for stocks.
The occurrence of safe haven in crises times is good news for investors in China because it indicates that there is an asset class to protect investors from market losses during market turmoil. Our empirical analysis shows that either bonds or gold can stabilize the Chinese stock markets because they improve diversification.
When stocks, bonds, and gold are jointly analyzed, we find that including both gold and bonds in a portfolio does not outperform including either gold or bonds in a portfolio. For the sake of diversification, the portfolios should have stocks and one of the studied safe-haven assets, gold and bonds. Although our study complements recent studies on the gold and bonds assets in China, further analysis of joint estimation of safe-haven assets remains necessary.
The MEST copula model provides support of skewed tails or heavy/thin tails for nonnormal returns of stocks, bonds, and gold in China. Moreover, the development of multivariate tail dependence coefficients supports the analysis of how multiple assets crash together when one of them crashes. Our research also implies that investors should consider the tail dependence structure of assets before putting more safe-haven assets in the portfolio to hedge stock market crashes. This is very similar to the modern portfolio theory of Harry Markowitz, which takes correlations and covariances of asset returns into consideration.
Footnotes
Acknowledgements
We thank the assistance of graduate students from Jiangxi University of Finance and Economics.
Authors’ Note
No ethics statement is needed. The article is approved by all authors for publication.
Declaration of Conflicting Interests
The author(s) declared no potential conflicts of interest with respect to the research, authorship, and/or publication of this article.
Funding
The author(s) received no financial support for the research, authorship, and/or publication of this article.