
Abstract
The goal of this paper is to connect models of customer satisfaction and financial performance into a single aggregate model of business performance. The contribution of this paper lies in the increased complexity of assessing business performance, which results from connecting the model of customer satisfaction with the model of financial performance. The model of customer satisfaction is constructed based on customer expectations, which differs from the standard approach. The model is constructed based on a questionnaire survey of customers of select businesses. The financial performance of the same businesses was assessed based on publicly available data, which were used as inputs into ratio indicators. Afterward, financial performance was assessed using two methods (TOPSIS and Altman’s Z-score). The results show that the model of customer satisfaction helps us better understand financial performance when incorporating customer expectations. This financial performance was measured using the aggregate model of financial performance, composed of select financial indicators. The magnitude of the effect is greater than if financial performance is measured using standalone ratio indicators.
Plain language summary
Customer satisfaction depends on a number of factors and affects the financial performance of a enterprise. It is not entirely clear how the system of customer satisfaction factors affects the performance of the enterprise. It appears that the relationship between customer satisfaction and customer expectations is crucial. The customer satisfaction model is constructed based on the resulting customer expectations and on a questionnaire survey of customers of the selected enterprises. The financial performance of these enterprises was evaluated based on accounting data that were used as inputs to the financial ratios, which were then evaluated together to rank the enterprise by a single number. The joint evaluation was carried out in two different ways (by comparing the results of selected indicators of the other enterprises studied and by using a standard index into which the results of the required financial indicators were entered). It was found that the financial performance of an enterprise (measured together by profitability, liquidity and activity indicators) is directly influenced by customer expectations and indirectly by customer satisfaction, product quality (as perceived by the customer) and customer knowledge of the product. Customer loyalty and product competitiveness (as perceived by the customer) have a smaller and more indirect effect on financial performance. At the same time, it has been shown that better results of the evaluation of the financial performance of enterprises are given by comparing the results of selected indicators of other enterprises studied. This research is limited by the sample size, which is on the borderline of a small sample (102 enterprises). It is further limited by its narrow focus on the food industry.
Introduction
In the area of financial performance and customer satisfaction, there are few complex models which assess both phenomena together (Anderson et al., 2004; Eklof et al., 2020; Keisidou et al., 2013; Yeung & Ennew, 2000). Additionally, these complex models of financial performance together with customer satisfaction are superficial, with the exception of Suchanek and Kralova (2023). This is because researchers base their findings on calculated values of a customer satisfaction index or a single factor of total satisfaction, which they then connect with select indicators of business financial performance (Anderson et al., 2004; Eklof et al., 2020; Golovkova et al., 2019; Guenther & Guenther, 2021; Yeung & Ennew, 2000). In other publications (Chi & Gursoy, 2009; Keisidou et al., 2013), a single factor – construct – is used.
This makes it impossible to determine the impact (either direct or indirect) of individual variables from the customer satisfaction model on the financial performance of the company. Moreover, the financial performance of a company is a complex (multi-criteria variable) that should be measured by a comprehensive indicator or group of financial indicators that assess different aspects of financial performance (e.g., profitability, liquidity, debt, activity, etc.; Kliestik et al., 2020).
However, most models linking customer satisfaction to financial performance focus on only one aspect of financial performance, namely profitability, or examine these financial aspects separately using separate models (Anderson et al., 2004; Eklof et al., 2020; Golovkova et al., 2019; Yeung & Ennew, 2000). Only Chi and Gursoy (2009) and Otto et al. (2020) used a composite measure of financial performance, but only from profitability ratios, and they measured customer satisfaction with a construct rather than a comprehensive model. Only Keisidou et al. (2013) measured financial performance with a composite indicator as a part of the comprehensive customer satisfaction model.
Customer expectations are often related to customer satisfaction (Marimon et al., 2019). The customer satisfaction model is based on the relationship between customer satisfaction and expectations. Most research on this point (especially that focused on building comprehensive satisfaction models) has constructed a relationship from customer expectations to customer satisfaction, that is, that customer expectations influence customer satisfaction. If customer expectations are measured before a repeat purchase, they affect customer satisfaction (Golovkova et al., 2019; Liang & Li, 2023; Morgeson et al., 2023). However, customer satisfaction can predict customer expectations of the results achieved by using the product (van Wezel et al., 2015). Thus, the relationship between customer expectations and customer satisfaction can also be reversed. This can occur when customer expectations are measured after a repeat purchase (and before the next purchase), that is, customer expectations are influenced by customer satisfaction with the first repeat purchase (Lin & Lekhawipat, 2016; Rufín et al., 2012; Suchanek & Kralova, 2023). The question then arises as to what the relationship between customer expectations and the financial performance of the business will be, as they can be expected to influence the financial performance of the business (Suchanek & Kralova, 2023).
Furthermore, there is no model except that of Suchanek and Kralova (2023) which accounts for the link between customer expectations as a variable within the model and business financial performance. The measurement of financial performance is a complex problem, where multiple various indicators should be used, either standalone (Eklof et al., 2020; Jantarakolica et al., 2017; Sun & Kim, 2013) or in combination with each other (Manogna & Mishra, 2022).
Appropriate financial management requires knowledge of the financial situation (Adiputra & Patricia, 2020) from various perspectives, that is, using various indicators in a complex way; awareness of the reasons behind the financial state of the business is also necessary (Kliestik et al., 2020). It is absolutely critical for a business to be aware of its customers’ satisfaction, as well as any relevant variables other than customer satisfaction which affect financial performance (Hamzah & Shamsudin, 2020). However, customer expectations appear to be even more relevant in this context than customer satisfaction (Suchanek & Kralova, 2023).
The contribution of this paper lies in connecting two partial systems – a customer satisfaction model and a business financial performance assessment model – into a single system (see Neely et al., 2005; cf. Patel, 2021; Tangen, 2004). The goal of the paper is to make a statistically verifiable connection between the two models.
Financial performance should be measured in a complex way, that is, using mutually affecting financial indicators, either through an aggregate index (see Altman, 2000) or by using one of the existing multi-criteria assessment methods, rather than by using a single ratio indicator (Manogna & Mishra, 2022). Later in the paper, we introduce two models of measuring financial performance, which we connect with the customer satisfaction model.
This paper’s contribution lies in connecting financial performance and customer satisfaction so that business managers may access information about financial performance in a synthesized, accessible form – a single number – which, however, accounts for multiple financial indicators. At the same time, managers will be able to access information about factors of customer satisfaction (especially expectations) and about how these factors affect financial performance. This will make it possible to provide a more accurate estimate of the consequences of the managers’ decisions in the areas of product quality, price, and marketing for future financial performance through the impacts on customer expectations.
The paper is structured as follows: a brief review of relevant literature is followed by a methods section, including the construction of partial models of customer satisfaction and financial performance, the introduction of hypotheses connecting the two partial models into one aggregate model, and an explanation of the methods used. Subsequently, results are presented and discussed. The paper ends with concluding remarks.
Literature Review
Definitions of business performance have gradually shifted since the 1950s in accordance with gradual changes in approaches (Taouab & Issor, 2019). Originally, business performance was viewed as efficiency, that is, mainly with regard to the financial aspect (Georgopoulos & Tannenbaum, 1957), focused on the ability of the business to use its environment to access and exploit limited resources (Seashore & Yuchtman, 1967), the level of motivation and satisfaction of its members (Lupton et al., 1977), or the ability of the business to create value for its clients (Porter, 1985). Over the last approximately 20 years, the definition has shifted to emphasize effectiveness in addition to efficiency (Blatrix & Bartoli, 2015; Neely et al., 2005; Patel, 2021; Pintea & Achim, 2010; Radnor & Barnes, 2007; Verboncu & Zalman, 2005). Efficiency is understood in this context as financial business performance, and effectiveness as the ability to satisfy customers, that is, as customer satisfaction (Neely et al., 2005; Patel, 2021).
Customer satisfaction measures how well the experience of using a product matches the buyer’s value expectations (Abd Razaka et al., 2020). Customer satisfaction has been measured as the overall purchase experience (general satisfaction) in line with Fornell et al. (1996), Otto et al. (2020) and Hallencreutz and Parmler (2021).
Customer satisfaction can be conceptualized either as a standalone factor, that is, a multi-dimensional construct, or as part of a more complex model (or index). When treated as a single construct, it is comprised of factors that represent individual factors within more complex models (compare with Fornell et al., 1996 with Galbreath & Shum, 2012 or with Berraies & Hamouda, 2018). These single-factor constructions of customer satisfaction are generally imbedded in wider models investigating relationships beyond customer satisfaction, for example in the context of corporate social responsibility (Galbreath & Shum, 2012) or customer empowerment (Berraies & Hamouda, 2018). While such constructions are relatively streamlined, they do not allow for a deeper assessment of the relationships between the individual dimensions of satisfaction. Therefore, in our research, we have developed a model (index) of customer satisfaction to facilitate a more nuanced analysis.
The first model of customer satisfaction was the Swedish Customer Satisfaction Barometer (CSB) created by Fornell (1992). This was followed by the American Customer Satisfaction Index (ACSI), created again by Fornell et al. (1996), which is currently likely the most widespread model. It is used to measure customer satisfaction with both products and services. In the year 2000, the European Customer Satisfaction Index (ECSI) was publicized, created by Gronholdt et al. (2000), which has found use especially in measuring customer satisfaction with services. Eklöf and Selivanova (2008) followed this up by creating the Extended Performance Satisfaction Index (EPSI), which is used mainly in the context of services. All of the above-mentioned models use the factors perceived quality, perceived value, customer expectations and loyalty. ESCI and EPSI also use the factor image, whereas ACSI adds the factor customer complaints.
Customer satisfaction in the models above is understood as an evaluation of the product or service after consumption (Mittal & Frennea, 2010). The assessment mainly concerns perceived differences between expectations regarding the product’s or service’s functions, attributes and reality, as it is perceived during purchase, delivery, and after consumption (Kobylanski et al., 2011; Tse & Wilton, 1988). However, if customer expectations are assessed before the next purchase and assumed to be the result of a previous consumption, the bonds in the model of customer satisfaction change and future customer expectations become the critical variable, rather than customer satisfaction or loyalty (for details see Suchanek & Kralova, 2023). This is how perceived customer expectations are understood in this research (as future expectations before purchase), and as such, we will use a modified model of customer satisfaction (see Figure 1).

A model of the impact of customer expectations on the financial performance of a company.
Customer expectations currently correspond to the product features that make it attractive (Kosiba et al., 2020). Customer expectations typically examine the expected quality with respect to the specifics of the product (in the case of our research, this product was food) in line with Brunsø et al. (2002) At the same time, these expectations were measured based on the experience and knowledge that the customer had about the product in line with Fornell et al. (1996), Kosiba et al. (2020) and Eren (2021).
In our research, perceived quality was examined with respect to the specific focus of the research - food. Thus, perceived quality was examined from a sensory perspective in line with Cardello (1995), Custodio et al. (2019) and Konuk (2019).
The
Perceived value constitutes the overall mental evaluation of a concrete product (Yang & Peterson, 2004). The measurement of perceived value focuses on the perception of functional and economic value and the perception of the performance-quality relationship (Fornell et al., 2020; Suchánek & Králová, 2019; Sweeney & Soutar, 2001).
Product
In line with the definition of competitiveness, our research will focus on product image (brand), level of marketing communication and overall product quality in the context of competitiveness. Thus, the competitiveness of the product was measured and compared to the competition according to Suchánek and Králová (2019).
Customer loyalty was measured within the behavioral dimension according to Suchánek and Králová (2019) and Liu et al. (2019). Specifically, behavioral loyalty was measured by repurchase intentions, switching intentions, and exclusive intentions according to Jones and Taylor (2007).
In our research, product knowledge was understood as a measure of the customer’s actual (subjective) knowledge of the product based on their personal and repeated experience of using (consuming) the product in accordance with the research (Zhang et al., 2019).
When assessing customer satisfaction using a complex model, one may expect the effect of customer satisfaction on financial performance to be indirect and positive (Anderson et al., 2004; Eklof et al., 2020; Juhl et al., 2002). In this research, one may expect the positive indirect effect of customer satisfaction (here through customer expectations) on business financial performance.
We measure financial performance objectively using publicly available data, as this data is relatively reliable (Tosi et al., 2000) and this method of assessing financial performance is relatively widespread (Gunasekaran et al., 2005; Gupta & Galloway, 2003).
Financial performance in the context of customer satisfaction derives from sales, profit and rate of return (Neely et al., 1995). As such, rate of return is the most important variable when assessing financial performance (Anderson et al., 1997; Ilyas et al., 2018; Terpstra & Verbeeten, 2014; Yeung et al., 2002). Furthermore, financial performance is assessed using a combination of ratio and absolute indicators (Chia et al., 2009; Eklof et al., 2020; Jantarakolica et al., 2017; Sun & Kim, 2013). However, thus far, aggregate models have not been used to assess financial performance in the context of customer satisfaction. This includes multi-criteria models (which use several financial indicators), credit worthiness models or bankruptcy models (e.g., Altman’s Z-score). Our research uses an aggregate model to measure financial performance.
Materials and Methods
Business Performance Model
Neely et al. (2005) view performance as the extent to which customer demands are being met (effectiveness) and as the extent to which resources are being utilized (efficiency), which leads to a given value of customer satisfaction. Business financial performance and customer satisfaction may thus be studied separately using partial models, but through synthesis, a complex aggregate model can be created, enabling a holistic view of business performance. This leads to the following hypothesis:
This hypothesis can be formulated for each financial performance model:
The complex aggregate model of business performance is shown in Figure 1. This model is composed of two partial models: the model of customer satisfaction and the model of financial performance. The model of customer satisfaction is explained in more detail in the original article by Suchanek and Kralova (2023). This model was created based on data from 2016, where 102 businesses and 1,530 of their customers were investigated.
The questionnaire was distributed electronically (using a professional company specialized in conducting surveys and collecting data). The sample of respondents consisted of customers of the surveyed companies who indicated that they had repeated experience with the company’s products (they had purchased the product at least twice). Respondents were randomly selected to ensure that the research sample was representative of age (18+), gender, and region. The research sample consisted of a total of 1,530 adult citizens of the Czech Republic.
The financial performance of the companies was assessed on the basis of standard financial ratios, which are constructed from basic accounting documents, that is, balance sheets and profit and loss statements. These financial data are publicly available (by law) and were obtained from the Bisnode database. The financial data were collected for the same time period as the customer satisfaction data in order to make the data comparable over time.
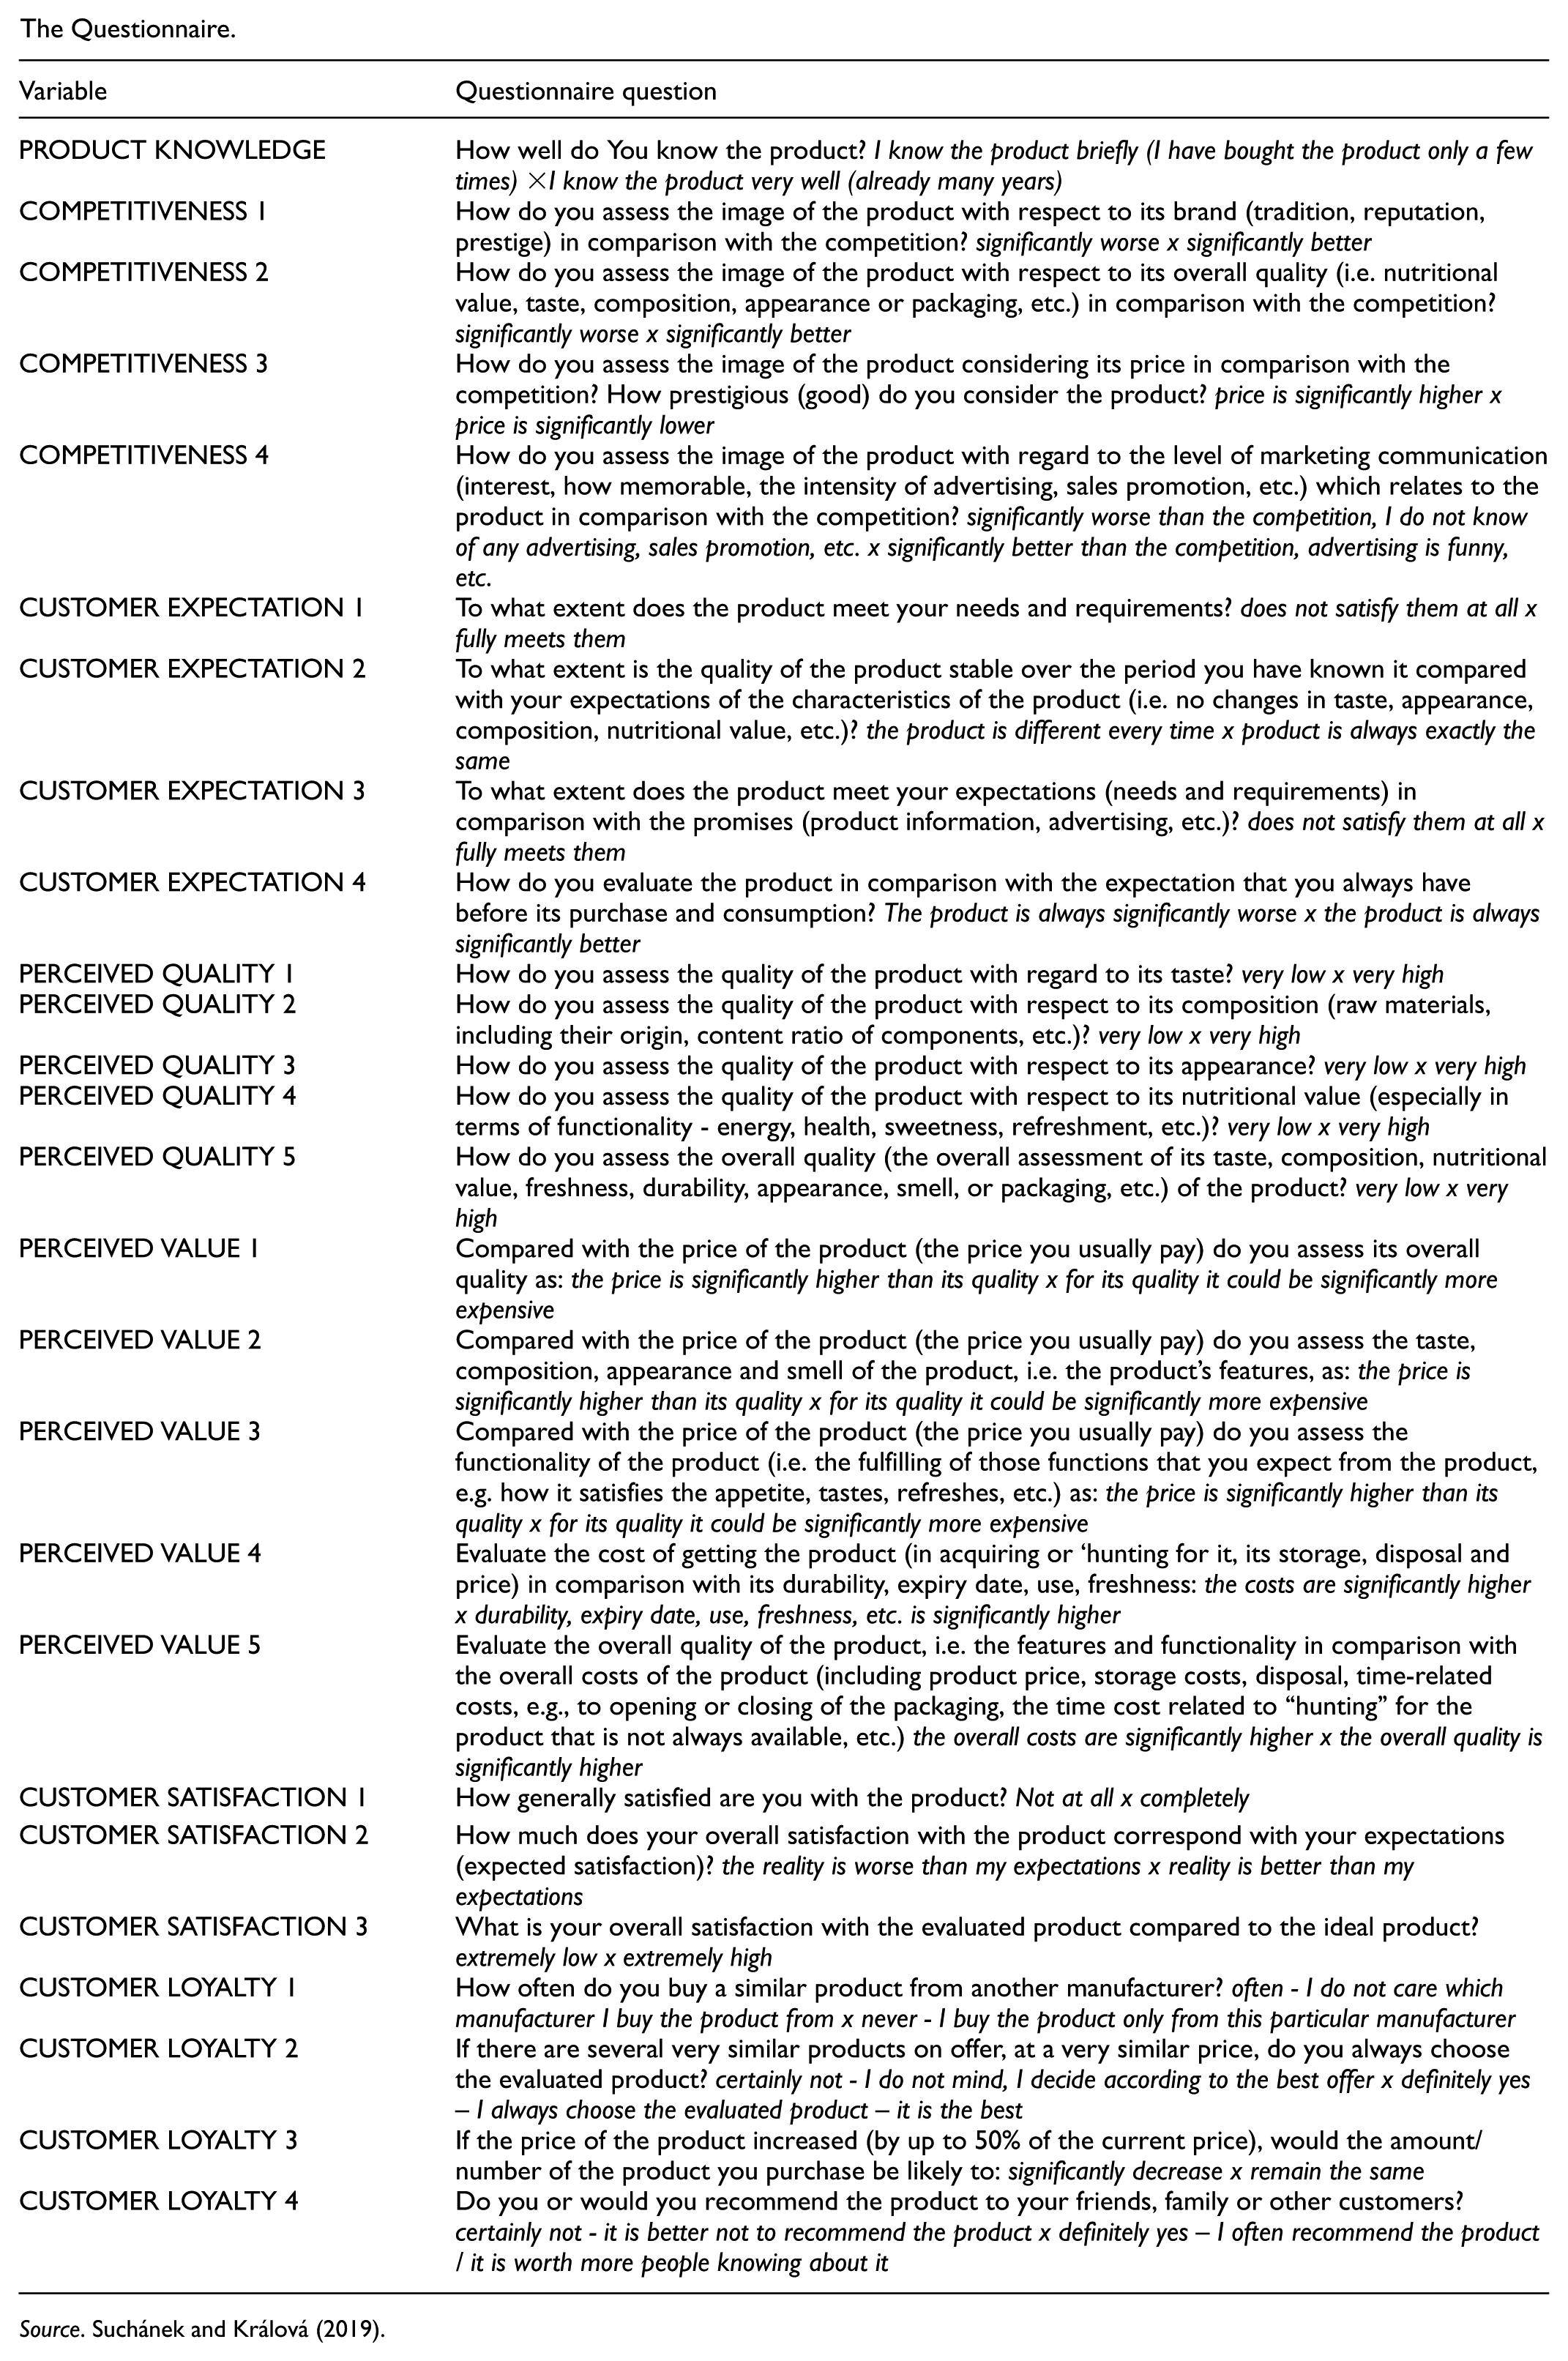
This investigation was conducted using a questionnaire (see Appendix) based on Suchánek and Králová (2019; informed consent was obtained from all research participants and the research was approved by the Research Ethics Committee of the University), where the following factors were assessed: customer expectations (CE), customer satisfaction (CS), perceived quality (PQ), product competitiveness (C), perceived value (PV), customer loyalty (CL), and product knowledge (PK). Each of these factors was composed as a construct of several questions in the questionnaire, with the exception of PK, which was represented by a single question. Specifically, product knowledge was measured by one manifest variable, competitiveness by three variables, customer expectation and customer loyalty by four variables, perceived quality and perceived value by five variables, and customer satisfaction by three variables.
Business financial performance is represented by two separate models which are described later in this paper. The models were constructed using standard financial indicators, as the necessary data of 102 businesses was publicly available.
The TOPSIS Model
This model is based on select financial indicators aggregated using the multi-criteria method TOPSIS (The Technique for Order Preference by Similarity to Ideal Solution). The following indicators were aggregated: ROA (constructed as the sum of net profits, income tax payable and interest charges, divided by total assets), ROE (constructed as net profits divided by equity), Asset turnover (ATO, constructed as the ratio of total revenue and total assets) and liquidity L3 (constructed as the ratio of current assets and current liabilities).
ROA was used in the context of customer satisfaction by Anderson et al. (1997), Yeung et al. (2002), Terpstra and Verbeeten (2014) and Suchanek and Kralova (2023). ROE was used by Heath and Seldin (2012), Ilyas et al. (2018) and Suchanek and Kralova (2023). ATO was used by Yeung and Ennew (2000) and Suchanek and Kralova (2023). Liquidity as an indicator was used by Grewal et al. (2010) and De Mendonca and Zhou (2019).
The TOPSIS method ranks a sample of businesses (here 102 businesses) based on financial performance from highest to lowest, that is, the best element (business) is the shortest geometric distance away from the ideal solution and the greatest distance from the basal element (business; Tzeng & Huang, 2011). The method is carried out in seven steps, where the first step is the creation of an evaluation matrix of m businesses or terms and n indicators, where y_ij represents the value of the jth indicator in the ith business in the (yij)m × n matrix (Fiala et al., 1994).
The second step is the normalization of the matrix (yij)m × n, where the matrix R = (rij)m × n is created using the normalization method (Fiala et al., 1994):

The third step is the calculation of the normalized weighted criteria decision matrix W = (wij) from the weights (v) of indicators (r; Fiala et al., 1994), the weights vj were in our case equal to one:

The fourth step includes identification of the ideal business h with the vector (h1–hm) and the basal business d with the vector (d1–dm) with regard to the values of matrix W. The ideal and basal businesses are theoretical constructs composed of the best and worst values of each factor respectively, that is, these are not real businesses.
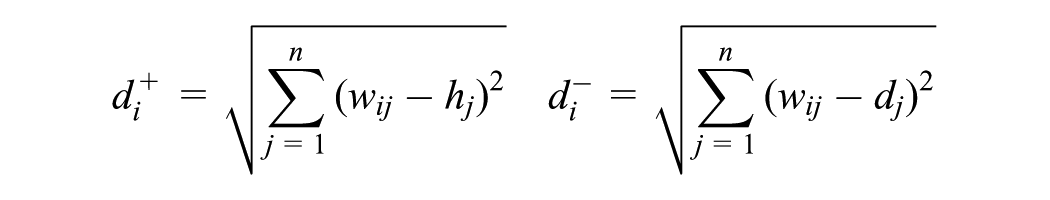
In the fifth step, the distance of each business from the ideal business di+ and from the basal business di- is calculated according to the following formulas (Fiala et al., 1994):
In the sixth step, the relative indicators of distance of each business from the basal business is calculated according to the following formula (Fiala et al., 1994):

These indicators gain values from the range <0;1>, where the basal business takes the value 0 and the ideal business takes the value 1.
In the final – seventh – step, businesses are ranked in descending order according to the CC indicator. The higher the value of this indicator, the better (Fiala et al., 1994; Tzeng & Huang, 2011). The value of the CC indicator is also the assessment number, which indicates the financial performance of the business (within the investigated sample). This is the value we connected with customer satisfaction in the partial hypothesis Ha.
Altman’s Model (Z-Score)
Altman’s model is the most widespread complex model, its first version was introduced in 1968 (see Altman, 1968). A number of researchers consider this model a very good indicator of business financial performance (Li & Rahgozar, 2012; Elviani et al., 2020). The model is primarily used to assess whether a business faces the threat of bankruptcy, however, it can be used as a complex indicator of financial performance when investigating a group of businesses (Chadha, 2016). A greater value of the model’s index means greater business financial performance. We connected the resulting value of the model in the context of the investigated sample to customer satisfaction according to partial hypothesis Hb. Financial performance was assessed using the 1983 version of this model constructed for businesses which have not been quoted on the capital market (Altman & Hotchkiss, 1983), as none of the investigated businesses were quoted on a stock exchange:

The indicators are constructed as follows:
x1 = ratio of net working capital and total assets,
x2 = ratio of retained earnings and total assets,
x3 = ROA (a sum of net profits, income tax payable and interest charges, divided by total assets),
x4 = ratio of share capital and total liabilities,
x5 = ATO (ratio of total revenue and total assets).
Statistical Methods
We created the complex aggregate model using Structural Equation Modeling (SEM). We used the R language (R Core Team, 2021) and the Lavaan package (Rosseel, 2012) to estimate the structural models. The modeling took place in two steps. First, we created the measurement part of the model, which modeled the relationships between latent variables (CS, C, PV, PQ, CE, CL) and manifest variables (derived from the scale questions in the questionnaire; Suchanek & Kralova, 2023). In the second step, we modeled the relationships between factors of satisfaction (CS, C, PV, PQ, CE, CL, PK) and the respective model of financial performance (TOPSIS and Z-score). We standardized all latent and observed variables to allow us to compare the magnitude of effects.
A number of indices are used to compare the quality of structural models, with the Tucker-Lewis Index (TLI), the Comparative Fit Index (CFI) and the Standardized Root-Mean-Square Residual (SRMR) among the most widely used (Schumacker & Lomax, 2016). Both CFI and TLI range between 0 and 1, with values closer to 1 indicating a good model fit. SRMR values range from 0 to 1, with values closer to 0 indicating a good model fit (Hair et al., 2010). We assessed the model’s reliability using Cronbach alpha coefficients, where it is recommended that each factor should show a value greater than 0.7 (Robertson & Evans, 2020). Convergent validity was tested using AVE, where it is recommended that each factor should show a value greater than 0.5 (Fornell & Larcker, 1981).
Results
In this section, we present the results of the complex aggregate model, composed of the partial models of customer satisfaction and business financial performance. The model of customer satisfaction is the same in both partial hypotheses, whereas business performance is represented first by the TOPSIS model (Ha) and then by Altman’s Z-score (Hb).
First, the latent variables in the measurement part of the model were constructed using the relevant manifest variables from the questionnaire (see above), as shown in Table 1. The characteristics of the model are as follows: fit indices CFI = 0.906, TLI = 0.889; SRMR = 0.056; reliability was tested using Cronbach alpha coefficients (.957(CE); .963(CS); .949(PQ); .927(C); .947(PV); .853(CL)); validity was tested using AVE (.851(CE); .896(CS); .800(PQ); .763(C); .788(PV); .569(CL)).
Latent Variables Constructed From Relevant Questionnaire Questions in the Measurement Model.

Source. Authors by Suchanek and Kralova (2023).
The TOPSIS Model
Each relationship in the model in Table 2 is statistically significant at the level of significance 0.05 (p = .001). The CFI of the model is 0.898; TLI = 0.883; SRMR = 0.065. Thus, the model reflects reality and the effect of Customer Expectation (CE) as stated in Ha proved to be statistically significant. The partial hypothesis Ha can be accepted as empirically verified. For better illustration, the results from the Table 2 are also presented in graphical form in Figure 2.
Results of the Structural Part Including Financial Performance TOPSIS.

Source. Authors.

Relationships between individual variables in the model of customer satisfaction and financial performance (measured by TOPSIS).
The results suggest that the effect of customer expectations (within the partial model of customer satisfaction) on financial performance measured using a complex indicator based on ROA, ROE, ATO and liquidity L3 is very strong and positive (est = 2.24, p = .001). Compare this with the magnitude of the effect of customer expectations on standalone indicators ROA, ROE and ATO, which, although also positive, was significantly lower (compare with Suchanek & Kralova, 2023).
Altman’s Model (Z-Score)
Each relationship in the model in Table 3 is statistically significant at the level of significance 0.05 (p = .01). The CFI of the model is 0.895; TLI = 0.881; SRMR = 0.064. Thus, the model reflects reality, and the effect of Customer Expectation (CE) as stated in Hb proved to be statistically significant. The partial hypothesis Hb can be accepted as empirically verified. For better illustration, the results from Table 3 are also presented in graphical form in Figure 3.
Results of the Structural Part Including Financial Performance Z-Score.

Source. Authors.

Relationships between individual variables in the model of customer satisfaction and financial performance (measured by the Altman model).
The results suggest that the effect of customer expectations (within the model of customer satisfaction) on financial performance measured using the complex indicator Z-score, which combines five indicators, is weaker than in the case of the TOPSIS model. However, even for the Z-score case, the magnitude of the effect of expectations on business financial performance measured using a complex indicator is greater than the magnitude of the effect of individual indicators ROA, ROE and ATO (compare with Suchanek & Kralova, 2023).
Discussion
The results of the research indicate that the effect of customer expectations (within an aggregate model of customer satisfaction) on models of business financial performance, represented by a number of jointly assessed financial indicators, is very strong. The magnitude of this effect is significantly greater than that of the effect of customer expectations on any standalone financial indicator (be it ROA, ROE, or ATO), irrespective of the fact that the effect of customer expectations on certain indicators (ROE) was not significant (compare with Suchanek & Kralova, 2023). Measuring financial performance using an aggregate index (composed of a number of partial and varied financial indicators) is more appropriate compared to using only a single financial indicator (Emrouznejad & Cabanda, 2010; Gitman, 2002, p. 52), no matter whether the aggregate indicator used is a universal model (such as Z-score, in our case), or a model created based on a sample of businesses using multi-criteria methods (such as TOPSIS, in our case).
During previous research (Suchanek & Kralova, 2023), we found a positive effect of customer expectations on several select financial indicators (especially ROA). It was therefore interesting to find out whether customer expectations have any effect on aggregate indicators of financial performance (TOPSIS and Z-score). In both cases, we found a positive and very significant effect of customer expectations on both aggregate indicators. The effect on aggregate indicators of financial performance was much greater than the effect on standalone indicators (ROA, ROE, ATO), which confirms the general conclusions of Emrouznejad & Cabanda, 2010; Gitman, 2002, p. 52).
The significant differences between the magnitudes of the effects of customer satisfaction on business financial performance is apparent from other studies (compare with Eklof et al., 2020; Jantarakolica et al., 2017; Manogna & Mishra, 2022; Mittal et al., 2023; Sun & Kim, 2013). It appears that the effect of customer expectations, that is, the complex model of customer satisfaction, on business financial performance measured using multiple indices is much greater than previously thought. This also means that the factors in the model of customer satisfaction are much more important, that is, have a much greater effect on financial performance, than has been proven so far.
The relationships between the two different models of financial performance and the same model of customer satisfaction suggest that the model of customer satisfaction is relatively stable, that is, that the magnitude of the individual effects within the model of customer satisfaction does not significantly change after changing the indicators of financial performance, even if the indicators are not aggregate in nature (compare with Suchanek & Kralova, 2023). However, the magnitude of the effect of the model of customer satisfaction on the given indicator of financial performance does change significantly, which is consistent with the findings of other studies focused on the effect of customer satisfaction through the effect of general satisfaction (Eklof et al., 2020; Jantarakolica et al., 2017).
Conclusions
Our research has proven the effect of the modified model of customer satisfaction (through customer expectations) on business financial performance, measured using an aggregate indicator composed of several standalone financial indicators. This effect was several times stronger than the effect of the model of customer satisfaction (modified or standard) on standalone financial indicators, and on financial indicators as constructs (latent variables – see Keisidou et al., 2013). It thus seems necessary to assess financial performance in a complex way, using several financial indicators and either multi-criteria methods (in our case TOPSIS) in conjunction with research of the financial situation of the sample of businesses, or using a standard model (in our case the Z-score) where such research is unnecessary.
Our research has also shown that the chosen model of customer satisfaction assessment is very stable, that is, that the relationships between individual factors in the model of satisfaction do not change much depending on the chosen model of financial performance. This means that aggregate results of certain models of customer satisfaction (e.g., ACSI, EPSI, etc.) can be used to assess the effect of customer satisfaction on financial performance. It is, however, important to consider which model should be used, as the effects of the different models of customer satisfaction on financial performance are different. It is also important to know how any given model of customer satisfaction was constructed (which factors were used, what sort of questionnaire, what sorts of questions, etc.), so that the results can be correctly interpreted.
If we assume that the complex models are more appropriate for the assessment of financial performance than a single standalone partial indicator, or even several isolated such indicators, it can have interesting consequences for the assessment of the effect of customer satisfaction (through general satisfaction) on business financial performance. Using a single indicator, or several isolated indicators, of financial performance is standard practice in the context of assessing its relationship with customer satisfaction (Eklof et al., 2020; Jantarakolica et al., 2017; Sun & Kim, 2013). It is therefore worth asking whether the effect of general customer satisfaction on financial performance would be greater if financial performance were measured using a complex model, as was the case in our research.
In any case, this presents managers with new ways of significantly affecting the financial performance of their businesses. Measuring customer expectations before the next purchase is more accurate than measuring it after the purchase, and it can be linked directly with the measurement of customer satisfaction and other factors after the purchase. Customer expectations are by definition future-oriented, whereas the other factors in the model of customer satisfaction are present-oriented (future purchase vs. current purchase).
This research is limited by the sample size, which is on the borderline of a small sample (102 businesses). It is further limited by its narrow focus on the food industry, which on one hand allowed us to obtain more compact results, but on the other hand limits the generalizability of the results on other industries.
Footnotes
Appendix
The Questionnaire.
| Variable | Questionnaire question |
|---|---|
| PRODUCT KNOWLEDGE | How well do You know the product? I know the product briefly (I have bought the product only a few times) ×I know the product very well (already many years) |
| COMPETITIVENESS 1 | How do you assess the image of the product with respect to its brand (tradition, reputation, prestige) in comparison with the competition? significantly worse x significantly better |
| COMPETITIVENESS 2 | How do you assess the image of the product with respect to its overall quality (i.e. nutritional value, taste, composition, appearance or packaging, etc.) in comparison with the competition? significantly worse x significantly better |
| COMPETITIVENESS 3 | How do you assess the image of the product considering its price in comparison with the competition? How prestigious (good) do you consider the product? price is significantly higher x price is significantly lower |
| COMPETITIVENESS 4 | How do you assess the image of the product with regard to the level of marketing communication (interest, how memorable, the intensity of advertising, sales promotion, etc.) which relates to the product in comparison with the competition? significantly worse than the competition, I do not know of any advertising, sales promotion, etc. x significantly better than the competition, advertising is funny, etc. |
| CUSTOMER EXPECTATION 1 | To what extent does the product meet your needs and requirements? does not satisfy them at all x fully meets them |
| CUSTOMER EXPECTATION 2 | To what extent is the quality of the product stable over the period you have known it compared with your expectations of the characteristics of the product (i.e. no changes in taste, appearance, composition, nutritional value, etc.)? the product is different every time x product is always exactly the same |
| CUSTOMER EXPECTATION 3 | To what extent does the product meet your expectations (needs and requirements) in comparison with the promises (product information, advertising, etc.)? does not satisfy them at all x fully meets them |
| CUSTOMER EXPECTATION 4 | How do you evaluate the product in comparison with the expectation that you always have before its purchase and consumption? The product is always significantly worse x the product is always significantly better |
| PERCEIVED QUALITY 1 | How do you assess the quality of the product with regard to its taste? very low x very high |
| PERCEIVED QUALITY 2 | How do you assess the quality of the product with respect to its composition (raw materials, including their origin, content ratio of components, etc.)? very low x very high |
| PERCEIVED QUALITY 3 | How do you assess the quality of the product with respect to its appearance? very low x very high |
| PERCEIVED QUALITY 4 | How do you assess the quality of the product with respect to its nutritional value (especially in terms of functionality - energy, health, sweetness, refreshment, etc.)? very low x very high |
| PERCEIVED QUALITY 5 | How do you assess the overall quality (the overall assessment of its taste, composition, nutritional value, freshness, durability, appearance, smell, or packaging, etc.) of the product? very low x very high |
| PERCEIVED VALUE 1 | Compared with the price of the product (the price you usually pay) do you assess its overall quality as: the price is significantly higher than its quality x for its quality it could be significantly more expensive |
| PERCEIVED VALUE 2 | Compared with the price of the product (the price you usually pay) do you assess the taste, composition, appearance and smell of the product, i.e. the product’s features, as: the price is significantly higher than its quality x for its quality it could be significantly more expensive |
| PERCEIVED VALUE 3 | Compared with the price of the product (the price you usually pay) do you assess the functionality of the product (i.e. the fulfilling of those functions that you expect from the product, e.g. how it satisfies the appetite, tastes, refreshes, etc.) as: the price is significantly higher than its quality x for its quality it could be significantly more expensive |
| PERCEIVED VALUE 4 | Evaluate the cost of getting the product (in acquiring or ‘hunting for it, its storage, disposal and price) in comparison with its durability, expiry date, use, freshness: the costs are significantly higher x durability, expiry date, use, freshness, etc. is significantly higher |
| PERCEIVED VALUE 5 | Evaluate the overall quality of the product, i.e. the features and functionality in comparison with the overall costs of the product (including product price, storage costs, disposal, time-related costs, e.g., to opening or closing of the packaging, the time cost related to “hunting” for the product that is not always available, etc.) the overall costs are significantly higher x the overall quality is significantly higher |
| CUSTOMER SATISFACTION 1 | How generally satisfied are you with the product? Not at all x completely |
| CUSTOMER SATISFACTION 2 | How much does your overall satisfaction with the product correspond with your expectations (expected satisfaction)? the reality is worse than my expectations x reality is better than my expectations |
| CUSTOMER SATISFACTION 3 | What is your overall satisfaction with the evaluated product compared to the ideal product? extremely low x extremely high |
| CUSTOMER LOYALTY 1 | How often do you buy a similar product from another manufacturer? often - I do not care which manufacturer I buy the product from x never - I buy the product only from this particular manufacturer |
| CUSTOMER LOYALTY 2 | If there are several very similar products on offer, at a very similar price, do you always choose the evaluated product? certainly not - I do not mind, I decide according to the best offer x definitely yes – I always choose the evaluated product – it is the best |
| CUSTOMER LOYALTY 3 | If the price of the product increased (by up to 50% of the current price), would the amount/number of the product you purchase be likely to: significantly decrease x remain the same |
| CUSTOMER LOYALTY 4 | Do you or would you recommend the product to your friends, family or other customers? certainly not - it is better not to recommend the product x definitely yes – I often recommend the product / it is worth more people knowing about it |
Source. Suchánek and Králová (2019).
Ethical Considerations
In compliance with Czech legal regulations, the study from this research does not need to be reviewed by the Research Ethics Committee, still the research was approved by the ethics committee of the university.
Consent to Participate
Informed consent was obtained from all of the research participants before completing the questionnaire.
Author Contributions
Funding
The authors received no financial support for the research, authorship, and/or publication of this article.
Declaration of Conflicting Interests
The authors declared no potential conflicts of interest with respect to the research, authorship, and/or publication of this article.