
Abstract
Internet service providing industry is considered a mainstay for all types of organizations all over the world. In order to be competitive, internet service providers (ISPs) need to realize that all service quality attributes do not carry the same value in customers’ eyes. Therefore, the present study proposes a rationally appealing methodological framework for prioritizing attributes of the SERVQUAL model without restricting them to their dimensions. The responses on 22 attributes of service quality collected from 401 internet users were processed through a triangulation approach comprising three ranking methods: Relative to an Identified Distribution Integral Transformation (RIDIT), Grey Relational Analysis (GRA), and Technique for Order Preference by Similarity to Ideal Solution (TOPSIS). A correlational study of these results was also computed using Spearman’s rank-order correlation coefficient, which proved positive. The consistent outcomes reveal a definite set of users’ priorities for the quality attributes of internet services, and it denies the general thought that the rate of internet service providers is the primary concern of customers. The findings uniquely contribute by highlighting important facets of service quality from customers’ viewpoint. The study would benefit ISPs to empathize customers’ needs corresponding to essential attributes. In this way, they would be able to rationalize the budget for top-ranked features, and redesign operational strategies accordingly.
Introduction
The internet service providing industry is currently considered the backbone for all types of organizations across the world. It is flourishing day by day, and has become a major industry worldwide (World Bank, 2019). Despite the increase in the number of users, its adoption in different sectors is lower than the expected level. The reason could be assigned to substandard quality and disapproval of clients (Keskar et al., 2020). Thus, management and marketers of ISPs need to identify customers’ priorities regarding service quality attributes.
Service quality is an important hallmark of an organization, which attracts and retains its customers. At the same time, it is a measuring tool to analyze the level of service provided to the customers (Nguyen, 2014). Service quality commonly evaluates the variance between customers’ expectations and their perceptions of the service. The perception of service quality is made up of a customer’s perception of the overall superiority of the service (Bitner & Hubbert, 1994). It implies that service quality is essentially assessed on a degree of relativity through customers’ experience, word of mouth, or advertisement (Cravens & Piercy, 2006). Therefore, the connectivity providers are looking for significant service attributes and techniques to fulfill the diverse requirements of their clients. But since this industry serves a vast market, Internet Service Providers (ISPs) face problems differentiating overall service quality attributes from customers’ point of view. Consequently, several studies such as Quach et al. (2016) and Nguyen (2014) have been conducted on ISP service quality to determine the attributes that influence ISP customers’ demand. The numerous approaches are used to assess service quality are, for example, nationally developed indices (Johnson, Gustafsson et al., 2001; Andreassen & Lervik, 1999), Service Quality Indexes (SQI) based on random utility theory and discrete choice models (Eboli & Mazzulla, 2007), Customer Satisfaction Indexes (CSI) (Eboli & Mazzulla, 2009), refined SERVQUAL methodology (model) measured on a RATER scale (Parasuraman et al., 1991). Among these approaches, SERVQUAL is the most widely used technique across all sectors providing services (Morton et al., 2016) due to its suitability for customers’ expectations of all industries.
However, the established literature (e.g., Kumar, 2018; Quach et al., 2016) confirms that several studies were conducted on prioritizing service quality dimensions of the SERQUAL model. Thus, researchers ranked five dimensions of the SERVQUAL model in the last decades (Nazarian et al., 2012; Quach et al., 2016; Thaichon & Jebarajakirthy, 2016), but no study was carried out to prioritize individual constituents of the model to analyze the attributes that remarkably sway customer satisfaction. These preceding studies assume that quality improvement decisions are driven mainly by prioritizing quality dimensions, making it difficult to assist in scrupulous decision-making. Therefore, a rational solution to gain a competitive advantage would be prioritizing quality attributes rather than the SERQUAL model’s dimensions to overcome difficulties in making customer-focused strategic decisions. That is, if needs are set precisely, management would be able to take satisfactory actions for improving quality (Kumar, 2018; Quach et al., 2016). Considering these arguments, the following research questions arise: In what priority order do service quality attributes (regardless of dimensions) define customers’ expectations from the perspective of internet service providers? Is the method applied to rank these attributes reliable?
In this context, the current study has been designed to array service quality attributes (without restricting them to their dimensions) from customers’ perspectives about services provided by ISPs. An analytical triangulation approach comprising three techniques has been deployed to set priorities based on customers’ demands. In this approach, more than two analyzing techniques are used to study, examine, or evaluate the dataset for validation (Hussein, 2009). The techniques used in this study are: Relative to an Identified Distribution Integral Transformation (RIDIT), Grey Relational Analysis (GRA), and Preference by Similarity to Ideal Solution (TOPSIS), followed by Spearman’s rank-order correlation. This research would help distinguish valuable attributes that achieve more customers’ satisfaction to enhance ISPs’ quality of services. Thus, findings would be invaluable for ISPs who, considering budgetary constraints, may focus on a few attributes that preponderate customers’ requirements.
In Section 2, we review the related work in the service quality of ISPs. Section 3 presents the methodology adopted for the current study. Section 4 describes the triangulation approach applied for the study. The stepwise description of RIDIT, GRA and TOPSIS analysis has been presented. Section 5 elaborates data analysis and results, whereas section 6 discusses these findings. Finally, sections 7 and 8 provide the conclusion and future directions, respectively
Literature Review
Nowadays, ISP organizations are facing a challenge to understand customers’ demands and levels of satisfaction. According to a World Bank (2016), customers’ level of satisfaction concerning ISPs is very low. The primary reason for this is the inability to obtain detailed documentation or a survey report on critical problems and weak service areas of ISPs (Thaichon, Lobo, Prentice, et al., 2014). The other reason could be the inability to find the proper solution to these problems and weak service areas. In this regard, the present study draws on the literature of both service quality and its prioritizing methods to develop a better understanding in the context of ISPs.
Internet service is a process in which different devices are used to send and receive information over a long distance (Nguyen, 2014). It creates a powerful effect on the economy; the US is an excellent example of it, as per Gruber (2005). There are reasons to accept that the role of service quality is vital in high-tech services to modify a customer’s acceptance. Due to its strong and extensive impact, internet service providers try to pay maximum attention to augment the service quality. Moreover, detailed research has been done in order to measure the effects of service quality dimensions on ISP (Pathak et al., 2018; Thaichon & Jebarajakirthy, 2016). We have found from the literature that diverse research has been conducted to find the relation between customers’ expectations and quality of services, as well as between customer satisfaction and service dimensions (Miranda et al., 2018; Tommasetti et al., 2017). ISP services’ whole philosophy and success depend on the quality (Quach et al., 2016). In 1982, Boulding et al. (1993) defined services as immaterial procedures portrayed as exercises instead of particular concrete items (Agwu et al., 2018; Rezaei et al., 2018). Strombeck and Shu (2014) stated that quality talks about a product or service, which is error-free, or the attributes of a product or service that fulfills user needs. Various researchers defined service quality in different words, but the crux is that the service is said to be quality when users’ requirements regarding services become fulfilled (Felix, 2017). Referring to previous research, it has become necessary to develop a hierarchy process to tell priority demands related to services of ISPs to the customers (Thaichon, Lobo, Prentice, et al., 2014).
Earlier studies proved that customer satisfaction is an antecedent of service quality (Parasuraman et al., 1988). The other fact is that if a customer did not achieve a level of satisfaction, it is evident that he\she would change the firm, and never recommend it to anybody (Ali et al., 2015). The higher satisfaction level will have the higher potential for customers to repurchase the services or products. It is vital in attaining customer loyalty, and in addition, it enables the organizations to expand market share (Agwu et al., 2018). There are different meanings of customer satisfaction, as well as debates over this issue as customers can or cannot satisfy with the same perceived level of satisfaction.
Service providers that satisfy their customers will keep more customers, increase loyalty and earn more profits (Kumar, 2018). Many researchers firmly believe that the idea of customer satisfaction is not only a business objective but also a debatable service quality or marketing concept. Customer satisfaction may be well-defined as an “attitude” on the series of contacts. Gong and Yi (2018) asserted that the customers’ satisfaction depends on the global evaluation of service quality, and at every single argument of collaboration between products/services providers and customers, customers will have their quality judgments. Besides, Dimyati and Subagio (2018) described several consumer behavior models, where customers’ satisfaction determined the post-purchase evaluation based on the outcome of the products or services. The accumulation of positive service experiences could also increase customer satisfaction (Gao & Lai, 2015). In a nutshell, customer satisfaction is the fulfillment of customers’ expectations. Oliver (2010) described this as an outcome of the product or service, or its attribute, providing a pleasant level of satisfaction related to expectation.
The expectation is influenced by previous experience. If the previous experiences have been met by that time, the existing desire will be acclimated with the more elevated amount of satisfaction (Pizam et al., 2016). In practice, when their expectations meet the services delivered results and procedures, customers will be satisfied. Customers have set different expectations conditional to the context. In the process of purchasing, the expectation is the definite outcome in terms of satisfaction. When we talk about service quality, the expectation will drive the customers’ requirements and needs. Miranda et al. (2018) stated that expectations are an outcome of customer’s different experiences and market analysis. Choi (2013) indicated that customer expectations raise what the customers think a provider should offer. It is also observed that customers’ expectations change irregularly with the invention of modern technologies, the likelihood of society and the used services. This is why it is probably difficult for marketers to understand the actual expectation of customers, but it is also imperative to hold the changing graph of expectations in every period. Zeithaml and Bitner (2003) determined that this is beneficial for companies as this trend reduce the risks of losing customers to other competitors.
Overall, the absolute service performances, past experiences, emphatic policies, and the defined steps of positioning strategies employed by service providers substantially impact customer expectations. All of these aspects will develop the anticipated services in customers’ minds. Customers can distinguish service quality due to inconsistencies between the expected service and perceived service.
Quach et al. (2016) contends that the customers’ acuity of service quality is the fundamental factor for the success of services. Parasuraman et al. (1988) well described that customers expect service providers to offer what they need instead of what providers would have to offer. Parasuraman et al. (1988) categorized customers’ acuity about service quality into five dimensions. The study initially identified 97 attributes that directly affect the quality of service. These attributes were categorized into 10 service quality dimensions. Then authors collapsed these 10 dimensions into 5 with 22 items. These dimensions are famous for the acronym RATER to represent reliability, assurance, tangibles, empathy, and responsiveness. Various researchers (Hizam & Ahmed, 2019; Kondasani, 2016; Margolis & Providencia, 2021; Miranda et al., 2018; Panda & Kondasani, 2017) have highlighted the SERVQUAL model’s applicability because it fits all industries to identify customer expectations. The other good side of SERVQUAL is that it also deals with customized and personalized service attributes, whereas other quality models do not cover it (Ramanathan et al., 2018; Rezaei et al., 2018; Saeedpoor et al., 2015).
The reliability dimension in this service industry is related to the primary service performance. Internet reliability quality dimension includes quick response, problem-solving as it arises, quality internet delivery on time and strong signal (Liu et al., 2015). Previous research also reveals that up-to-date and reliable information sources affect the service offerings and result in the right way (Nguyen, 2014), and construct a reliable connection between service providers and their users (Thaichon & Jebarajakirthy, 2016). Assurance emphasizes the employees’ know-how, knowledge and skill to convey a sense of trust in the service provider to the customer. Tangibles deal with the physically appealing attributes, including infrastructure and equipment that facilitates internet connection. However, domestic Internet services customers are not capable of seeing what sort of services their ISP owns or leases. For them, the tangibles are linked to service attributes that physically exist, for example, modern equipment, visually appealing facilities, well-dressed employees and other amenities (Nguyen, 2014). Under empathy, customer care and individual attention are discussed. Empathy refers to the service provider’s careful and individualized attention to its customers. Responsiveness refers to the willingness of employees to perform service quickly and to assist the user. Abdolvand et al. (2006) emphasized that service providers must focus on providing better customer care to improve their quality of service. A survey result of the Turkish telecommunications industry reveals that an important factor contributing to perceived quality is the efficient handling of customer complaints (Nguyen, 2014). Similarly, a customer who receives the service provider’s prompt and reasonable response upon facing a service failure is strongly recommended to assess the organization’s service level (Panda & Kondasani, 2017). The established literature (e.g., Kumar, 2018; Pakdil and Harwood, 2005) confirmed that several studies had been done on prioritizing service quality dimensions without distinguishing the individual items.
Considering the above discussion, ISPs must evaluate not only dimensions but also service quality attributes that affect customer satisfaction and retention. These attributes can be helpful for ISPs to improve their level of service to get customer satisfaction. Keeping in mind the end goal of distinguishing the most valuable customer characteristics, this study has applied techniques to rank elements, factors, or attributes. Multi-criteria decision-making (MCDM) approaches such as The Relative to an Identified Distribution Integral Transformation (RIDIT), Technique for Order Preference by Similarity to Ideal Solution (TOPSIS) and Grey Relational Analysis (GRA) are good and systematic ways to rank items (Bhattacharya & Kumar, 2017; Kondasani, 2016). Therefore, this research has employed a triangular approach based on RIDIT, GRA, and TOPSIS analyses to better order attributes from customers’ perspectives.
Bross first introduced RIDIT analysis in 1958, and later different researchers improved it (Beder & Heim, 1990; Bhattacharya & Kumar, 2017). RIDIT analysis is an effective method to study the data, following the Likert scale (Bross, 1958). There are no assumptions in RIDIT analysis for the population distribution of the study, so it is a “distribution-free” analysis (Beder & Heim, 1990; Bhattacharya & Kumar, 2017; Bross, 1958). Kruskal–Wallis (W) is a statistical test in RIDIT analysis, which confirms the results for “goodness of fit” (Bhattacharya & Kumar, 2017; Sadhukhan et al., 2015). On the other hand, TOPSIS was developed by Hwang and Yoon (1981). The best solution should be close to the positive ideal solution and far away from the negative ideal solution. Mostly, the positive ideal solution set comprises all the important (or highest) possible values from the positive criteria, whereas the negative ideal solution set consists of all the less important (or lowest) possible values from the negative criteria. In Deng (1989) built up the theory of the grey system to address system uncertainty. Grey Relational Analysis (GRA) is a quantitative analysis technique used to investigate the relationship between components. This technique helps identify quantitative and qualitative relationships with insufficient information from numerous factors.
Methodology
Sample and Procedure
This research aims to prioritize the items of the SERQUAL model (without restricting them to their dimensions) from customers’s perspectives about the services provided by internet service providers. In order to investigate the suggested research problem using a quantitative technique, data were collected through 22 items of the SERVQUAL questionnaire modified for ISPs measured on the Likert scale. Non-probability based convenience sampling technique was employed to contact internet users of ISPs at Lahore (a provincial capital), Pakistan. For this research, a person was supposed to be an internet user if he/she uses internet service daily. This can be any person who can navigate the Web browser (Thaichon, Lobo, & Mitsis, 2014). The respondents were ensured anonymity and confidentiality, and they provided their written consent to participate in the survey. The overall response rate of the study was 87.4% (437/500), of which 7.2% were inefficiently or improperly filled. Therefore, the valid response rate of the study was 80.6% (401/500). The final sample size corresponds with the suggested minimum by the previous studies conducted using the same techniques (e.g., Arshad Ali et al., 2020; Majumdar et al., 2020). The respondents gave their written informed consent before the response. The data were collected through a self-administered questionnaire by approaching them physically through personal contacts to obtain a high response rate. We used residential internet users as subjects for this study because they can be representatives of the population.
As a pre-requisite, the respondents were 18 years of age who used internet services. The descriptive statistics reveal that 47.4% (199) of the sample comprised males, while 52.3% (211) included females. Total responses with complete data are 401, and 63.6% of responses were of persons aged 26 to 35. The age group above 45 years contained only 2.7% of the respondents. The survey included 59.4% employees and 13.7% students who filled in the questionnaire.
Furthermore, in order to increase the validity or rigor of results, the triangulation strategy has been adopted (Golafshani, 2003). Triangulation enhances scientific rigor by validating the results obtained from one methodological procedure with results obtained from a different procedure. It also addresses perspectival biases and omissions introduced because each specific method or technique is suited to investigating certain types of questions and aspects of the phenomenon rather than others. Moreover, this approach intends to reveal complementarity, convergence and dissonance between the findings (Hussein, 2009). There are various types of triangulation (Denzin, 1978; Farquhar et al., 2020; Jick, 1979): (1) Methodological (multiple methods in a single study), (2) Data (Multiple data collection techniques or data sources), (3) Analytical (Multiple analytical techniques on the same dataset within a single-method study), (4) Theoretical (Multiple theories and paradigms for the same dataset), (5) Contextual (Involving multiple contexts of settings, locations, organizational units and time), and (6) investigator (Multiple researchers, collecting data or interpreting results).
Analytical triangulation has been used to establish ex-post reliability of results. This technique utilizes multiple strategies for investigating the same dataset to validate (Hussein, 2009). It strengthens the validity, reliability and replicability of the results, and widening the span of inquiry. In this way, the results are robust to the technique used, eliminating endogeneity issues (Nielsen et al., 2020). The current research has developed triangulation while using three prioritizing analytical techniques: RIDIT, GRA, and TOPSIS.
Techniques of the Study
RIDIT Analysis
The process of RIDIT analysis is given below in detail (Bross, 1958; Sadhukhan et al., 2015). Let’s presume a list of n categories with m items from the “extremely important” to the “unimportant” scale. Then,
Total responses can be severed as a reference dataset if the identification of the population is not easy. Therefore, the selected sample is used as a reference dataset.
Calculate fj (frequency) for all response categories, where j = 1, 2, 3, . . ., n.
Calculate Fj, the accumulated frequency mid-point for all responses’ categories.


For reference dataset, calculate RIDIT value called Rj for all responses categories, where j = 1, 2, . . ., n.

For the Likert scale survey, the total number of responses is N. By definition, the normal estimation of R is always 0.5 for the reference dataset.
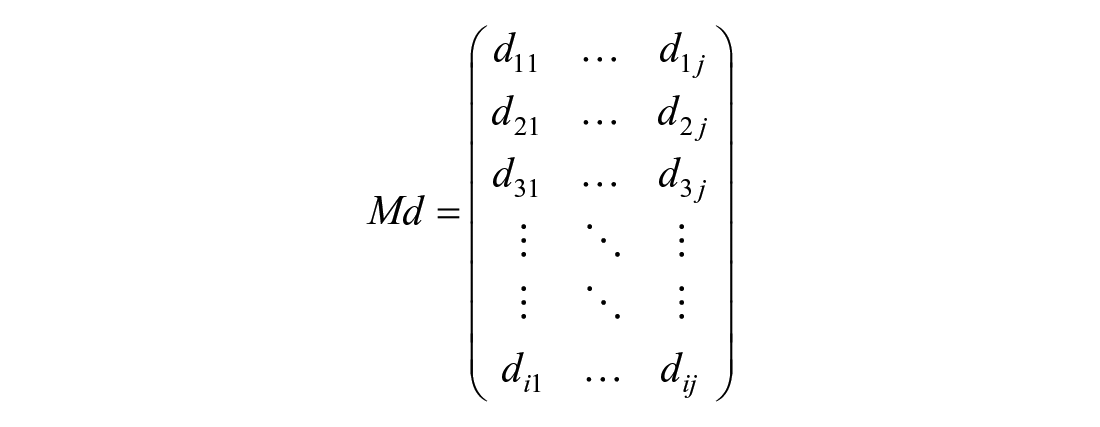
For comparison datasets, calculate RIDITs and mean RIDITs. A comparison dataset includes the response frequency for each Likert scale item category. Because this illustration contains “m” Likert scale items, there will be an “m” comparison dataset.
a. Calculate RIDIT value rij for all scale items categories, where i = 1,2, . . ., n.

πi is the category j frequency for the ith scale item, and π
i
is a short form for the summation of the scale item i frequencies for all categories, that is,
b. Calculate means RIDIT ρ
i
for all Likert scale items.
c. Calculate the interval of confidence for ρ
i
. If the size of the reference dataset is enormous compared to the size of any comparison dataset, the confidence interval of 95% of any ρ
i
is:
d. Test the following hypothesis using Kruskal–Wallis statistics W.

W follows an (m–1) degree of freedom distribution of χ2. If
GRA (Grey Relational Analysis)
The GRA relational analysis introduced below is a process for analyzing discrete data series in grey system theory, and is suitable for data collected through the Likert scale.
The GRA analysis proceeds through seven steps. The process is as follows:
1. Generating reference data series

where n is the number of participants. The xo reference data series is generally composed of n values that represent the most favored responses.
2. General comparison data series

where i = 1, 2, . . ., k.
k is the number of items on the scale. Therefore, there will be k comparison data series and n values in each data series.
3. Computing the difference data series Δ i .

4. Finding the global maximum value Δmax and minimum value Δmin in the data series.

5. Transforming each data point in each difference data series to the grey relational coefficient. Let ϓi(j) represents the jth data point’s grey relational coefficient in the ith data series, then

where Δi(j)is the jth value in Δi difference data series, ω is a value between 0 and 1. The coefficient ω is used in the data series to compensate for the effect of Δmax being an extreme value. Generally, the ω value can be set to 0.5.
6. Gray relational grade is computed for each data series of differences. Let ωi represent grey relational grade for the ith scale item and assume that data points in the series are of the same weights,

The magnitude of
7. Sorting τ values into descending or ascending order to facilitate the managerial interpretation of the results.
TOPSIS Analysis
The approach for TOPSIS takes six steps and has been given below:
The corresponding normalized value rij is defined as:
where wij is the weight attached to criterion j.

where J and J′ are benefit and cost criteria, respectively.

and


Validating Results of Rank Order Among Triangulation
It is evident that the three ranking techniques are expected to produce somewhat different priority orders of service attributes. Therefore, it often becomes challenging to select the final priority order result emanating from a particular ranking method. In such a situation, a test statistic called Spearman’s rank-order correlation is estimated.
Spearman’s rank-order correlation
This test statistic calculates the monotonicity of the relationship between the rank order results of any two ranking techniques. The following equation shows the test statistic:
In this study, the outcomes from the three techniques were compared pairwise, and the results of the ranking order from a particular technique were selected based on their statistical correlational values.
Results
Firstly, a descriptive analysis of each variable was conducted. Secondly, RIDIT, GRA, and TOPSIS analyses were performed to juxtapose the outcomes. After that, Spearman’s rank-order correlation was applied to these methods to check monotonicity among the outcomes.
To know the customers’ expectations for ISPs, 22 attributes of SERVQUAL have been used, as shown in Table 1.
Attributes and Their Codes.

RIDIT Analysis
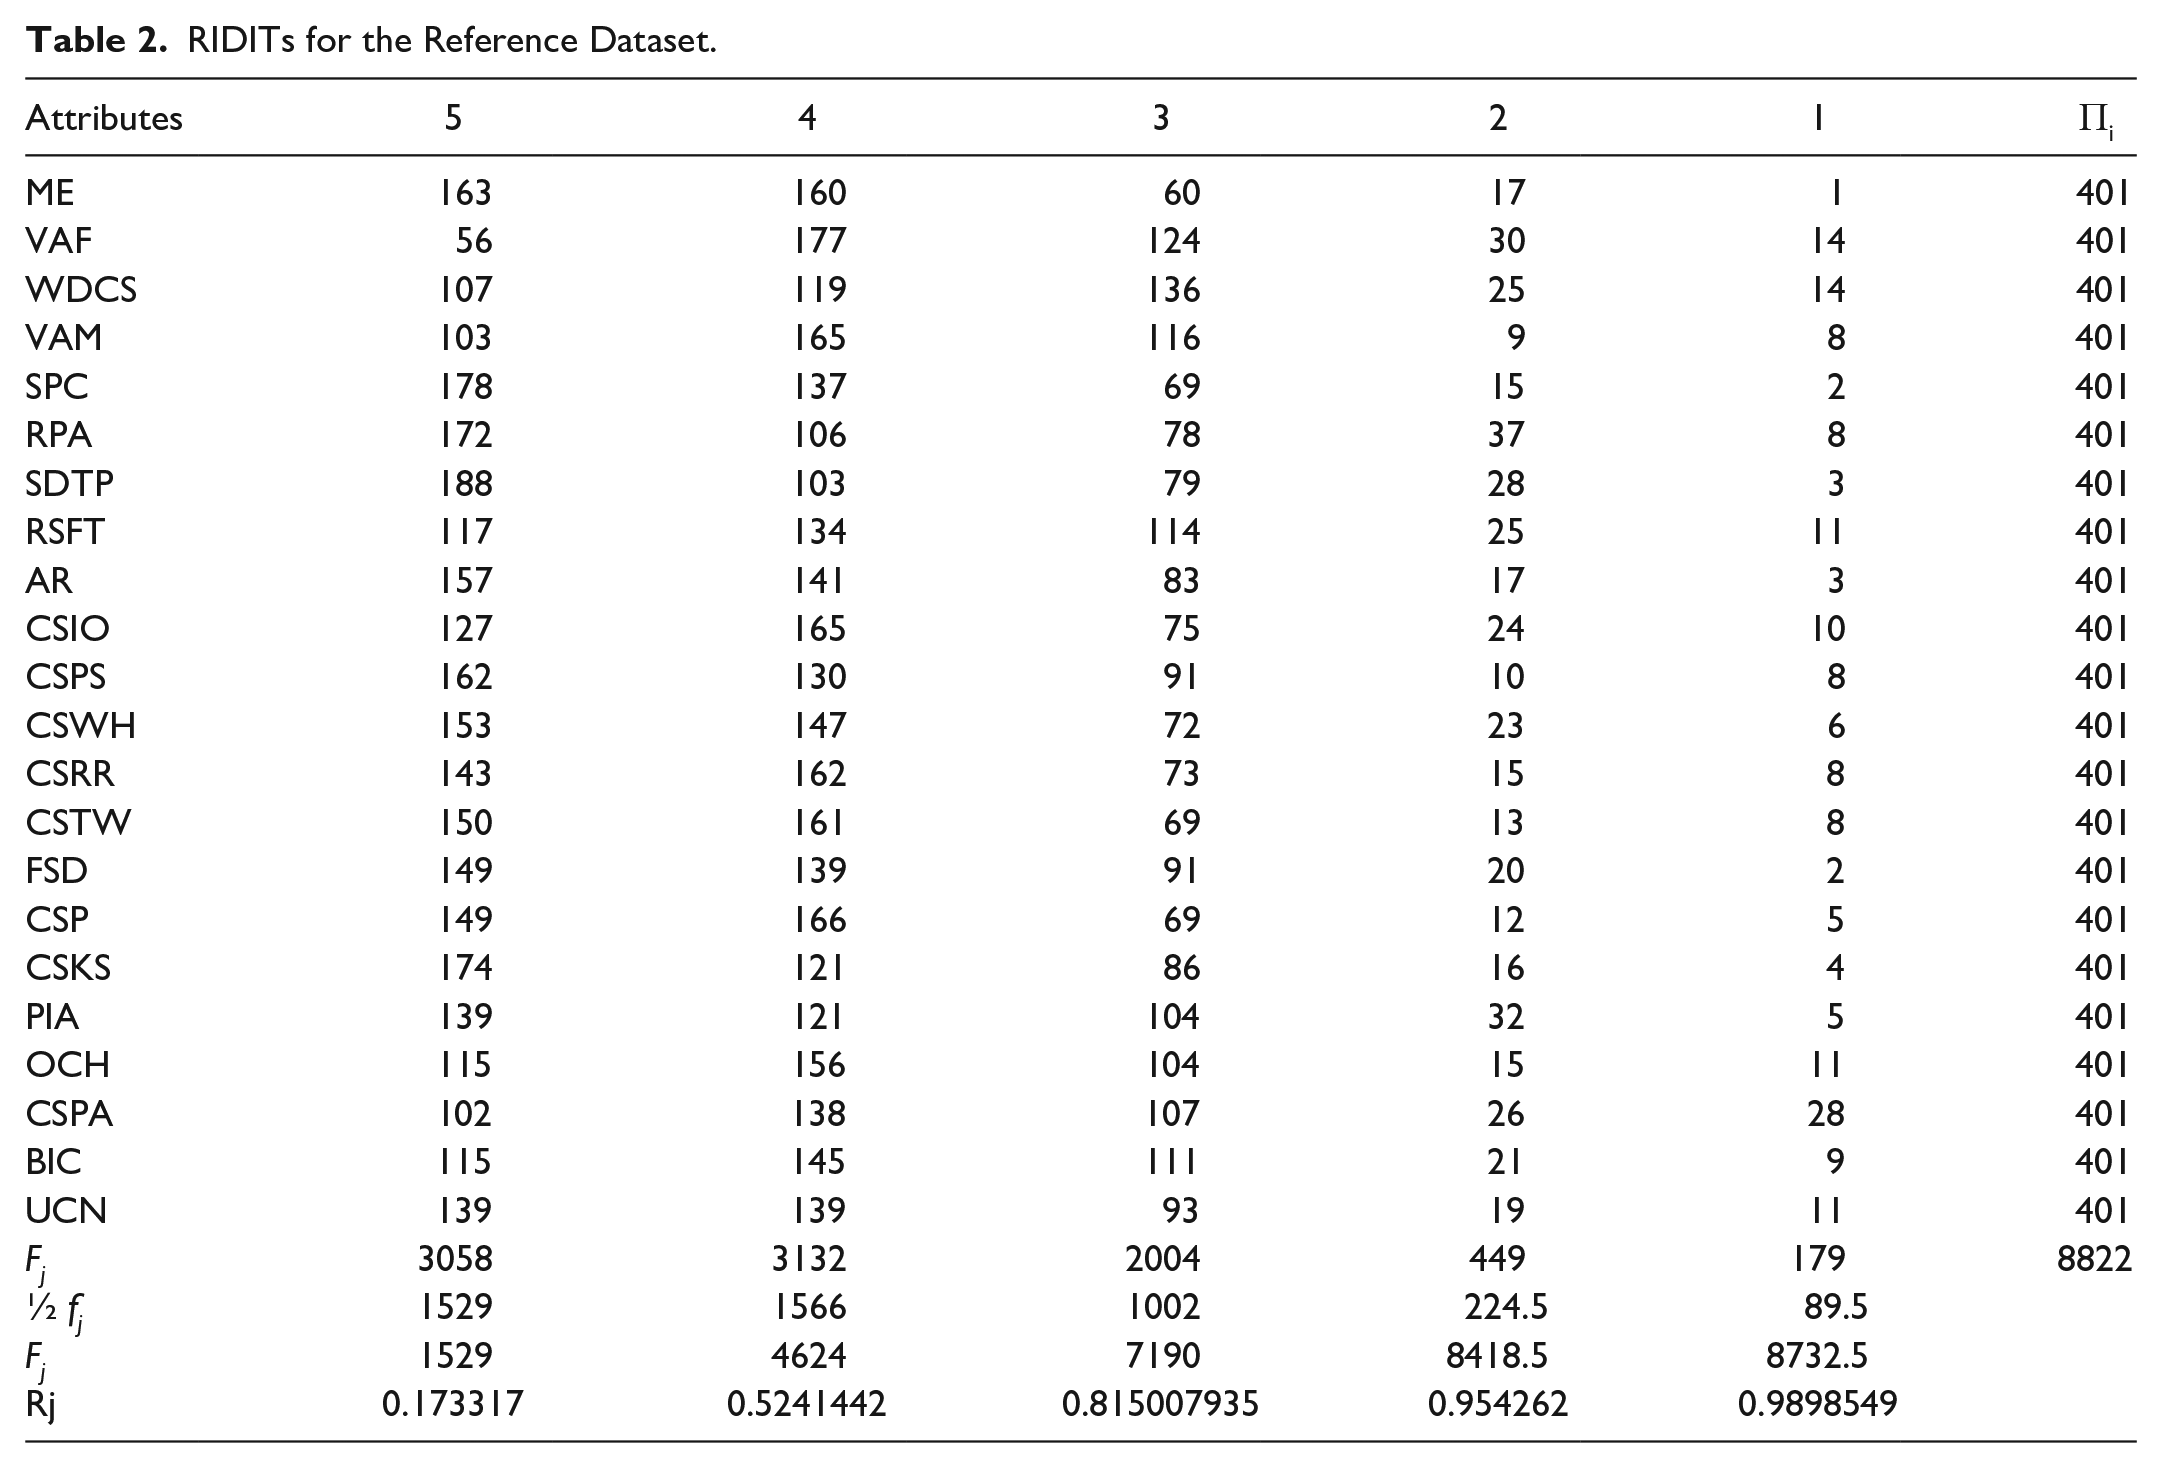
The results from the RIDIT analysis have been recapitulated in Tables 2 and 3. The customers’ expected service quality for the internet service providing industry is taken as the reference dataset.
RIDITs for the Reference Dataset.
RIDITs for the Reference Datasets and Prioritization of Attributes.

Table 2 illustrates customers’ responses in the form of frequencies and presents RIDITs of the reference dataset for each category in the last row.
Kruskal–Wallis (W) calculation
The statistical relevance of RIDIT analysis was assessed based on Kruskal–Wallis (W) value. The Kruskal–Wallis (W) for customer expected attributes of service quality is calculated as follows:
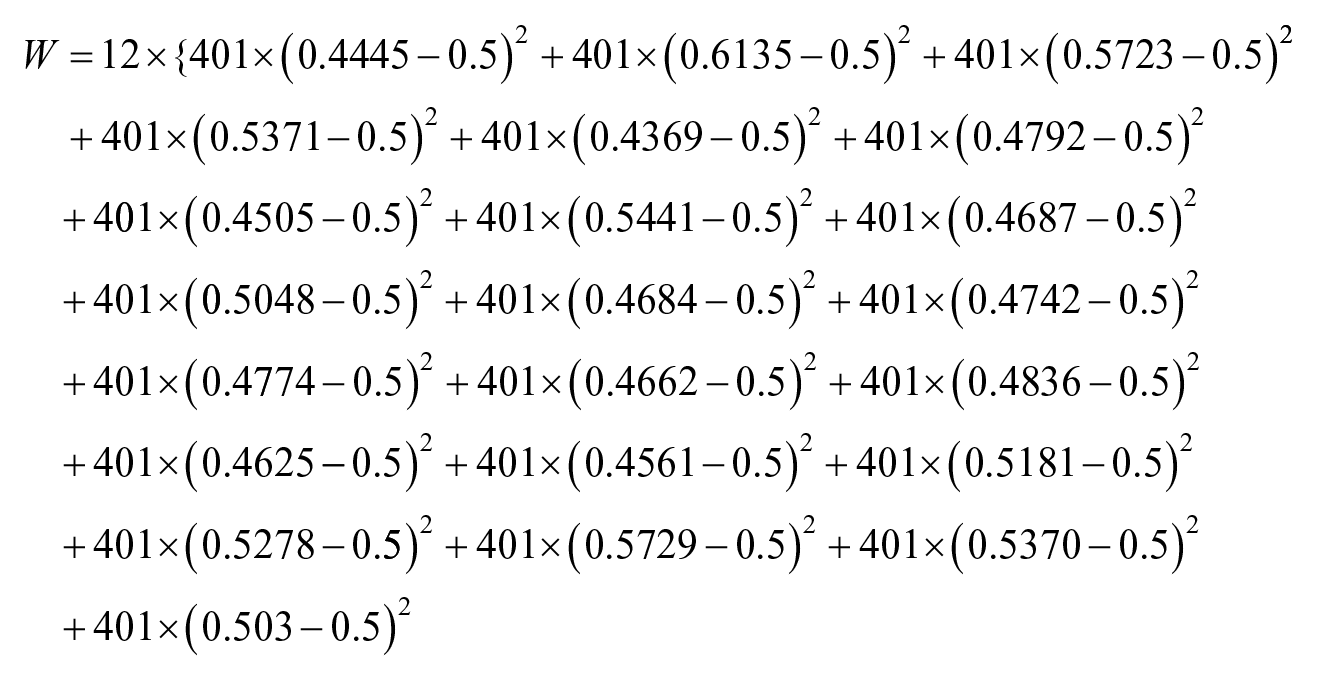

Since Kruskal–Wallis W is significantly large, it is concluded that internet users’ priorities order is extraordinarily different from scale items order. In Table 3, ρ i values represent that these attributes have different levels of importance in customers’ opinions.
After this analysis, 22 attributes of the SERVQUAL model have been organized in priority order according to customers’ expected internet services. The most important attributes influencing the selection of an ISP are SPC, ME, SDTP, CSKS and CSP, whereas the least essential attributes are VAM, RSFT, WDCS, CSPA, and VAF.
GRA (Grey Relational analysis)
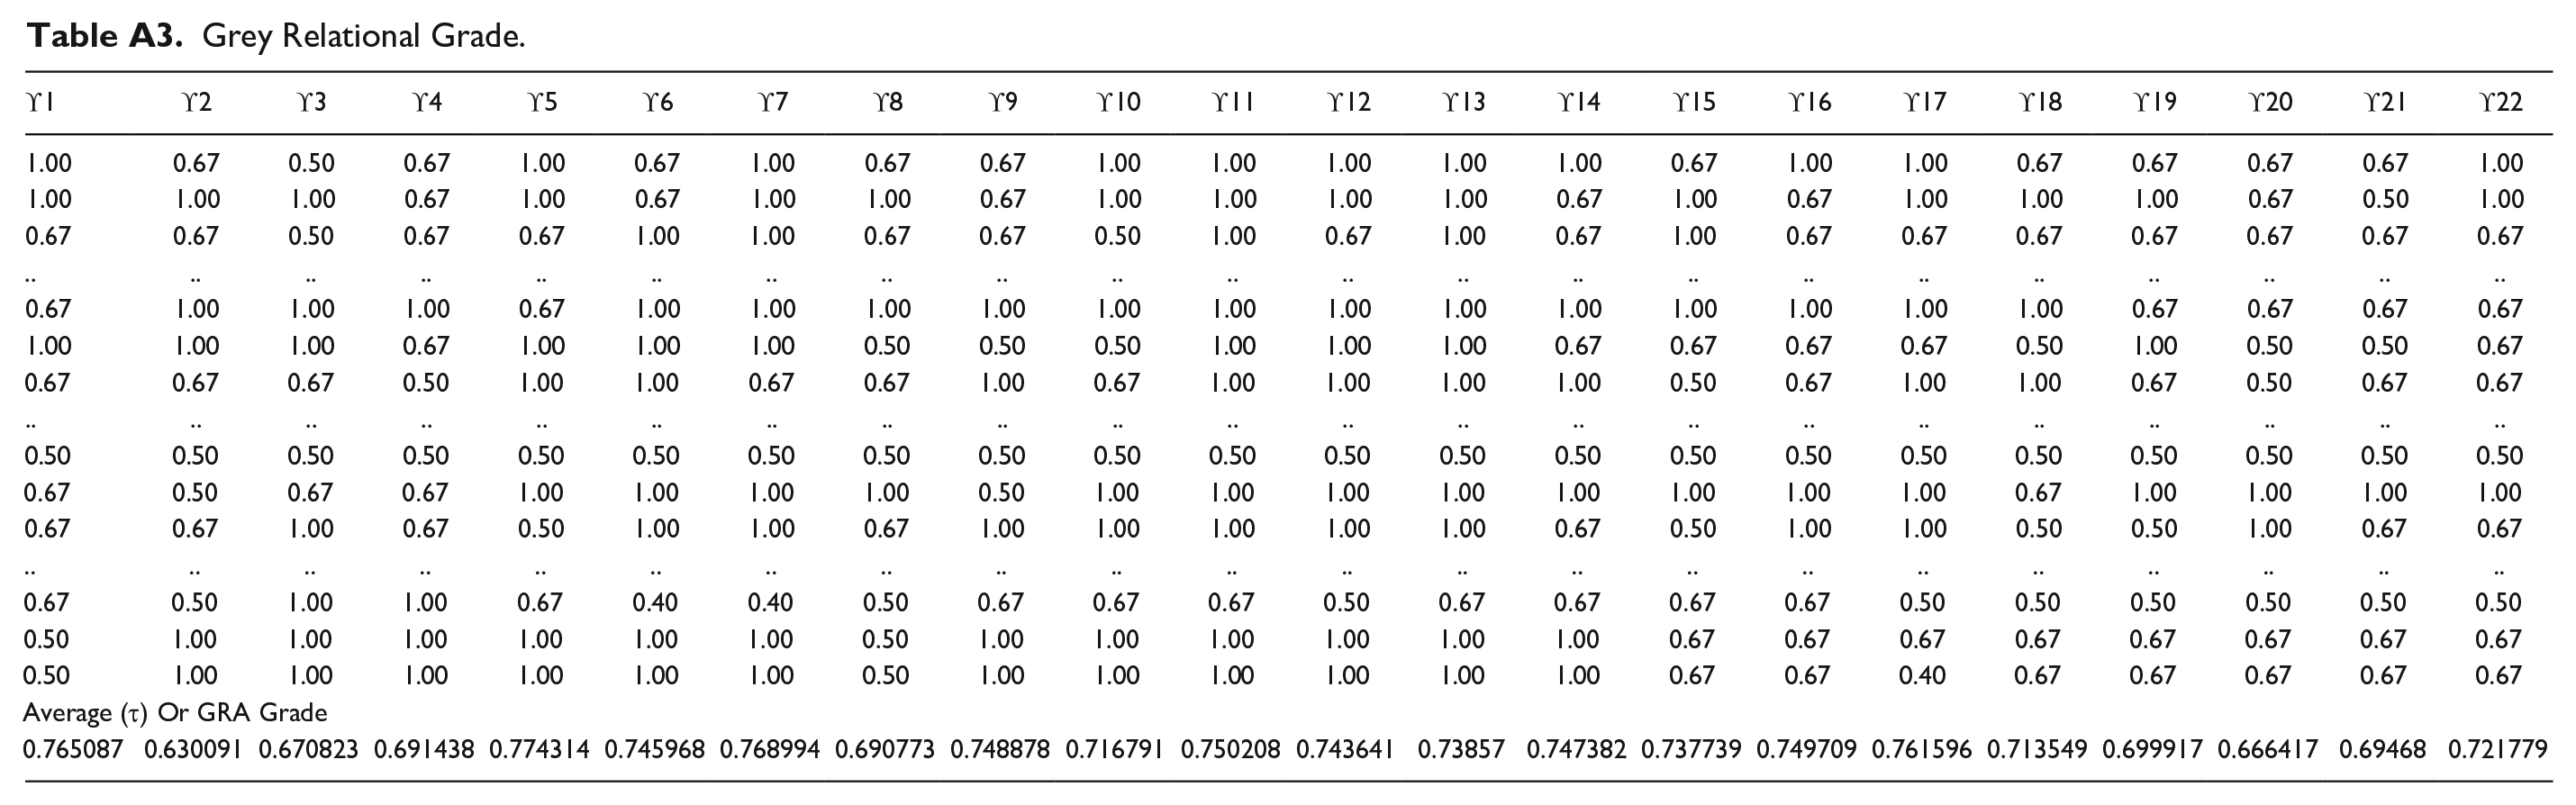
The GRA method was also applied to the same dataset, which contains responses of ISPs users. The outcomes of the GRA method are calculated and summed up in the given Tables A1–A3 (shown in the Appendix) and 4.
Calculated GRA scores and the GRA ranks for each of the attributes have been shown in Table 4. According to the opinion of 401 ISP customers, SPC (Services as per commitment) is the most critical attribute. Second is SDTP (Services delivered at times promised); ISP provides good service on committed time without compromising quality. The third important attribute is ME (Modern Equipment) in the ISP industry. It expresses that the ISP customers give high importance to services committed within the time frame given by internet service providers.
Ranking Through GRA Analysis.

TOPSIS Analysis
For TOPSIS analysis, 22 service attributes were treated as alternatives, whereas importance levels as selection criteria for the attributes preference, where the level of importance were Likert scale points (i.e., 1, 2, 3, 4, and 5) with equal weights.
The positive ideal solution maximized the importance levels 5 and 4 while minimized the priority levels 1 to 3. On the other hand, the negative ideal solution maximized the order levels 1 to 3, and minimized the importance levels 4 to 5. In the end, TOPSIS scores (Pi) were calculated for all service attributes from positive ideal solutions and negative ideal solutions denoted by Si+ and Si− respectively, as shown in Table 5.
TOPSIS Analysis for the Datasets and Prioritization of Attributes.

According to the opinion of 401 ISP customers, ME (Modern Equipment) is the most critical attribute. Second is SPC (Services as per commitment); ISP provides good service without compromising quality. The third essential attribute is CSTW (Customer service staff are trustworthy) in the ISP industry. It emerged that the ISPs customers give great importance to commitments and trust made by internet service providers.
Attributes’ Prioritizing Comparison
As previously discussed, the three methods applied for data ranking in the current research are well-known, but these methods are different in their approaches and steps, thus ordering the attributes differently. The hierarchy of attributes gained from RIDIT, GRA and TOPSIS methods are compared as portrayed in Table 6.
Attributes’ Prioritizing Order obtained from RIDIT, GRA, and TOPSIS.

It is interesting to observe from Table 6 that 5 out of 22 attribute positions given by the three methods are the same, while 9 out of the remaining 17 positions assigned by the two analyses are similar. After comparing these three methods (RIDIT, GRA, and TOPSIS), the findings reliably show that higher importance has been given to the service attributes: ME, SPC and SDTP.
Spearman’s rank-order correlation
In order to check the relationship among rankings obtained from these techniques: RIDIT, GRA, and TOPSIS, Spearman’s rank-order correlation coefficients have been calculated (Sadhukhan et al., 2015). The summary results in the form of a pairwise correlation of rank orders between any two ranking methods for SERVQUAL items have been presented in Table 7.
Pairwise Correlation of Rank Orders Between Ranking Methods.

In light of Spearman’s correlation results, all three methods have a strong relationship. However, RIDIT analysis has a more substantial relationship with both TOPSIS and GRA.
Hence, these three strategies (RIDIT, GRA, and TOPSIS) ingrained among researchers show consistency in the outcomes. However, the RIDIT analysis has an additional statistical comparison test between the Kruskal–Wallis (W) and the chi-squared, which, analyzes the outcomes for the goodness of fit. Besides, Spearman’s rank coefficients reveal that attributes’ ranking obtained from RIDIT analysis is strongly associated with the other two ranking techniques. In short, the outcomes from all these three techniques are satisfactory, but the prioritization of SERVQUAL attributes obtained from the RIDIT is considered better.
Discussion
Pakistan is the 10th largest customer globally, with more than 100 million internet users (Pakistan Telecommunication Authority [PTA], 2020). Since ISP’s quality influences customer satisfaction (Ariff et al., 2013), it is vital to study the service quality parameters of the internet connectivity in such an economy. Overall service quality is a determining factor that drives the wave of customers’ perception toward ISPs (Thaichon, Lobo, & Mitsis, 2014); however, the dimensions of service quality impact customer satisfaction differently (Joudeh & Dandis, 2018). In this regard, the current study contributes by further investigating the role of each item to increase the granularity of assessing the effect compared with overall service quality and its dimensions. In this research, the authors highlighted the hierarchal importance of each component of the SERVQUAL model in the context of internet service providers (ISPs) through an appealing methodological framework. Furthermore, In order to strengthen the validity, ex-post reliability, and replicability of the results, and widen the span of inquiry, the current research has developed analytical triangulation using three prioritizing techniques: RIDIT, GRA, and TOPSIS.
It was observed that 14 attributes out of 22 ranked by all the three techniques are similar, while the remaining attributes’ ranking was also not so different. Initially, it was discovered through GRA and RIDIT that the main considerable factors are services as per commitment, services delivered at times promised, modern equipment, and customer service staff are trustworthy. These factors are considered the most important factors for the service quality dimension. However, in order to confirm the ranking, and make a convincing opinion about the priorities that customers allocated to the attributes, we utilized Spearman’s rank-order correlation. Spearman’s rank-order correlation revealed that RIDIT analysis is strongly associated with the other two ranking techniques. In light of these research findings, RIDIT analysis results are considered the best. The triangulation approach revealed that internet users give much importance to internet service providers’ commitments and up-to-date technologies. Moreover, the results indicated that attributes like SPC, ME, SDTP, CSKS, and CSP are some of the most critical aspects while CSWT, CSPS, and AR turned out to be essential attributes to fulfill customers’ needs and demands, whereas VAM, RSFT, WDCS, CSPA, and VAF are not too many important attributes.
Although past studies have been conducted to analyze the effect of SERQUAL model dimension-wise rather than item-wise, the recent research (e.g., Barua et al., 2018; Hammoud et al., 2018; Ye et al., 2017) is in agreement with the current research because the items representing the general characteristics have been found significantly related to customer’s satisfaction in various domains. Furthermore, when we analyzed the top-ranked attributes of service quality, the following themes have emerged: Commitment, Equipment, and Service staff’s knowledge, politeness, trustworthiness and promptness. The findings are consistent with the previous regression-based studies. For example, according to Gounaris and Venetis (2002) and Thaichon, Lobo, and Mitsis (2014), trustworthiness, honesty, skillful practices, and level of empathy and consideration of ISP lead to customers’s satisfaction.
The study also revealed that service as per commitment (SPC) is vital to customers’ needs and demands. It contributes a lot to business in terms of generating revenue and creating repute for the brand. Customer service staff having good knowledge of services (CSKS) is explained as providing complete and accurate information to the customers. The survey also shows that every individual does not demand customer service staff’s personal attention, which is less important for the customers. The study further describes that visually appealing facilities (VAF) have less influence on customer attitude and companies should consider that people are not too much interested in their visually appealing facilities. Thus, the study suggests that focusing on specific service attributes would enhance customer satisfaction and reduce costs. Therefore, the managers should consider paying less attention to peripheral features while allocating resources.
Conclusions and Implications
Service quality is emerging as a dynamic approach to gain a competitive advantage in the service industry by fulfilling customers’ relevant demands. The challenging competitive environment of the internet-driven Pakistani sector with more than 100 million users builds pressure on service providers to differentiate themselves with continuous improvement in service quality attributes. ISPs need to get authentic information of the perception of customers about the quality of service they provide. It enables them to devise relevant strategies to avoid customer switching, securing long-term growth.
In this context, this study was conducted to prioritize attributes of the SERVQUAL model for internet service providers from the perspective of 401 internet users using the triangulation approach. In the triangulation approach, more than two analyzing techniques are used to study, examine, or evaluate the data set for the purpose of validation (Hussein, 2009). Three different methods were chosen and juxtaposed to present customers’ preferences. An effective triangulation approach has been proposed by combining Relative to an Identified Distribution Integral Transformation (RIDIT), Grey Relational Analysis (GRA) and Preference by Similarity to Ideal Solution (TOPSIS) analyses. Furthermore, Spearman’s correlation confirmed that RIDIT analysis outcomes are more appropriate for this study.
The study has contributed to the literature of service quality in the context of internet service-providing companies. The findings can be regarded as robust due to the triangulation design of the study. Service quality as a whole is broadly viewed as a fundamental determining component of customers’ satisfaction. Even though service quality is a multidimensional concept, not all dimensions affect customers’ utility uniformly (Quach et al., 2016). Further on these lines, this study proposes that individual items contribute differently to the satisfaction level of internet service users, which is essential for the sustainable success of ISPs. It would enable ISPs to curtail switching and churn rates by analyzing the hierarchy of the attributes of the SERVQUAL model.
The outcomes of this research could be a valuable asset to aid managers of ISPs to focus on enhancing the satisfaction of customers and minimizing long-term budgeting by paying attention to essential attributes only. Succinctly, it would surely be a comprehensive tool for practitioners and academicians to act as a way forward for ISPs to appreciate their customers’ expectations.
Limitations and Future Research
Although the present research offers valuable insights, it has certain limitations that can act as an opportunity for future research. First, the ranking of ISPs service quality attributes was carried out on the community from a generic perspective without focusing on any organization. More studies should be conducted in different service organizations and diverse cultural contexts to generalize the ranking patterns of service quality attributes. Furthermore, data were collected using convenient sampling, while probabilistic techniques are recommended for future investigations to increase the representativeness of the sample.
Since internet users are not homogeneous, the elements of service quality might have diverse effects across different clusters of internet users. Therefore, an investigation of these groups is recommended to formulate market segmentation strategies. Similarly, longitudinal research design may be helpful to comprehend the changing patterns of customers’s cognition and behaviors with time. Additionally, research scope is limited to SERVQUAL model attributes, while future studies should explore other service attributes and service quality models. The researchers should also consider ranking techniques other than RIDIT, GRA, and TOPSIS.
Footnotes
Appendix
Grey Relational Grade.
| ϒ1 | ϒ2 | ϒ3 | ϒ4 | ϒ5 | ϒ6 | ϒ7 | ϒ8 | ϒ9 | ϒ10 | ϒ11 | ϒ12 | ϒ13 | ϒ14 | ϒ15 | ϒ16 | ϒ17 | ϒ18 | ϒ19 | ϒ20 | ϒ21 | ϒ22 |
|---|---|---|---|---|---|---|---|---|---|---|---|---|---|---|---|---|---|---|---|---|---|
| 1.00 | 0.67 | 0.50 | 0.67 | 1.00 | 0.67 | 1.00 | 0.67 | 0.67 | 1.00 | 1.00 | 1.00 | 1.00 | 1.00 | 0.67 | 1.00 | 1.00 | 0.67 | 0.67 | 0.67 | 0.67 | 1.00 |
| 1.00 | 1.00 | 1.00 | 0.67 | 1.00 | 0.67 | 1.00 | 1.00 | 0.67 | 1.00 | 1.00 | 1.00 | 1.00 | 0.67 | 1.00 | 0.67 | 1.00 | 1.00 | 1.00 | 0.67 | 0.50 | 1.00 |
| 0.67 | 0.67 | 0.50 | 0.67 | 0.67 | 1.00 | 1.00 | 0.67 | 0.67 | 0.50 | 1.00 | 0.67 | 1.00 | 0.67 | 1.00 | 0.67 | 0.67 | 0.67 | 0.67 | 0.67 | 0.67 | 0.67 |
| .. | .. | .. | .. | .. | .. | .. | .. | .. | .. | .. | .. | .. | .. | .. | .. | .. | .. | .. | .. | .. | .. |
| 0.67 | 1.00 | 1.00 | 1.00 | 0.67 | 1.00 | 1.00 | 1.00 | 1.00 | 1.00 | 1.00 | 1.00 | 1.00 | 1.00 | 1.00 | 1.00 | 1.00 | 1.00 | 0.67 | 0.67 | 0.67 | 0.67 |
| 1.00 | 1.00 | 1.00 | 0.67 | 1.00 | 1.00 | 1.00 | 0.50 | 0.50 | 0.50 | 1.00 | 1.00 | 1.00 | 0.67 | 0.67 | 0.67 | 0.67 | 0.50 | 1.00 | 0.50 | 0.50 | 0.67 |
| 0.67 | 0.67 | 0.67 | 0.50 | 1.00 | 1.00 | 0.67 | 0.67 | 1.00 | 0.67 | 1.00 | 1.00 | 1.00 | 1.00 | 0.50 | 0.67 | 1.00 | 1.00 | 0.67 | 0.50 | 0.67 | 0.67 |
| .. | .. | .. | .. | .. | .. | .. | .. | .. | .. | .. | .. | .. | .. | .. | .. | .. | .. | .. | .. | .. | .. |
| 0.50 | 0.50 | 0.50 | 0.50 | 0.50 | 0.50 | 0.50 | 0.50 | 0.50 | 0.50 | 0.50 | 0.50 | 0.50 | 0.50 | 0.50 | 0.50 | 0.50 | 0.50 | 0.50 | 0.50 | 0.50 | 0.50 |
| 0.67 | 0.50 | 0.67 | 0.67 | 1.00 | 1.00 | 1.00 | 1.00 | 0.50 | 1.00 | 1.00 | 1.00 | 1.00 | 1.00 | 1.00 | 1.00 | 1.00 | 0.67 | 1.00 | 1.00 | 1.00 | 1.00 |
| 0.67 | 0.67 | 1.00 | 0.67 | 0.50 | 1.00 | 1.00 | 0.67 | 1.00 | 1.00 | 1.00 | 1.00 | 1.00 | 0.67 | 0.50 | 1.00 | 1.00 | 0.50 | 0.50 | 1.00 | 0.67 | 0.67 |
| .. | .. | .. | .. | .. | .. | .. | .. | .. | .. | .. | .. | .. | .. | .. | .. | .. | .. | .. | .. | .. | .. |
| 0.67 | 0.50 | 1.00 | 1.00 | 0.67 | 0.40 | 0.40 | 0.50 | 0.67 | 0.67 | 0.67 | 0.50 | 0.67 | 0.67 | 0.67 | 0.67 | 0.50 | 0.50 | 0.50 | 0.50 | 0.50 | 0.50 |
| 0.50 | 1.00 | 1.00 | 1.00 | 1.00 | 1.00 | 1.00 | 0.50 | 1.00 | 1.00 | 1.00 | 1.00 | 1.00 | 1.00 | 0.67 | 0.67 | 0.67 | 0.67 | 0.67 | 0.67 | 0.67 | 0.67 |
| 0.50 | 1.00 | 1.00 | 1.00 | 1.00 | 1.00 | 1.00 | 0.50 | 1.00 | 1.00 | 1.00 | 1.00 | 1.00 | 1.00 | 0.67 | 0.67 | 0.40 | 0.67 | 0.67 | 0.67 | 0.67 | 0.67 |
| Average ( |
|||||||||||||||||||||
| 0.765087 | 0.630091 | 0.670823 | 0.691438 | 0.774314 | 0.745968 | 0.768994 | 0.690773 | 0.748878 | 0.716791 | 0.750208 | 0.743641 | 0.73857 | 0.747382 | 0.737739 | 0.749709 | 0.761596 | 0.713549 | 0.699917 | 0.666417 | 0.69468 | 0.721779 |
Declaration of Conflicting Interests
The author(s) declared no potential conflicts of interest with respect to the research, authorship, and/or publication of this article.
Funding
The author(s) received no financial support for the research, authorship, and/or publication of this article.
Ethics Statement
Ethical review and approval were not required for this study on human participants because the opinion was gathered and analyzed anonymously. Moreover, the results do not discuss exclusive opinion of a certain respondent.