
Abstract
This study examines the effects of business and finance conditions on the stock performances of firms operating in the tourism, hospitality, and leisure industries. This research employs panel-based first- and second-generation estimators, such as Westerlund cointegration, dynamic ordinary least squares (DOLS), and Dumitrescu–Hurlin panel Granger causality tests, to explore long-term links between business conditions, financial development, and tourism growth in major tourist destination countries selected in this study. To our knowledge, this is the first study to attempt to explore this linkage. The long-run estimation underscores that business and finance environments are significant drivers of stock price movements in this industry. Therefore, any shock in business and finance activities will have long-term effects on tourism firms’ stock prices. Moreover, the results show that the most significant factor that explains changes in the tourism stock price is foreign tourist arrivals, indicating that the tourism stock price of major tourist countries is relatively more sensitive to changes in tourist arrivals to the country than other factors. This study proposes a new research question to estimate the effects of the business, financial conditions, and tourism growth on the stock performance of the tourism, hospitality, and leisure industries. Therefore, the results are likely to become vital for policymakers, managers, and asset pricing analysts.
Introduction
Researchers have extensively studied the financial or business performance of firms. In the relevant literature, stock price movements are proxies for forecasting financial performance likely to be affected by the business environment and countries’ macroeconomic trends (M. H. Chen, 2005, 2007b, 2010; M. H. Chen et al., 2005; Hadi et al., 2019; S. Katircioglu et al., 2018). As M. H. Chen (2007b) mentioned, firms’ stock prices need to reflect their real-market values and actual financial performance, as per the efficient market’s theory. Therefore, close connections between firms’ stock movements and business conditions (BCs), and macroeconomic developments should be expected. Recent studies have shown that a positively high correlation exists between BCs and the financial performance of firms (M. H. Chen, 2007b; Jeon et al., 2004; Shaeri & Katircioğlu, 2018).
However, underlying stock valuation states that the stock price reflects all investors’ expectations about a firm’s future earnings. Stock price variations related to BCs change in terms of their impact on firms’ earnings and dividends (Asprem, 1989; Booth & Booth, 1997; Campbell, 1987; N. F. Chen, 1991; N. F. Chen et al., 1986; Fama & French, 1988; Jensen et al., 1996; Wasserfallen, 1989). A growing number of studies have shown that stock prices systematically respond to changes in macroeconomic conditions. Wasserfallen (1989) shows that increased economic activity increases a company’s expected future cash flow. Asprem (1989) shows that real economic activity (industrial production, gross domestic product [GDP], and exports) positively affects stock price changes in European countries. Fama (1981) finds a negative association between stock returns and inflation, a positive association between stocks and real economic activity, and an inverse relationship between inflation and real economic activity. Fama (1981) suggests that real income growth drives stock prices and stimulates demand for cash flows. Following growth in income and improved BCs, the earnings and dividends of firms are more likely to increase; thus, investors’ expectations about future corporate earnings tend to increase (M. H. Chen, 2010).
Tourism has recently become the fourth biggest export industry globally, following fuels, food, and chemicals. According to the World Tourism Organization (UNWTO, 2019), international tourism expenditures increased by (7%) from USD 452 billion in 1995 to USD 1.323 trillion in 2017, with international tourism generating USD 1.6 trillion in export earnings. Furthermore, according to the World Travel and Tourism Council (World Travel & Tourism Council, 2019), the overall travel and tourism contributions to GDP were USD 8.810 billion (10.4% of GDP) in 2017. The key reason for this growing interest is the crucial role of the tourism sector in boosting economic growth. For instance, first, tourism increases foreign exchange earnings, which helps introduce new technology for productivity (McKinnon, 1964). Second, tourism encourages investment in new infrastructure and creates new job and employment opportunities (Blake et al., 2006). Third, inbound tourism promotes industrial development through spillover effects (Cernat & Gourdon, 2012).
The tourism sector can be influenced by financial development (FD) through favorable BCs. S. Katircioglu et al. (2018) indicated a bidirectional interaction between growth in tourism and FD in Turkey. Furthermore, Shahbaz et al. (2017) examined Malaysia’s tourism growth by incorporating FD and trade openness. Their results show the existence of bidirectional causality between tourism, FD, and trade openness. Moreover, Ohlan (2017) demonstrated a long-term relationship between tourism and economic growth in India when considering the importance of FD. Therefore, tourism firms’ stocks will be affected by changes in FD, as the later affects the tourism firm’s performance. Başarir and Çakir (2015) found a causal relationship among tourism, FD, energy consumption, and carbon emission in Turkey, France, Spain, and Greece. By establishing well-developed financial sector facilities, tourism firms may be able to more easily finance their investment operations, which, in turn, will lead to increases in not only cash flows but also their stock prices and returns. Changes in BCs are likely to exert influence on tourism sector growth, as documented in the relevant literature (M. H. Chen, 2007b). A favorable business climate contributes to increasing firm sales and, therefore, income, which positively affects firm stocks. However, if their BCs worsen, firms’ earnings and dividends are likely to decline, which leads to lower firm stock prices (Harvey, 1991). However, firms’ financial success can help boost economic conditions by providing more job opportunities and business income in the country (Jeon et al., 2004).
Although many studies have established a relationship between macroeconomic factors and stock returns, even in the case of the tourism, leisure, and hospitality industries, the interaction between the financial sector and the tourism, leisure, and hospitality industries has not yet received sufficient attention. Therefore, this study aims to investigate the effects of BCs and the financial sector on the stock performance of tourism, hospitality, and leisure firms operating in significant tourist destination countries. Therefore, this study proposes that business and finance environments are likely to impact the stock prices of tourism, hospitality, and leisure firms that operate in major tourist destinations. The major tourist destinations in this study were selected based on the ranking of the United Nation’s World Tourism Organization (United Nations World Tourism Organization [UNWTO], 2019). The contribution of this research to the current literature is threefold. To the best of our knowledge, this is the first study that explores and outlines the relative importance of changes in BCs and FD to explain the financial performance of tourism firms’ stock prices among the top eight tourism destination countries such as (France, the United States, Spain, China, the United Kingdom, Germany, Mexico, and Thailand) by including an important factor, tourism growth, in our analysis. First, this study extends M. H. Chen’s (2007b) work by analyzing the impact of BCs on the entire tourism firm stock index, which takes into account various tourism sectors in the industry, such as airlines, travel and tourism, gambling, restaurants, and bars, leisure services, and hotels, providing a comprehensive picture of the effect of BCs on the tourism industry. Second, there has been no previous research analyzing the effect of FD on tourism firms’ stock price index. However, for example, Shahbaz et al. (2017) and S. Katircioglu (2017) investigated the effect of FD on tourism growth (international tourist arrivals). Third, we fill the gap in the tourism literature by using a newly developed panel-based model of first- and second-generation econometrics to analyze the impact of BCs and FD on top tourism destination countries.
This study is organized as follows: Section “Literature Review” presents the literature review; Section “Data and Model Specification” describes the data and model specification; Section “Method” presents the methodology and proposed methods used in this study; Section “Results and Discussion” presents results and discussion; Section “Conclusion” concludes the study.
Literature Review
Impact of Macroeconomic Variables and BCs on the Tourism Sector
Many previous studies analyze the effects of macroeconomic variables as key factors that affect the stock returns of tourism and hospitality firms. Barrows and Naka (1994) considered the earliest empirical study that examined the impact of five macro factors (inflation rate, money supply, domestic consumption, interest rate, and industrial production) on U.S. hospitality stock returns from 1965 to 1991. The results indicated that the return on hospitality stocks is positively correlated with the growth rate of money supply and domestic consumption and negatively correlated with the expected inflation rate. In the same vein https://www.powerthesaurus.org/in_the_same_vein, M. H. Chen et al. (2005) studied the effect of economic and non-economic variables on hotel stock returns in Taiwan. The various regression tests show that only the money supply growth rate and the unemployment rate can explain the movement of the Taiwanese hotels’ stock returns among the macroeconomic variables (i.e., industrial production growth, the growth rate of money supply, expected inflation, unemployment rate, and yield spread). Likewise, Wong and Song (2006) reported that interest rates account for a considerable proportion of the volatility in stock indices in the tourism subsector, namely, casino, hotel, and restaurant indices. M. H. Chen (2007b) investigated the interaction between the BCs and financial performance of tourism firms in China and Taiwan. GDP and industrial production were selected as proxies for BCs, and the empirical results showed that both the BCs and financial performance of tourism firms are strengthening each other in both countries. M. H. Chen (2007c) also investigated the impact of tourism sector growth, measured by foreign tourist arrivals and some extreme events, including natural disasters, sports activity, war, financial crisis, terrorist attacks, and political events, on Chinese hotel stock returns. The results indicated that the return of hotel stocks is more susceptible to changes in macroeconomic variables and natural disasters than increases in the number of foreign tourists. Besides, Chen (2010) indicate that the expansion of tourism, determined by the growth rate of international tourist arrivals, directly affects the performance of tourism stocks. This result has shown that the growth of tourism will dramatically increase the corporate income of tourism companies. In the same way, M. H. Chen (2010) examined the effect of macroeconomic and tourism growth on various areas of corporate performance in the hotel industry, determining that the development of tourism has a major influence on the hotel industry’s performance, as it can significantly promote economic conditions. Moreover, M. H. Chen et al. (2012) stated that, among the conventional macroeconomic factors, only unemployment rate, oil price, and money supply could explain the changes in hotel stock returns in Japan. Finally, the findings of Hadi et al. (2020) showed that long-term relationships exist between macroeconomic factors, industrial production, commercial and industrial loans, and foreign arrivals to tourism firms’ stock prices in the United States.
In comparison, few studies have incorporated other indicators with macro-economic variables that are capable of explaining changes in tourism stock performance, such as consumer sentiment, the consumer confidence index, and corporate governance, in their analyses. For example, Singal (2012) studied the influence of consumer sentiment and includes macro explanatory variables as control variables on hospitality stock returns in the United States. The findings revealed that consumer sentiment could explain a substantial part of the future growth of expenditures in hospitality. Furthermore, the finding showed a weaker relationship between changes in traditional macro variables and hospitality industry stock returns. Demir et al. (2017) used macroeconomic variables, namely, consumer price index, imports, exchange rate, the consumer confidence index, oil price, money supply, foreign tourist arrivals, and added stock market returns, as another explanatory variable for Turkish tourism firms (BIST). Because of the presence of structural breaks in their series, four different models were estimated, and the study reported a mixed result regarding the impact of the explanatory variables on tourism firms’ stock returns. Finally, Al-Najjar (2014) studied the impact of measured (size, board) corporate governance on the performance of tourism firms in five middle-eastern countries. His results underlined that corporate governance plays a vital role in explaining the performance of tourism firms. Specifically, the profitability indicator return on assets and equity (ROA and ROE) results were statically significant.
Impact of FD in the Tourism Sector
Another stream of literature explicitly focused on the role of FD and the tourism sector, a few studies briefly listed below. For example, Kumar and Kumar (2013) studied the causal relationship between tourism and economic activity and FD and urbanization in Fiji from 1981 to 2009. The results revealed that FD plays a vital role in the tourism industry. Similarly, Basarir and Cakir (2015) explored the same relationship between FD and the Turkish tourism sector and four other European Union countries from 1950 to 2010. The causality results showed a unidirectional link between FD and the tourism sector in these countries. In addition, Shahbaz et al. (2017) also confirmed previous studies by finding a unidirectional relationship between the tourism industry and financial growth in Malaysia. In the same vein, S. Katircioglu (2017) studied the interaction between tourism growth and FD in Turkey. International tourist arrivals were considered a proxy for tourism growth, and a composite FD index was developed through five main variables to measure the financial sector’s performance. Besides, foreign direct investment (FDI) and trade openness were examined. The study’s main finding was that the financial sector has a high and positive impact on tourism development; however, FDI and trade openness play a major role in the development of the tourism sector in Turkey. Finally, Ohlan (2017) investigated the impact of FD and tourism growth on economic growth. Furthermore, the empirical ARDL results demonstrated that there is both long-term and short-term cointegration between FD, tourism growth, and economic growth in India.
As stated in the majority of previous studies, it has been highlighted that the effect of macroeconomic factors on the hospitality sector, and despite numerous studies investigating the influence of FD on the growth of the tourism sector, no empirical studies have explicitly been conducted to investigate the impact of BCs and FD on the tourism sector in a detailed, precise manner. Consequently, in light of these knowledge gaps, this study contributes to the literature by examining the long-term relationship between BCs and FDs in top tourism destination countries, such as France, the United States, Spain, China, the United Kingdom, Germany, Mexico, and Thailand.
Data and Model Specification
Data Description
The dependent variable
The data used in this article is quarterly figures from the top eight tourist destination countries (France, the United States, Spain, China, the United Kingdom, Germany, Mexico, and Thailand), which were selected based on international tourist arrivals between 2004 Q1 and 2018 Q4. In addition, the tourism firms’ stock index prices, reflecting the stock financial performance of listed tourism firms in the stock exchange market, such as airlines, travel and tourism, gambling, restaurants and bars, recreation services, and hotels following (Demir et al., 2017; Hadi et al., 2019). The selection of both the data period and countries was based on data availability. As proposed in Equation 2, the dependent variable is Tourism Stock Index (TSI); we used tourism firms’ stock price index as a proxy of their respective financial performance, which is summarized in Table 1. TSI data was gathered from Thomson Reuters’ Data Stream and EIKON.
Stock Indices in the Tourism, Hospitality, and Leisure Industries.

Source. Tourism Organization United Nation United Nations World Tourism Organization (2019).
Independent variables
First, BCs in the studies of M. H. Chen (2007b) were proxied by overall macroeconomic activity, GDP, and industrial production (IND). IND closely tracks the country’s manufacturing sector efficiency, whereas GDP tracks the manufacturing sector and other service sectors. The variables GDP and IND are at constant 2010 USD prices and gathered from Thomson Reuters’ Data Stream and EIKON. Besides, according to Cobb-Douglas growth functions and macroeconomic theory, two other measurements for BCs can be used, such as gross capital formation and overall labor force (GFC, LABOR). Data regarding GFC and LABOR were obtained from the International Monetary Fund (2019).
Second, many studies have suggested broad money supply (M2) and domestic credits of the banking sector (DC) to be used as proxies for FD (S. Katircioglu, 2017; Shahbaz et al., 2017); therefore, the variables M2—as a percentage of GDP (M2/GDP)—and DC as a percent of GDP (DC/GDP)—were also gathered from Thomson Reuters’ Data Stream and EIKON to proxy FD in this study. Third, control variables (CV), the consumer price index, and the exchange rate (CPI, RER) are two significant factors that determine the stock price of tourism firms and are extensively used in previous research, such as (Barrows & Naka, 1994; M. H. Chen et al., 2005, 2012; Demir et al., 2017). CPI and RER were collected from Thomson Reuters’ Data Stream and EIKON. Next, international tourist arrivals (TA) were used in this study as an indicator of tourism growth, as per prior studies (M. H. Chen, 2007a, 2007c; Chen et al., 2010; Demir et al., 2017; S. T. Katircioglu, 2009), while TA data was obtained from the World Tourism Organization (UNWTO, 2019). Finally, we created a dummy variable to capture the financial crisis (FC) effect by taking the value of one during the period 2007M02 to 2009M12 and zero otherwise (Ersan et al., 2019). All series are at their natural logarithms in the empirical analyses in this study.
Model Specification
This article suggests that BCs and FD are significant contributors to tourism firms’ stock prices in major tourist destinations. Therefore, a functional relationship is established in this study in parallel to those in the relevant literature (M. H. Chen, 2007b; S. Katircioglu, 2017; Shahbaz et al., 2017). It is expected that BCs and FD. Exert significant effects on tourism firms’ stock performances. Then, the following functional relationship is proposed in this study:


where TSIt is tourism firms’ stock price in period t; GCFt is the gross capital formation in period t; LABORt is the overall labor force in period t; GDPt is a gross domestic product in period t; IPt is industrial production in period t; CPIt is consumer price index in period t; and RERt is real exchange rates in period t; M2 t is money supply in period t; DCt is credit to the private sector in period t; TAt is international tourist arrivals in period t; FCt is financial crises in period t. Equation 2 will be then expressed in the logarithmic form to capture the growth effects in the long term:

where i denotes the country (i = 1, . . ., 8), and t denotes the time period (t = Q1,2004, . . . Q4, 2017); The parameters of
Method
This section of the study explains how the empirical panel method is applied, that is, through a cross-sectional dependency (CSD) test, panel unit root tests, a panel cointegration test, a long-run panel estimation, and a panel Granger causality test.
Cross-Sectional Dependence Test
The critical issue with panel data analysis is to check the CSD due to rapid globalization and the expanding liberalization of market growth, which have led to greater interdependence between countries. Thus, a CSD test for the panel is expected. O’Connell (1998) and Pesaran (2006) argue that ignoring CSD would lead to an over-rejection of our hypothesis while implementing the panel unit root test, which led to severe biases and size distortions, and will lead to inconsistent findings. Therefore, both the Breusch and Pagan (1980) Lagrange multiplier (LM) test and the Pesaran (2004) CSD test were used in our research. Besides, we conducted LM-adj test by Pesaran et al. (2008) to check for robustness and prevent misleading results (Hsueh et al., 2013). For these three CSD tests, the null and alternative hypotheses can be represented as follows:
The rejection of the null hypothesis indicates the existence of CSD in the panel model.
Slope Homogeneity Test
We then proceeded to examine the slope of homogeneity following a study by Blackburne and Frank (2007). The slope homogeneity method was employed in this study as established by Swamy (1970) and suggested by Pesaran et al. (2008). They demonstrate that the presence of slope homogeneity in the estimated panel model is anticipated with biased results. Moreover, Pesaran et al. (2008) state that there is a big chance that the panel estimated model suffers from having slope heterogeneity due to astronomical cross-sectional observations. To examine the slope of homogeneity for a standardized distribution, the statistic is estimated by (∆) and also in case of a small sample (-adj) has been tested. The following hypothesis is presented for the Swamy (1970) test:


The rejection of the null hypothesis in the estimated panel model indicates the presence of slope of heterogeneity coefficients.
Panel Unit Root Test
Next, after checking for CSD and slope of homogeneity, we carried out a second-generation panel unit root test, such as augmented IPS (CIPS) and augmented Dickey–Fuller (CADF) tests introduced by Pesaran (2007), to determine the order of integration between the variables concerned in the panel Equation 3. The CIPS and CADF monitor the issue of CSD and the heterogeneity of slopes, as compared with the first generation panel unit root test. Consequently, the results derived from these approaches are more consistent and reliable. The following hypothesis for both tests (CIPS and CADF) was as follows: the null hypothesis is that all the individuals within the model are not stationary. The alternative hypothesis is that at least one individual is stationary within our panel model Equation 3.
Panel Cointegration Test and Estimation of Long-Run Coefficients
To test the long-run equilibrium linkage between BCs, FD, and TSI, we employed the second-generation panel cointegration test suggested by Westerlund (2007) based on the further existence of a potential issue characterized by CSD and the slope of heterogeneity in the panel data analysis. The Westerlund cointegration based on the error correction model (ECM) test proposes two different tests to explore the alternative cointegration hypothesis for the whole panel (Gt and Ga), while the alternative is considered for evaluating the two other tests (Pt and Pa) by cointegrating at least one cross-cutting unit. The first two tests are called group statistics, and the other two tests are called panel statistics. Rejection of the null hypothesis implies that the series is not cointegrated, whereas the alternative hypothesis is that there is cointegration between the series. For further robustness check, we also applied the Kao cointegration test proposed by Kao (1999); this test analyses the homogeneous cointegration relationship for individual fixed effects with a pooled regression. Next, confirming the cointegration relationship among the variables’ enabled us to estimate the long-run coefficients of each independent variable in terms of the dependent variable: TSI. The long-run coefficients were estimated by the dynamic ordinary least squares (DOLS) method developed by Pedroni (2001). Lee (2007) notes that the FMOLS (fully modified ordinary least squares) and DOLS approaches are introduced as alternatives to the OLS method, since simple OLS generates false standard errors subject to second-order asymptotic bias. Besides, Kao and Chiang (2001), however, state that the DOLS works better in small samples than the FMOLS and OLS approaches in terms of panel data analysis.
Moreover, Narayan and Smyth (2007) argue that the DOLS generates stable coefficient estimates of independent variables in small samples, accounting for potential endogeneity and serial correlation issues. Therefore, the DOLS produces unbiased coefficient estimates (Pedroni, 2001). Due to the comparatively small size of our sample group, this research study utilized the DOLS method (Pedroni, 2001).
Dumitrescu–Hurlin Panel Granger Causality Tests
As a final step, the causal effect of BCs and FD on top destination tourism firm stocks, from incorporating control variables and tourism growth (TA), was explored using the Dumitrescu–Hurlin Causality (DHS) Test panel (Dumitrescu & Hurlin, 2012). Among other causality tests, the DHS was selected due to its superiority over traditional panel causality tests. The causality test of DHS has the following advantages: first, it can be applied to both the existence and absence of cointegration in the panel data model. Second, it takes into account both CDS and slope of homogeneity issues in the panel series. Third, the DHS provides a relatively unbiased result for unbalanced and small sample sizes in the panel data sets. Thus, the null and alternative hypothesis are as follows:


Based on the coefficients of an average Wald statistic, rejection of the null hypothesis demonstrates a causal link between at least one subgroup of the panel.
Results and Discussion
We highlighted the pattern of the analysis, which will be discussed in this section. Table 2 provides the summary statistics of the tourism firms’ stock price indices and the nine explanatory variables. The TSI ranged from 10.22% to 3.35%, with a mean of 6.16%. Among the nine variables, TA, M2, and LABOR were more volatile than TSI in terms of their standard deviation. Table 3 displays the results of the correlation matrix among the panel series. Correlations among the variables are relatively low, in general. Therefore, there is no severe multicollinearity problem in the estimation model.
Descriptive Statistics.

Note. TSI = tourism firms’ stock indices; GFC = gross fixed capital formation; LABOR = labor force; GDP = gross domestic product; IND = industrial production; CPI = consumer price index; RER = real exchange rate; DC= credit to private sector; M2 = money supply; TA= international tourist arrivals.
Correlation Matrix.
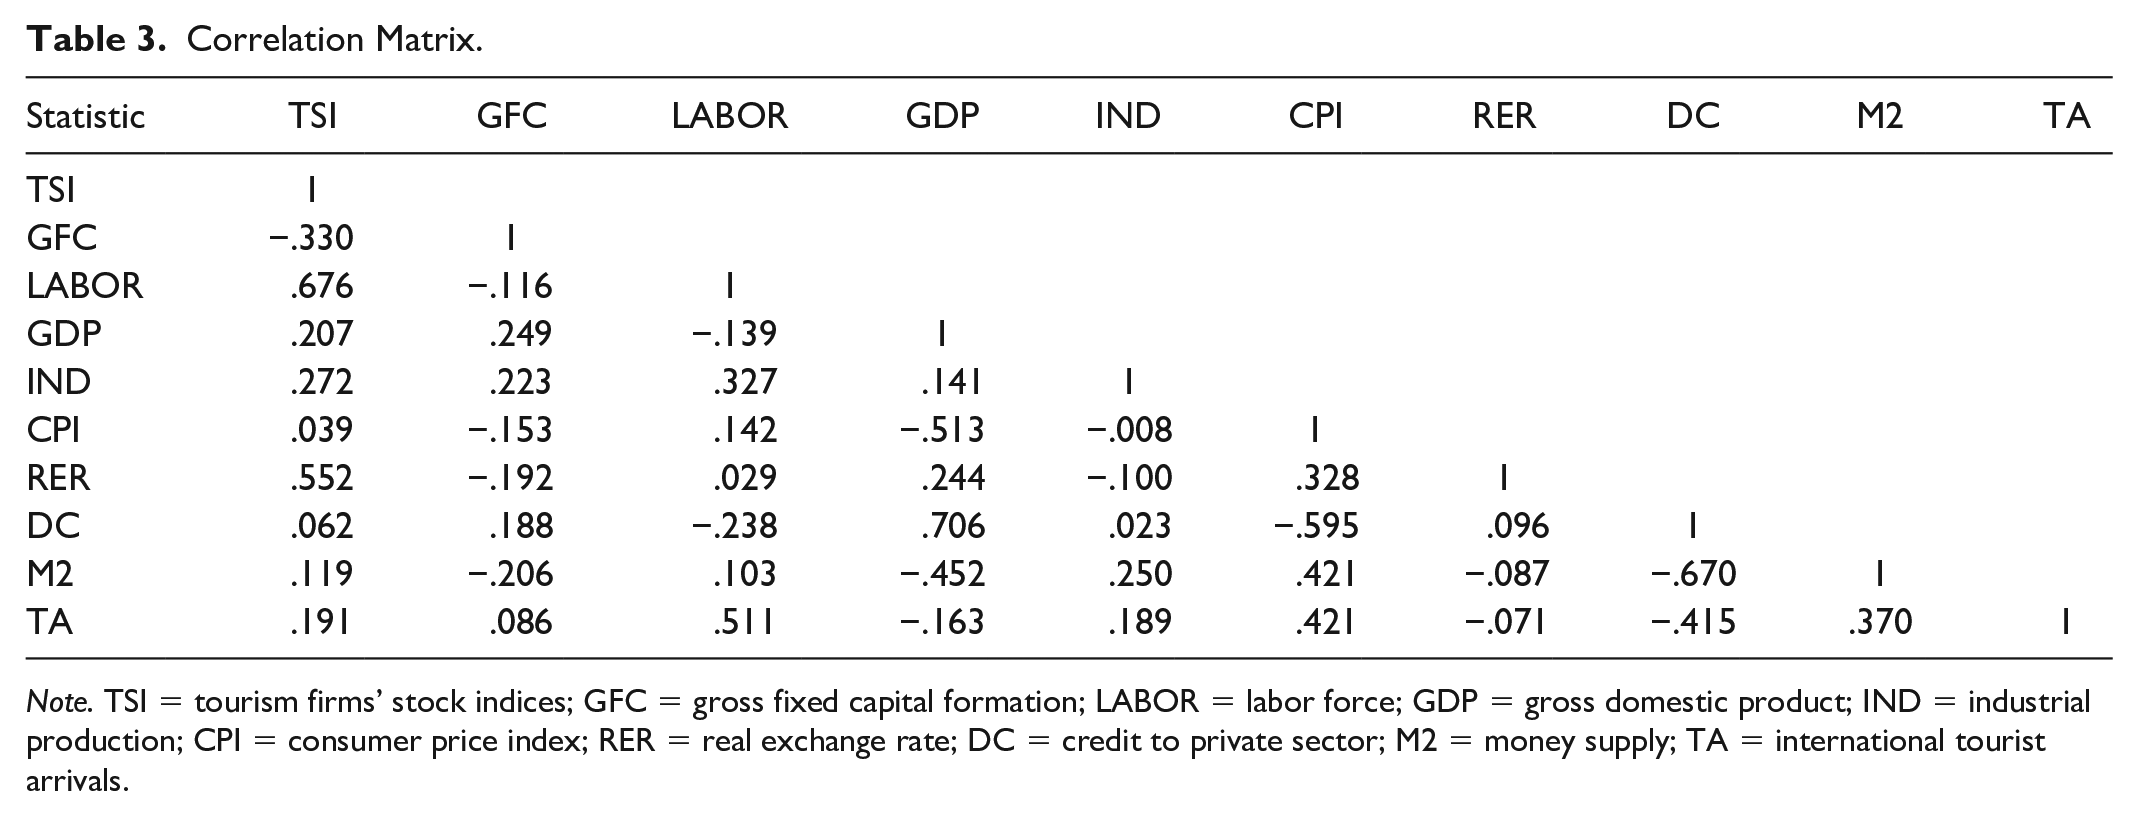
Note. TSI = tourism firms’ stock indices; GFC = gross fixed capital formation; LABOR = labor force; GDP = gross domestic product; IND = industrial production; CPI = consumer price index; RER = real exchange rate; DC = credit to private sector; M2 = money supply; TA = international tourist arrivals.
Since testing for CSD in panel data is essential to assess the estimation method, it is also a suitable methodology technique for panel data analysis. Table 4 highlights the results for the Breusch and Pagan’s (1980) LM, Pesaran’s (2004) LM CD, and Pesaran et al. (2008) LM tests. Table 4 shows that the CSD statistics for TSI, GFC, LABOR, GDP, IND, CPI, RER, DC, M2, and TA are significant at the 1% level. The results strongly reject the null hypothesis that there is no cross-sectional dependence between the variables considered in the top tourism destination countries. These results are in line with our previous expectations, a high level of CSD across the top eight tourism destination countries, reflecting a number of commonalities within the regional BCs and FDs, including tourism growth and other controlling factors, such as (RER, CPI) and the exposure of the TSI to common shocks. Table 5 displays the results for the slope of homogeneity and the p-value for both tests (∆, ∆_adj), which were significant at the 1% level. Thus, the rejection of the null hypothesis indicates that the estimated panel model has a slope of homogeneity problem. The evidence from Tables 4 and 5 indicates that there is panel slope heterogeneity and a CSD problem that should be taken into account in the following steps.
Cross-Sectional Dependence Test Results.

Note. LM = Lagrange multiplier; CD = cross-section dependency; TSI = tourism firms’ stock indices; GFC= gross fixed capital formation; LABOR = labor force; GDP = gross domestic product; IND = industrial production; CPI = consumer price index; RER = real exchange rate; DC= credit to private sector; M2 = money supply; TA = international tourist arrivals. The cross-section dependency test follows the normal distribution standard. There is no cross-sectional dependence on a null hypothesis. *** indicates 1% significant level.
Homogeneity of Slope Test Analysis.

Note. Null hypothesis: existence of slope homogeneity. *** displays 1% significant level.
Table 6 presents the results of the panel unit root tests for both the. CIPS and CADF of the series under consideration, suggesting that all series are nonstationary at levels but become stationary at first differences. This finding is because the null hypothesis of a unit root cannot be rejected throughout four model options of unit root tests; however, the null hypothesis of a unit root can be rejected when series are first differenced. Therefore, at this moment, this study concludes that the series under consideration is integrated of order one, I (1).
Panel Unit Root Tests.

Note. TSI = tourism firms’ stock indices; GFC= gross fixed capital formation; LABOR = labor force; GDP = gross domestic product; IND = industrial production; CPI = consumer price index; RER = real exchange rate; DC= credit to private sector; M2 = money supply; TA = international tourist arrivals. Critical values are not stated for the sake of brevity, but can be given upon request. *** indicates a statistic significance at 1 % level.
The general intent of this study is to examine the long-run cointegration between tourism firms’ stock price and BCs and FDs in more detail. Due to the limitation of the number of variables that can be implemented in the Westerlund (2007) cointegration, we divided Equation 3 into five models to verify the cointegration between the TSI and BCs by adding one of our control variables to each model, which is shown from one to four in Table 7: Model 1: F(TSI, GFC, LABOR, GDP, IND, CPI); Model 2: F (TSI, GFC, LABOR, GDP, IND, RER); Model 3: F (TSI, GFC, LABOR, GDP, IND, TA). Likewise, Model 5 shows the cointegration between FD and the TSI: Model 4: F (TSI, DC, M2, RER, CPI, TA). Overall, Table 7 highlights the Westerlund (2007) cointegration results, which confirm the presence of long-term cointegration in each model. Moreover, Table 8 displays the Kao cointegration test used as a robust check and the implementation of the whole model in Equation 3. The results of the Kao cointegration test show that the null hypothesis of nonstationary residuals (denoting no cointegration) in Equation 3 is rejected, and its alternative of stationary residuals (denoting a cointegrating relationship) is accepted. Thus, the Kao cointegration test suggests that Equation 3 of this study is a cointegration model.
The Westerlund (2007) Panel Cointegration Test.
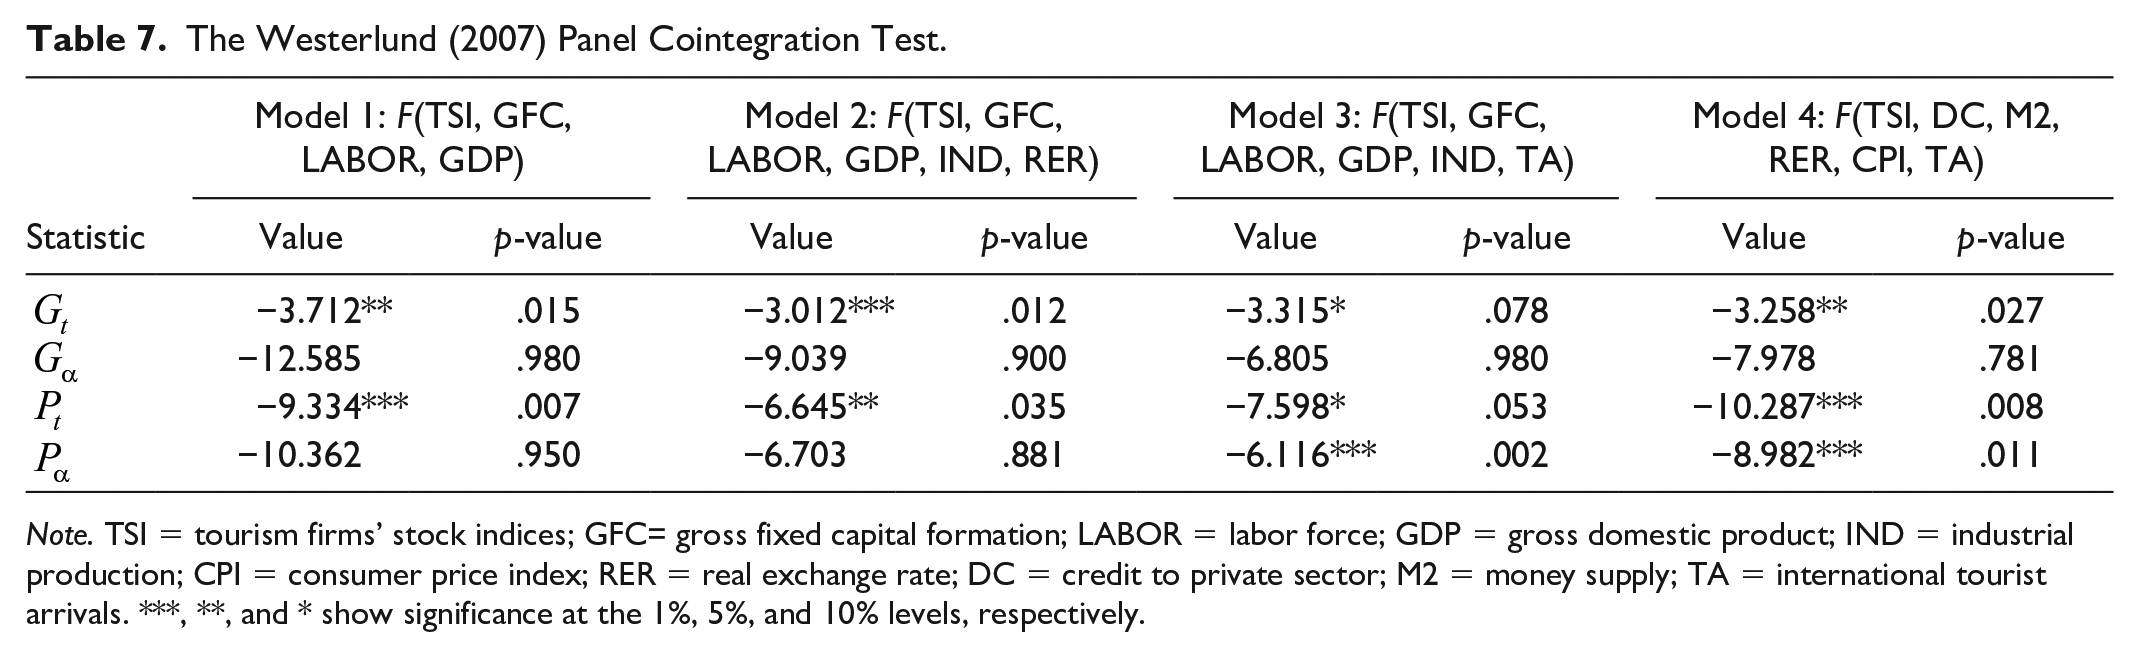
Note. TSI = tourism firms’ stock indices; GFC= gross fixed capital formation; LABOR = labor force; GDP = gross domestic product; IND = industrial production; CPI = consumer price index; RER = real exchange rate; DC = credit to private sector; M2 = money supply; TA = international tourist arrivals. ***, **, and * show significance at the 1%, 5%, and 10% levels, respectively.
Kao Residual Cointegration Tests.

Notes. Akaike information criterion was selected for lag length. ***p < .001.
Confirming the cointegration relationship in Equation 3 enables us to estimate the long-run coefficients of each independent variable concerning the dependent variable: TSI. Table 9 presents the DOLS results of estimating the long-run coefficients in Equation 3. A total of eight different model options are preferred in this study, as per previous works (Imamoglu et al., 2018), which are ordered from the narrowest to the widest. This strategy checks the robustness and consistency of the results, as advised in the relevant literature (Imamoglu et al., 2018). For the interpretation of the result, we consider that Model 8 in Table 9 shows that GCF and LABOR exert positively significant but inelastic effects on tourism stock performance in the selected countries. GFC enables more capital structure research and development, leading to increased labor productivity effectiveness. As labor becomes more efficient, more goods will be produced, resulting in a rise in GDP and economic activity that will stimulate the tourism industry (Shahbaz et al., 2017). This finding reveals that investment climate and labor growth positively impact stock prices in the tourism, hospitality, and leisure industries.
Results From the Panel DOLS.

Note. DOLS = dynamic ordinary least squares; TSI = tourism firms’ stock indices; GFC = gross fixed capital formation; LABOR = labor force; GDP = gross domestic product; IND = industrial production; CPI = consumer price index; RER = real exchange rate; DC = credit to private sector; M2 = money supply; TA = international tourist arrivals; FC = financial crisis. In all six estimations, Schwarz Criteria Information is used.
, **, and * indicate the rejection of null hypothesis at 1%, 5%, and 10% significance levels, respectively.
However, BCs, as proxied by GDP and IND, exert positively significant 1.077% and 0.753% effects on TSIs, respectively. The impact of GDP is always elastic, while the coefficients of IND are generally inelastic but close to unit elasticity. This finding is in line with M. H. Chen (2007b), who asserts that IND measures BCs closely monitoring the manufacturing industry, while GDP includes both manufacturing and other service industries. Thus, this finding indicates that tourism firms’ stock price is closely connected not only to the production sector but also to other service industries. In addition, M. H. Chen (2007a) noted that the increase in GDP and IND provided more opportunities for firms to raise their sales and revenues, resulting in a rise in the stock prices of tourism firms. Similarly, M. H. Chen (2007a) found a causal link between hotel stock returns and IND for China and Taiwan. In addition, M. H. Chen and Kim (2010) found a causal association between IND and the stock returns of airlines, hotels, and entertainment firms.
Moreover, Table 9 also displays the effect of FD (DC, M2) on TSI, with the increases in DC having a nearly one-to-one impact on the levels of TSI. More explicitly, a 1% increase in DC increases the TSI by 0.994% and positively significant and inelastic. This finding is in line with Shahbaz et al. (2017). FD boosts economic activity due to increased credit growth, investment opportunity, and the overall stock market. This will lead to a healthy economic environment for investors and a better way of investing in the tourism sector. A well-functioning financial market and banks are responsible for financing and lending projects in the tourism sector (S. Katircioglu, 2017). Besides, the effect of M2 on the TSI is 1.124% and positively significant and elastic. M. H. Chen et al. (2012) stated that the expansionary monetary policy, which denotes a rise in money supply (M2), will influence stock price via various channels. For example, expansionary monetary policy will boost economic growth and the consumption of tourism goods and services, thus boosting tourism firms’ revenue and stock prices (Barrows & Naka, 1994; M. H. Chen et al., 2005; Chen et al., 2005).
In addition, Table 9 highlights that the most influential impact on the TSI is from TA: a 1% increase in TA increases the TSI by 2.33% and is positively significant. The impact of TA is direct and indirect on the TSI. If a country is experiencing tourism expansion, tourism firms are likely to see increased occupancy rates, customers, sales, and returns, which will be reflected in their stock prices (M. H. Chen, 2007c, 2011; Demir et al., 2017). Hence, TA is expected to have a positive and significant impact on TSI. On the other side, tourism growth can considerably enhance the business environment, which indirectly affects the increase in TSI. Previous empirical studies have shown that tourism expansion can stimulate economic development (Balaguer & Cantavella-Jorda, 2002; Dritsakis, 2004).
Finally, the coefficients of the main control variables, CPI and RER, are generally negatively significant for the TSI, as expected. The results of empirical studies show that CPI could either positively or negatively impact a firm’s stock price (Asprem, 1989). However, several previous studies indicate that CPI has a negative relationship with stock returns (Barrows & Naka, 1994; M. H. Chen, 2007c; N. F. Chen et al., 1986; Fama, 1981c). RER appreciation is expected to reduce a country’s exports and boost imports. This, in turn, reduces income from national businesses, including tourism and hospitality firms, which leads to a reduction in the TSI (M. H. Chen et al., 2012). As a result, the performance of tourism and hospitality firms will also be adversely impacted by the valuation of the national currency, thus lowering people’s confidence and income and changing their attitudes as they delay the luxury of tourism to manage their basic necessities (Demir et al., 2017). TSI is still strongly vulnerable to financial crises since, in line with Ersan et al. (2019), the financial crisis of 2008 triggered a significant downturn of 1.32%.
The final step in this research study is to analyze the causality test results among the series under consideration. Table 10 presents the Dumitrescu–Hurlin panel causality test results in this respect. These results show that there are causalities among the BCs, FD, and TSI under consideration. First, Table 10 supports a bidirectional causality between stock price performance in the tourism, hospitality, and leisure industries and the business environment in selected countries, revealing a reinforcing feedback relationship between BCs and stock performance. Growth in business and the macroeconomic environment would increase the stock prices of the tourism, hospitality, and leisure industries, where growth in stock performances in these industries would also result in better business and macroeconomic activities.
Results From Dumitrescu–Hurlin Panel Causality Tests.

Note. GFC = gross fixed capital formation; TSI = tourism firms’ stock indices; LABOR = labor force; GDP = gross domestic product; CPI = consumer price index; RER = real exchange rate; DC = credit to private sector; M2 = money supply; TA = international tourist arrivals. w-statistic denotes Wald statistics, Zbar statistics, and probability.
, **, and *** indicate that statistics are significant at the 10%, 5%, and 1% levels of significance, respectively.
Second, it can be seen that two different causalities are observed in the case of the FD series. That is, unidirectional causality that runs from DC to TSI is confirmed, while bidirectional causality between M2 and TSI is established in Table 10. This significant finding also reveals that changes in the volume of credit channels in the economy and financial markets would lead to changes in stock performances. However, money supply changes in circulation would imply changes in stock performance, while changes in stock performance in the tourism, hospitality, and leisure industries would contribute to money supply changes.
Finally, the results in Table 10 show that two more unidirectional causalities run from (a) consumer prices to stock prices and from (b) real exchange rates to quite reasonable stock prices. Moreover, it is observed that there is reinforcing causality between tourism growth and stock prices in the tourism, hospitality, and leisure industries.
Conclusion
This study examined the effects of business and finance conditions on the stock performance of tourism, hospitality, and leisure firms operating in significant tourist destination countries between 2004 Q1 and 2018 Q4. To the best of our knowledge, this is the first study attempting to extensively identify the impact of BCs and FD association with tourism growth (international tourist arrivals) on tourism firm stock prices in major tourist countries. Besides, we used the first and second-generation panel data method to provide a comprehensive picture of this nexus. Thus, this research empirically documents the major contribution of BCs and FD to tourism firms’ financial performance. Furthermore, we carried out the Westerlund (2007) and Kao (1999) experiments to detect the cointegration relationship between the interested variables,’ and the findings suggest that a long-term relationship can be observed in model Equation 3. Besides, the long-run estimation (DOLS) results underscore that tourism firm stock prices are in a long-term economic relationship with the business and financial environment. Therefore, we also conclude that business and finance environments positively and significantly affect stock prices in the tourism, hospitality, and leisure industries.
Moreover, the findings have shown that the coefficient of international tourist arrivals (TA) is a greater impact than the other factors considered in this study. Thus, these findings suggest that the most influential factor driving the TSI is the arrival of foreign visitors. In addition, the findings of the DOLS indicate that CPI and RER had a negative effect on TSI, as per our expectation. Therefore, as seen in this study, a comprehensive empirical analysis is suitable for any country that may want to focus on its tourism sector as part of strategic action for global growth.
This study finds that the macroeconomic prospects of countries are long-term determinants of stock performances in the tourism, hospitality, and leisure industries. Therefore, not only policymakers but also investors in such industries need to pay attention to macroeconomic activities and prospects not only in tourist-receiving countries but also in tourist-sending countries; this is because this study finds that tourist arrivals have a major influential impact on stock performance in the tourism, hospitality, and leisure industries. Based on the results of this study, governments and policymakers should enhance and facilitate the arrival of foreign tourists. For example, the scope of international marketing as a tourist destination has been updated or changed, such as the total tourism budget, authorization of state, or private tourism developmental activities. Besides, tourism investors can use hedging strategies for stocks that might be good options to minimize risk due to economic and financial shocks in tourist-receiving and tourist-sending countries. This study has focused on the significant tourist-receiving countries around the world.
Although the present study provides credible analytical results for modeling the long-term effects of BCs and FD on tourism firms’ stock prices, the limitations of this study include its lack of data regarding the TSI, which led the authors to rule out other major European tourist destinations, such as Italy and Turkey. In addition, the BCs and FD data are limited to some countries and are not available to a vast number of countries, which resulted in this article exploring a smaller range of countries using a panel data method. Future studies can examine the firm-level characteristics of tourism firms and offer a detailed analysis of the effects of monetary policy as an additional factor explaining the financial performance of tourism firms. Future research may also study this relationship nationally or internationally using other countries.
Footnotes
Data Sharing Statement
The data that support the findings of this study are available from the corresponding author upon reasonable request.
Declaration of Conflicting Interests
The author(s) declared no potential conflicts of interest with respect to the research, authorship, and/or publication of this article.
Funding
The author(s) received no financial support for the research, authorship, and/or publication of this article.