
Abstract
This study investigates research collaboration trends within the Korean academic community, analyzing 149,217 papers published in 500 domestic academic journals. Using a comprehensive approach, the data were organized and affiliations classified by institution, institution type, country/region, and department type. Bibliometric analysis and social network analysis (SNA) were employed to examine co-author relationships and collaborative networks in depth. The findings show that the degree of collaboration was 80.8%, while the degree of institutional collaboration was 38.6%. Collaboration was notably higher in STEM fields (science, technology, engineering, and medicine). Papers authored by domestic researchers accounted for 95% of the total, highlighting limited international collaboration. English-language journals demonstrated higher overall collaboration rates, including international collaborations, compared to Korean-language journals. The Hirschman-Herfindahl Index (HHI) was used to assess departmental concentration by research field. The results revealed significant differences in collaboration levels across department types, with some fields exhibiting monopolistic tendencies and others showing strong multidisciplinary collaboration. Institutional co-authorship network analysis identified the Seoul capital area as the central hub of research activity in Korea. A weak negative correlation was observed between geographic distance and collaboration frequency. Network analysis also revealed that institutions with high publication productivity and active research collaborations exhibited greater network centrality (degree and betweenness centrality). These centrality metrics were moderately positively correlated with academic performance, as measured by cited counts and views. This study explores the collaborative structures and network characteristics of Korean academic research from multiple perspectives, providing a comprehensive understanding and valuable insights into its research collaboration framework.
Plain Language Summary
This study analyzed 149,217 papers published in 500 Korean academic journals from 2015 to 2020 to understand patterns of research collaboration. Approximately 80.8% of the papers were co-authored by multiple researchers, but only 38.6% involved more than one institution, indicating that collaboration among authors is more common than among institutions. Collaboration was more active in science, technology, engineering, and medicine (STEM) fields, especially in marine and fisheries sciences, while it was less frequent in the arts and social sciences. International collaboration was limited: among papers published in domestic journals, 95% were written only by Korean authors, 2.6% solely by foreign authors, and just 2.4% were co-authored by both. Papers published in English-language journals showed higher levels of collaboration and international co-authorship than those in Korean-language journals. Most Korean authors were concentrated in the Seoul Capital Area, which accounted for nearly 39% of authors and 45% of papers. A weak negative correlation was found between geographic distance and institutional collaboration. Network analysis showed that institutions with higher levels of research collaboration tended to produce more papers and achieve greater academic impact, as measured by citation and view counts. Central institutions in the co-authorship network demonstrated higher productivity and visibility. This study provides a comprehensive foundation for understanding how researchers and institutions collaborate within the Korean academic ecosystem.
Keywords
Introduction
Collaboration has become an essential requirement in modern science, as evident from the substantial increase in co-authored papers by both individual scientists and research institutions (Subramanyam, 1983). Furthermore, scientific collaboration enhances communication, facilitates the sharing of expertise and resources (Melin & Persson, 1996), and fosters innovation through interdisciplinary interaction (Beaver, 2001). The growing prevalence of co-authorship in scientific publications provides clear evidence that scientific knowledge creation increasingly relies on collaboration rather than independent research (Katz & Martin, 1997). There is also a general consensus that co-authorship serves as a proxy for scientific collaboration and that co-authorship is a quantifiable measure of collaboration that can effectively reflect the collaborative activity of academics (Katz & Martin, 1997).
Analyzing co-authorship patterns in the domain of Science and Technology partnerships provides valuable insights into collaboration patterns among individuals and institutions (Melin & Persson, 1996). Scientific collaboration takes on three primary forms: national, institutional, and author collaboration (Han et al., 2014), occurring within single departments, across departments within institutions, between multiple institutions within a country, or even at the international level (Qin et al., 1997). These forms of collaboration are measured through bibliometric analysis, which serves as an important tool for understanding the level and form of collaboration (Han et al., 2014).
When representing the collaborative phenomenon of researchers primarily engaged in collaborative research as a network, it becomes possible to analyze and understand various related characteristics. This construction is commonly referred to as a co-author network or collaborative research network, and it is also commonly known as a collaboration network (Lee, 2010). In a collaborative network, examining the structural behaviors of cooperation within the academic community allows for an understanding of the social relationships among individual researchers and the characteristics of their academic influence (Yan & Ding, 2009). The potential value of co-authorship data has gained prominence. Starting from the 2000s, it has fueled research related to co-author networks from a social network perspective, following smaller-scale statistical analysis studies in the 1990s and earlier (Newman, 2004).
Social Network Analysis (SNA) is a crucial approach used to study the exchange of resources among actors, including individuals, groups, organizations, and more, enabling the analysis of information exchange patterns and the visualization of collaborative structures (Haythornthwaite, 1996; Qin et al., 1997). This analytical method is useful for understanding the characteristics of researchers’ social relationships and academic influence, and it allows for the analysis and visualization of relationships and the significance of networks among researchers through co-authorship networks (Mohammadamin et al., 2012).
Scientific collaboration has been extensively discussed in various fields, including information science, psychology, management science, computer science, sociology, and more (Sonnenwald, 2007). Korean scholars have become more productive and collaborative (J. Kim et al., 2016), and the Republic of Korea (hereafter Korea) is persistently promoting policies that strengthen collaboration among various innovation players, such as universities, companies, and government research institutes, with a focus on the importance of scientific research in generating knowledge for technology development (Beck, 2015).
Within this context, this study aims to systematically explore co-author patterns and collaboration networks in Korean academic research to deepen our understanding of the collaborative structure and characteristics within this academic domain. The research focused on 83,633 papers published across 500 Korean academic journals covering a wide array of scientific disciplines. Analysis methods encompassed bibliometrics and SNA. Experimental data was constructed based on Korea Science Citation Database (KSCD) through institutional identification and departmental classification. Subsequently, we conducted multifaceted analyses, considering aspects such as institutions, institutional types, countries/regions, and department types.
First, this study aims to clarify the relationships between collaborative research behaviors, author and institution statistics, and article utilization outcomes (cited count and views) through the analysis of co-authorship patterns. Second, it delves into the diversity and characteristics of the collaboration network by thoroughly examining the affiliation types of authors and their national and regional distribution. Third, it evaluates the concentration of departments by institutional types and university department types within the field of research. Finally, using SNA method, the study examines primary network characteristics and centrality, considering author affiliations, institution types, geographical locations, and department classifications, followed by data visualization and presentation.
This paper is composed of six sections. The Introduction outlines the research background and objectives. The Literature Review summarizes previous studies on co-authorship and collaboration. The Materials and Methods section explains the data, classification criteria, and analytical methods. The Results present findings from bibliometric and network analysis. The Discussion interprets key trends and structural characteristics, and the Conclusion highlights the study’s contributions and future directions. By analyzing collaboration patterns across Korean academic research, this study offers an integrated understanding of co-authorship structures and supports the exploration of future research strategies.
Literature Review
Bibliometrics and Co-authorship Networks
Information and knowledge have mainly been disseminated through patents and scholarly papers, and constant efforts have been made to analyze these sources to identify technological development trends and researcher networks (Korea Research Foundation [KRF], 2007). Knowledge maps generated from these analyses, exemplified by the global science map based on ISI subject categories, help reveal not only specific disciplinary structures but also the overall knowledge architecture of science and technology (Chung & Han, 2009; Leydesdorff & Rafols, 2009). Bibliometrics quantifies knowledge production and scientific discovery through citation, co-authorship, and co-occurrence analyses, and it regards publication, citation, and co-citation networks, collaboration structures, and diverse social interaction networks as key research objects (Otte & Rousseau, 2002).
Over recent decades, the concept of research collaboration has been widely discussed in bibliometric studies (Liao & Yen, 2012), and co-authorship is considered the most evident and well-documented form of scientific collaboration (Glänzel & Schubert, 2005). Co-authorship networks, consisting of nodes that represent researchers and links that denote joint publications, are typically examined using social network analysis (SNA) and data-mining techniques (Isfandyari-Moghaddam et al., 2021). Kumar (2015) reviewed 118 studies published between 1959 and 2014 in more than 50 journals, conferences, and books, summarizing 10 core topics: small-world properties, giant components, author-name disambiguation, network visualization, multi-layer analyses (individual, institutional, national), scholarly communities, assortative mixing, comparative studies, co-authorship and citation behavior, and the relationship between centrality and productivity. Molontay and Nagy (2021) showed that collaboration in network science has expanded across countries and disciplines and that author centrality strongly correlates with citation counts and the h-index. Chen et al. (2011) analyzed 816 papers published in Scientometrics from 2002 to 2008, combining SNA and citation analyses to visualize collaboration patterns among countries, institutions, and authors. Zhang et al. (2023) applied bibliometrics and SNA to AI-related publications from 1985 to 2019, demonstrating collaboration patterns at national, regional, and institutional levels and the positive association between network centrality and citation impact.
Interdisciplinary and International Collaboration Trends
Qin et al. (1997) examined interdisciplinary research by measuring numbers of co-authors, affiliations, academic fields, and collaboration types, and reported a positive correlation between collaboration level and the degree of interdisciplinary convergence. Desvignes (2022) found that teams with multidisciplinary experience achieve higher citation rates and greater influence, while Melnychuk and Schultz (2024) showed that broadening interdisciplinary R&D can enhance innovation potential but that insufficient resources and capabilities may reduce outcomes.
International collaboration has been equally active. Xu and Chang (2020) analyzed the networks of 166 researchers at three universities in Shanghai and revealed a link between structural position and research performance. Mondal and Maity (2019) investigated Indian library and information science journals, analyzing author patterns and citation characteristics, and Tahmooresnejad et al. (2021) showed that African medical scientists with higher network centrality (2000–2015) produced more and had greater impact. Isfandyari-Moghaddam et al. (2021) examined the 60 most productive countries and highly cited papers from 2011 to 2015 and confirmed that the United States functions as a central hub, maintaining strong links with key partner nations. Geographic distance, cultural similarity, and language are critical factors shaping co-authorship and citation preferences (Glänzel & Schubert, 2005; Schubert & Glänzel, 2006). Hoekman et al. (2010) also found, for 313 regions in 33 European countries (2000–2007), that collaboration is more frequent within the same country and language area, and that physical distance acts as a barrier. Using 50 years of Scopus data, Fitzgerald et al. (2021) reported that intra-regional collaboration has grown faster than international collaboration.
Country-specific studies further reveal spatial characteristics of collaboration. Beck (2015) analyzed Korean scientists’ international papers published between 2002 and 2012 and showed that collaboration is widely dispersed yet concentrated in certain regions. Lin et al. (2023) indicated that remote collaboration increases focus on technical tasks but limits the generation of innovative ideas compared with face-to-face interaction. S. Choi (2012) demonstrated that, supported by strategic government funding, Korea strengthened university–industry collaboration and rapidly increased its centrality to become an emerging hub in the OECD co-authorship network between 1995 and 2010.
Domestic Research Collaboration Trends in South Korea
M.-J. Kim (1999) found that 84% of Korea’s internationally co-authored SCI papers (1994–1996) were written by university researchers, compared with 10% from government institutes and 6% from industry. M.-J. Kim (2005) reported similar proportions for 1995 to 2000. B. Kim et al. (2014) showed extensive collaboration with G7 countries and a steady rise in China-related co-authorship from 1968 to 2012. J. Kim et al. (2016) documented exponential growth in publications and authors between 1948 and 2011 and revealed that collaboration opportunities were concentrated among a limited set of scholars.
In the LIS field, Lee (2010) linked prolific authorship to degree centrality, betweenness centrality, and PageRank. Noh and Chang (2019) found low international collaboration in five Korean LIS journals (1970–2018) and noted that foreign co-authors came from diverse fields. Yang et al. (2021) showed that large multidisciplinary teams were far more common in international than in domestic LIS publications. Studies using the Korea Science Citation Database (KSCD) report the following findings. H. Choi et al. (2013) profiled Korean research activity and observed a preference for citing SCI and Scopus papers. B. Kim et al. (2018) confirmed that including Korean journal citations significantly affects Journal Citation Reports impact-factor rankings. B. Kim et al. (2019) and B. Kim et al. (2022) built citation, co-author, and keyword networks for disaster-safety journals, while B. Kim et al. (2023) analyzed co-authorship patterns in Korean computer-science journals, reporting a collaboration rate of 78.1% and an inter-institutional collaboration rate of 47.2%.
Previous studies based on academic journals published in South Korea have generally relied on older data or focused on specific fields and a limited set of journals, making it difficult to comprehensively understand the overall structure of national research collaboration. In particular, analyses using KSCD have mostly remained case-based and have not sufficiently captured interdisciplinary, inter-institutional, or regional collaboration patterns. This study addresses these limitations by analyzing 149,217 articles from 500 Korean science journals published between 2015 and 2020, offering a quantitative and integrated view of collaboration structures across institutions, institution types, regions, countries, and departments.
Materials and Research Method
Data Sources and Scope
This study analyzed 149,217 articles published in 500 Korean academic journals between 2015 and 2020. The inclusion status of these journals in citation indexing services is as follows: KCI (432 journals), SCI (5 journals), and SCOPUS (25 journals). To construct the experimental dataset, author affiliation information and bibliographic data from KSCD (Korean Science Citation Database), developed by an anonymous institution, were utilized (H. Choi et al., 2013).
To analyze trends in the number of authors and the degree of author-level collaboration, author information from 433,593 articles published in the same 500 journals between 1980 and 2014 was additionally collected. However, due to the difficulty of identifying institutional and departmental types, this data was excluded from other analyses.
Additionally, author information from 350,439 articles published in 13,824 overseas journals indexed in SCOPUS (2015–2020) that involved Korean authors was collected and analyzed. This data was obtained through the ‘SCOPUS at Korea Institute of Science and Technology Information (KISTI)’ service, an optimized database based on SCOPUS’s core bibliographic information (Son, 2022). However, due to limitations in identifying institutions and departments, the analysis of the SCOPUS dataset was restricted to research team size (number of authors), the proportion of international collaborations, and the distribution of collaborating countries. The purpose of using the SCOPUS data was to compare collaboration patterns such as team size and the nature of international collaboration in international journals relative to domestic journals. This comparison aimed to highlight the need to expand international collaboration and global partnerships in Korean academic journals.
The distribution of articles by journal language is as follows: 79.6% in Korean (118,733), 8.2% in English (12,305), and 12.2% in a mix of Korean and English (18,179), with the majority published in domestic journals. The data coverage is summarized in Table 1, and the subject area composition spans across science and technology fields. Engineering accounted for the largest share with 49.4% of journals and 41.8% of articles. A detailed subject classification is provided in Figure 1.
Experiment Data Scope.


Organization of experimental data by subject area.
Data Processing and Classification
To construct the experimental dataset, KSCD’s author affiliation information and bibliographic data were processed by adding institution identification, institution type, country and region, and department classification of universities. Author disambiguation was not performed as it was beyond the scope of this study.
For data classification by analysis unit, institution identification data and institution type classification system developed by the KISTI, and the standard classification system of university education units by the Korean Council for University Education (KCUE) were employed (Korea Institute of Science and Technology Information [KISTI], 2021; Korean Council for University Education [KCUE], 2023). The institution identification data includes approximately 250,000 records. The institution type classification has three levels: Section (5), Division (20), and Group (37). This study used the Section and Division levels. The KCUE classification system also has three levels: Section (5), Division (27), and Group (151), and all levels were applied in this study.
To analyze co-authorship patterns and usage metrics such as citations and downloads, citation and view data for 71,285 articles were collected via web scraping from the KCI website in May 2023. For journal subject area classification, the research field classification provided by the National Research Foundation of Korea (National Research Foundation of Korea [NRF], 2023) was used. Since 2004, NRF has operated the KCI website, analyzing citation relationships and providing various academic information on Korean journals and articles. The publication years of the analyzed articles are from 2015 to 2017, and the citation counts and views 5 years post-publication were used for statistical analysis.
Collaboration and Network Analysis Methods
Based on the constructed dataset, co-authorship status, affiliated institutions, and co-authorship networks were analyzed using bibliometric methods and social network analysis (SNA; Otte & Rousseau, 2002). Co-authorship networks at the author level were classified into five types: Co-Authorship (CA), Author Co-Citation (ACC), Author Bibliographic Coupling (ABC), Words-based Author Coupling (WAC), and Journals-based Author Coupling (JAC; Qiu et al., 2014). Co-occurrence matrices were generated for the four analytical units: institutions, institution types, countries and regions, and department types.
The relative importance of nodes in the co-authorship network was measured using three centrality indices: Degree Centrality, Betweenness Centrality, and Closeness Centrality (Freeman, 1978). Network analysis was conducted using NetworkX (Hagberg et al., 2008), with network visualizations produced using VOSviewer (van Eck & Waltman) and the seaborn package. Pearson and Spearman correlation coefficients were applied for correlation analysis.
Various methods can quantify the degree of research collaboration, including the Collaborative Index (CI), Degree of Collaboration (DC), Collaborative Coefficient (CC), and Revised Collaborative Coefficient (RCC; Liao & Yen, 2012; Rousseau, 2011). This study employed the Degree of Collaboration (DC) widely used in bibliometric studies (Subramanyam, 1983), calculated as: DC = Nm/(Nm + Ns), where Nm is the number of multi-authored papers, and Ns is the number of single-authored papers. This formula was also applied to measure institutional and departmental collaboration degrees.
The concentration of department types by research field was measured using the Herfindahl–Hirschman Index (HHI; Rhoades, 1993). HHI is calculated by summing the squares of market shares and is commonly used to assess market competition. An HHI below 0.2 indicates perfect competition, around 0.2 indicates monopolistic competition, between 0.2 and 0.7 suggests an oligopoly, and above 0.7 indicates monopoly (KRF, 2007). In bibliometrics, HHI is used to assess the concentration of authors, articles, journals, and citations (Chi, 2016). It has been applied across various studies, including those analyzing citation concentration (Larivière et al., 2009), evaluating educational research projects (Tseng et al., 2013), multidisciplinary analyses of scientific fields (Moschini et al., 2020; Porter & Rafols, 2009), and identifying potential areas for interdisciplinary research (Coh et al., 2019). Figure 2 summarizes the entire workflow from data compilation to analysis.

Research methods and procedures (from data construction to data analysis).
Results
This section consists of four subsections: (1) Co-authorship patterns analysis, (2) Analysis of Author’s Institutional Affiliation, (3) Analysis of Author’s Department Affiliation, and (4) Social Network Analysis of Co-authorship Networks.
Co-authorship Patterns Analysis
In this subsection, we analyzed co-authorship patterns based on experimental data and examined the correlations between collaborative research behavior, author and institutional statistics, the number of authors, author affiliations, cited counts, and views.
First, upon examining author composition and co-authorship status, we observed an average of 3.1 authors per article and a Degree of Collaboration of 80.8%, with statistical variations identified across different research fields. The most active research field in terms of co-authorship was ‘Marine Agriculture, Fishery’, and STEM (Science, Technology, Engineering, and Medicine) fields exhibited higher Degrees of Collaboration compared to other fields. Detailed statistics and graphical representations for each research field are provided in Table 2 and Figure 3.
Descriptive Statistics of Authorship Pattern (Degree of Collaboration).


Distribution of the team size (Author level).
The results from analyzing trends in the number of authors and the Degree of Collaboration over the 40-year period from 1980 to 2020 are shown in Figure 4. As of 2020, the number of authors and the Degree of Collaboration had increased by 66.7% and 77.4%, respectively, compared to 1980. However, both statistical indicators continued to rise for 28 years until 2007, after which the growth rate slowed and stagnated. Meanwhile, for the group of papers published by Korean authors in SCOPUS-listed international journals from 2015 to 2020, the average and median numbers of authors per article were 11.7 and 5, respectively, with the Degree of Collaboration reported at 95.6%. These findings suggest that Korean researchers demonstrate significantly more active collaborative research behavior in international journals compared to domestic ones.

Trends of avg. of authors and degree of collaboration over years.
When examining co-authorship composition and collaborative patterns at the institutional level, as illustrated in Table 3 and Figure 5, the average number of affiliated institutions per article was 1.5, and the Degree of Institutional Collaboration was 38.6%. The most active fields regarding institutional-level co-authorship were ‘Marine Agriculture, Fishery’ and ‘Medicine and Pharmacy’. Overall, the co-authorship ratio at the author level was considerably higher compared to the institutional level.
Descriptive Statistics of Authorship Pattern (Degree of Institutional collaboration).


Distribution of the team size (Institution level).
Statistics for research fields exhibiting the highest and lowest author-level and institutional-level collaboration are summarized in Table 4. Additionally, Figure 6 illustrates the statistical distribution of collaboration and institutional collaboration across various research areas. This graph clearly demonstrates that collaboration levels in ‘Arts and Kinesiology’, ‘Social Sciences’, and ‘Interdisciplinary Studies’ are substantially lower relative to other research areas. It also indicates that even within the same broad research field, there is considerable variability in collaboration across sub-areas.
Authorship Pattern Status by Research Area (Division Level, Top vs. Bottom).


Statistical distribution comparison of Degree of Collaboration and Degree of Institutional Collaboration by research area.
The statistical results based on journal language, shown in Table 5, reveal that Korean-language journals have lower numbers of authors, lower Degrees of Collaboration, and lower Degrees of Institutional Collaboration compared to English-language journals and mixed Korean-English journals.
Authorship Pattern Status by Journal language.

The relationship between co-author structures (number of authors and number of institutions) and academic performance indicators (cited counts and views) was analyzed using Pearson correlation coefficients, yielding the following results. Among the four comparison items, significant correlations were confirmed only between the number of authors and institutions (.48) and between the cited counts and views (.39). Conversely, no correlation was observed between co-authorship composition and usage metrics. When analyzed by journal language, both cited counts and views were highest in Korean-language journals (3.1 citations, 184.6 views), followed by mixed Korean-English journals (2.5 citations, 172.1 views), and English-language journals (1.5 citations, 124.6 views). Except for cited counts in Korean-language journals, multi-author papers, categorized by the number of authors and institutions, consistently showed higher cited counts and views compared to single-author papers. The analysis of cited counts and views according to various author-institution combinations is represented through 3D Surface Plot and Heatmap graphs in Figure 7.

Analysis of relationships between number of authors, institutions, cited counts, and paper views: (A) authors versus institutions versus sum of cited count, (B) authors versus institutions versus sum of view, (C) density map: authors versus institutions (avg. of cited count, authors and institutions within 10), and (D) density map: authors versus institutions (avg. of view count, authors and institutions within 10).
According to Figure 7A, single-author articles accounted for 19% of the total cited counts, while multi-author articles contributed 81%. Among author-institution combinations, the (2, 1) combination accounted for the highest proportion at 21.5%, followed by (2, 2) at 13.9%, (3, 1) at 9.6%, and (3, 2) at 7.0%. Similarly, Figure 7B shows that single-author articles comprised 17.2% of total views, whereas multi-author articles accounted for 72.8%. The (2, 1) combination again held the highest proportion at 19.2%, followed by (2, 2) at 11.1%, (3, 1) at 10.4%, and (3, 2) at 7.2%. Figure 7C illustrates average cited counts for combinations of up to 10 authors and 10 institutions, revealing a general increase in average cited counts as the numbers of authors and institutions rise. Similarly, Figure 7D shows average views under the same conditions, indicating that views also increase as the author-institution combination grows larger. Notably, the increase in views becomes particularly pronounced with increasing numbers of authors and institutions. In conclusion, although articles by smaller teams or single authors represent a notable proportion of total cited counts and views, the average cited counts and views clearly increase as the numbers of authors and institutions grow. These findings imply that even small research teams can achieve high-quality outputs, while large-scale collaborations effectively enhance visibility and readership. Consequently, these results emphasize the importance of carefully balancing the scale of collaboration and the significance of research topics when forming research teams.
Analysis of Author’s Institutional Affiliation
In this subsection, we present the results of our analysis concerning the distribution of institution types, countries, regions within Korea, and the current status of co-authorship. This analysis was conducted using experimental data containing identification information of authors’ institutional affiliations. First, we examined the classification of institution types, as shown in Table 6. In calculating the number of papers, we included all authors, including corresponding authors. The total number of institutions identified from author affiliations across all papers was 16,941. The institution types ranked by their proportions within the dataset (section level) were as follows: ‘Private Institutions’ (46.2%), ‘Foreign Institutions’ (24.1%), ‘Educational Institutions’ (13.6%), ‘Governmental Agencies’ (8.1%), and ‘Medical Institutions’ (7.9%). Conversely, when ranked by the number of articles, the order was: ‘Educational Institutions’ (89.0%), ‘Governmental Agencies’ (22.1%), ‘Private Institutions’ (12.3%), ‘Foreign Institutions’ (5.6%), and ‘Medical Institutions’ (4.9%). Similar rankings were observed in terms of the number of authors and institutions. Additionally, when analyzing the number of articles and authors by institution type at the division level (subcategories), the categories with the highest figures were: ‘Educational Institutions’ > ‘University’ (66.2%, 61.6%), ‘Governmental Agencies’ > ‘Public Institutions’ (19.3%, 16.4%), ‘Private Institutions’ > ‘Other Private Institutions’ (6.8%, 3.8%), ‘Foreign Institutions’ > ‘Foreign University’ (3.8%, 2.9%), and ‘Medical Institutions’ > ‘General Hospital’ (4.0%, 2.4%).
Descriptive Statistical Overview of Institutional Type Classification of Identified Institution (Authors’ Affiliations) in Experimental Data.

Next, we examined the co-authorship status involving domestic and international collaborations within the experimental data based on three publication types: Korean-language journals, English-language journals, and overall. ‘Domestic Solo’ articles represented 97.5%, 71.3%, and 94.8%, respectively; ‘Overseas Solo’ articles accounted for 0.6%, 23.2%, and 2.2%; and ‘International Collaboration’ articles comprised 1.9%, 5.5%, and 3.0%. Furthermore, we analyzed the proportion of authors affiliated with domestic and overseas institutions across these publication types. ‘Domestic Institutions’ accounted for 98.9%, 76.4%, and 96.2% respectively, while ‘Overseas Institutions’ made up 1.1%, 23.6%, and 3.8%. Notably, in English-language journals, both the proportion of papers authored by individuals affiliated with overseas institutions and the level of international collaboration were higher compared to Korean-language journals. This indicates a preference among foreign-affiliated authors for English-language journals, even among those published in Korea. The detailed statistical analysis can be found in Table 7.
Statistics on the Composition of Articles and Authors by Journal Language and Collaboration Type.

Based on institutional country information, we analyzed the distribution of authors’ affiliations by continent and country, as presented in Table 8 and Figure 8. Regardless of whether Korea was included, the proportion of institutions and authors from Asian countries was significantly higher than from other continents. When analyzing the top five countries worldwide according to their share of articles and authors, we identified the following: Republic of Korea (94.8%, 96.4%), United States of America (1.1%, 0.5%), Japan (0.6%, 0.5%), China (0.6%, 0.5%), and India (0.5%, 0.4%). Meanwhile, an examination of international collaboration among Korean-authored papers published in SCOPUS-indexed international journals between 2015 and 2020 revealed that 67.2% of articles were authored exclusively by researchers affiliated with Korean institutions, whereas 32.8% involved international collaboration with co-authors from both Korean and non-Korean institutions. The countries exhibiting the highest collaboration rates with Korean researchers were the United States (14.7%), China (6.1%), Japan (3.6%), India (3.2%), the United Kingdom (2.8%), and Germany (2.7%). These findings demonstrate significantly higher international research collaboration rates in articles published internationally compared to those published domestically.
Statistics on the Composition of Institutions and Appearances by Continent.


Statistical overview of articles by authors from international institutions, categorized by country on the global map, excluding South Korea.
The distribution of authors affiliated with domestic institutions across the 17 major cities and provinces of Korea is shown in Figure 9. The Seoul Capital Area (Seoul Special City 25.1%, Incheon Metropolitan City 3.2%, Gyeonggi-do Province 10.6%) accounted for 38.9% of authors, while Busan (10.0%) and Daejeon (9.6%) also exhibited relatively high shares among other regions. Additionally, articles by authors affiliated with institutions located in the Seoul Capital Area represented 44.9% of total articles, with Seoul alone accounting for 30.2%.
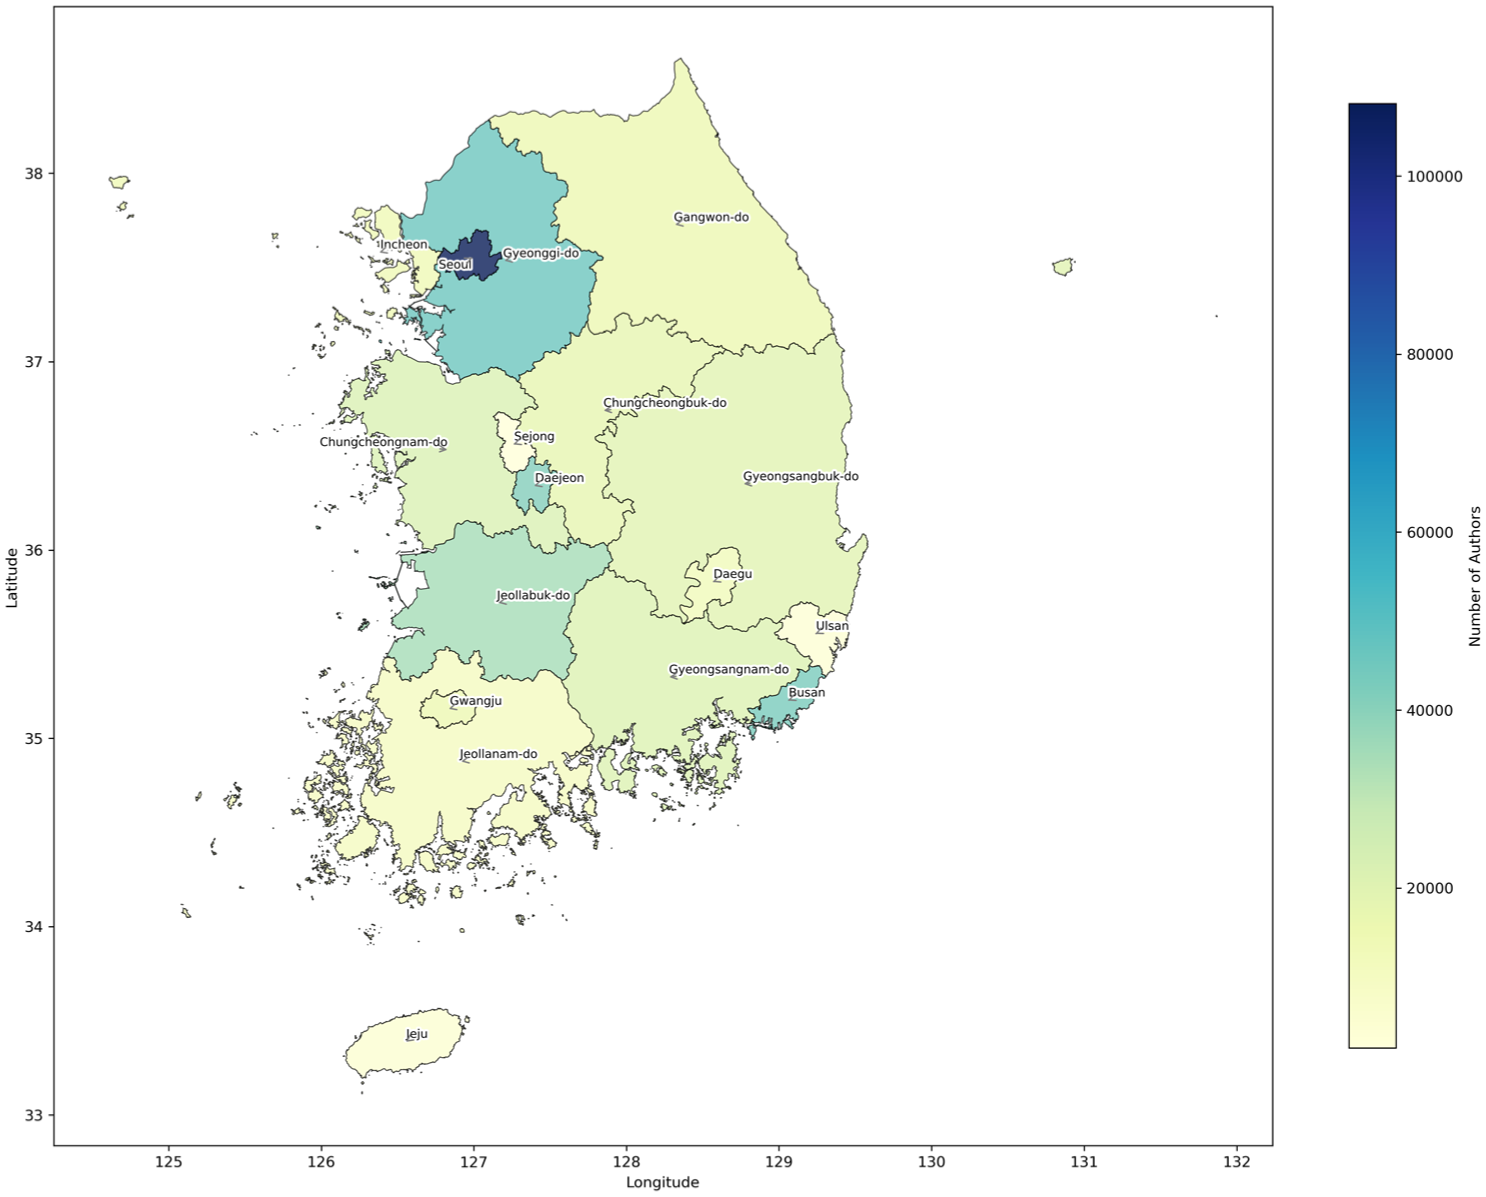
Distribution status of articles across 17 major cities and provinces of Korea. South Korea is made up of 17 first-tier administrative divisions. Special city (1) & metropolitan cities (7) : Seoul, Pusan, Daegu, Incheon, Gwangju, Daejeon, Ulsan, Sejong, Provinces (10) : Gyeonggi-do, Gangwon-do, Chungcheongbuk-do, Chungcheongnam-do, Jeollabuk-do, Jeollanam-do, Gyeongsangbuk-do, Gyeongsangnam-do, Jeju (Jeju-do).
Finally, we calculated the cosine correlation coefficient based on geographic distance information between domestic regions, measured using distances between regional administrative centers as indicated on Google Maps. The analysis revealed numerous cases where similarity was high between provinces and their corresponding central cities. For instance, as illustrated in Figure 10, correlation analysis yielded high similarity coefficients for the pairs ‘Gwangju’:‘Jeollanam-do’ (.97), ‘Busan’:‘Gyeongsangnam-do’ (.95), ‘Daegu’:‘Gyeongsangbuk-do’ (.95), ‘Seoul’:‘Gyeonggi-do’ (.93), and ‘Daejeon’:‘Chungcheongnam-do’ (.93). Furthermore, this analysis demonstrated a weak negative correlation (approximately −.3) between the geographic distances among domestic regions and their co-occurrence frequency, confirming that shorter distances tend to correspond to higher collaboration levels.
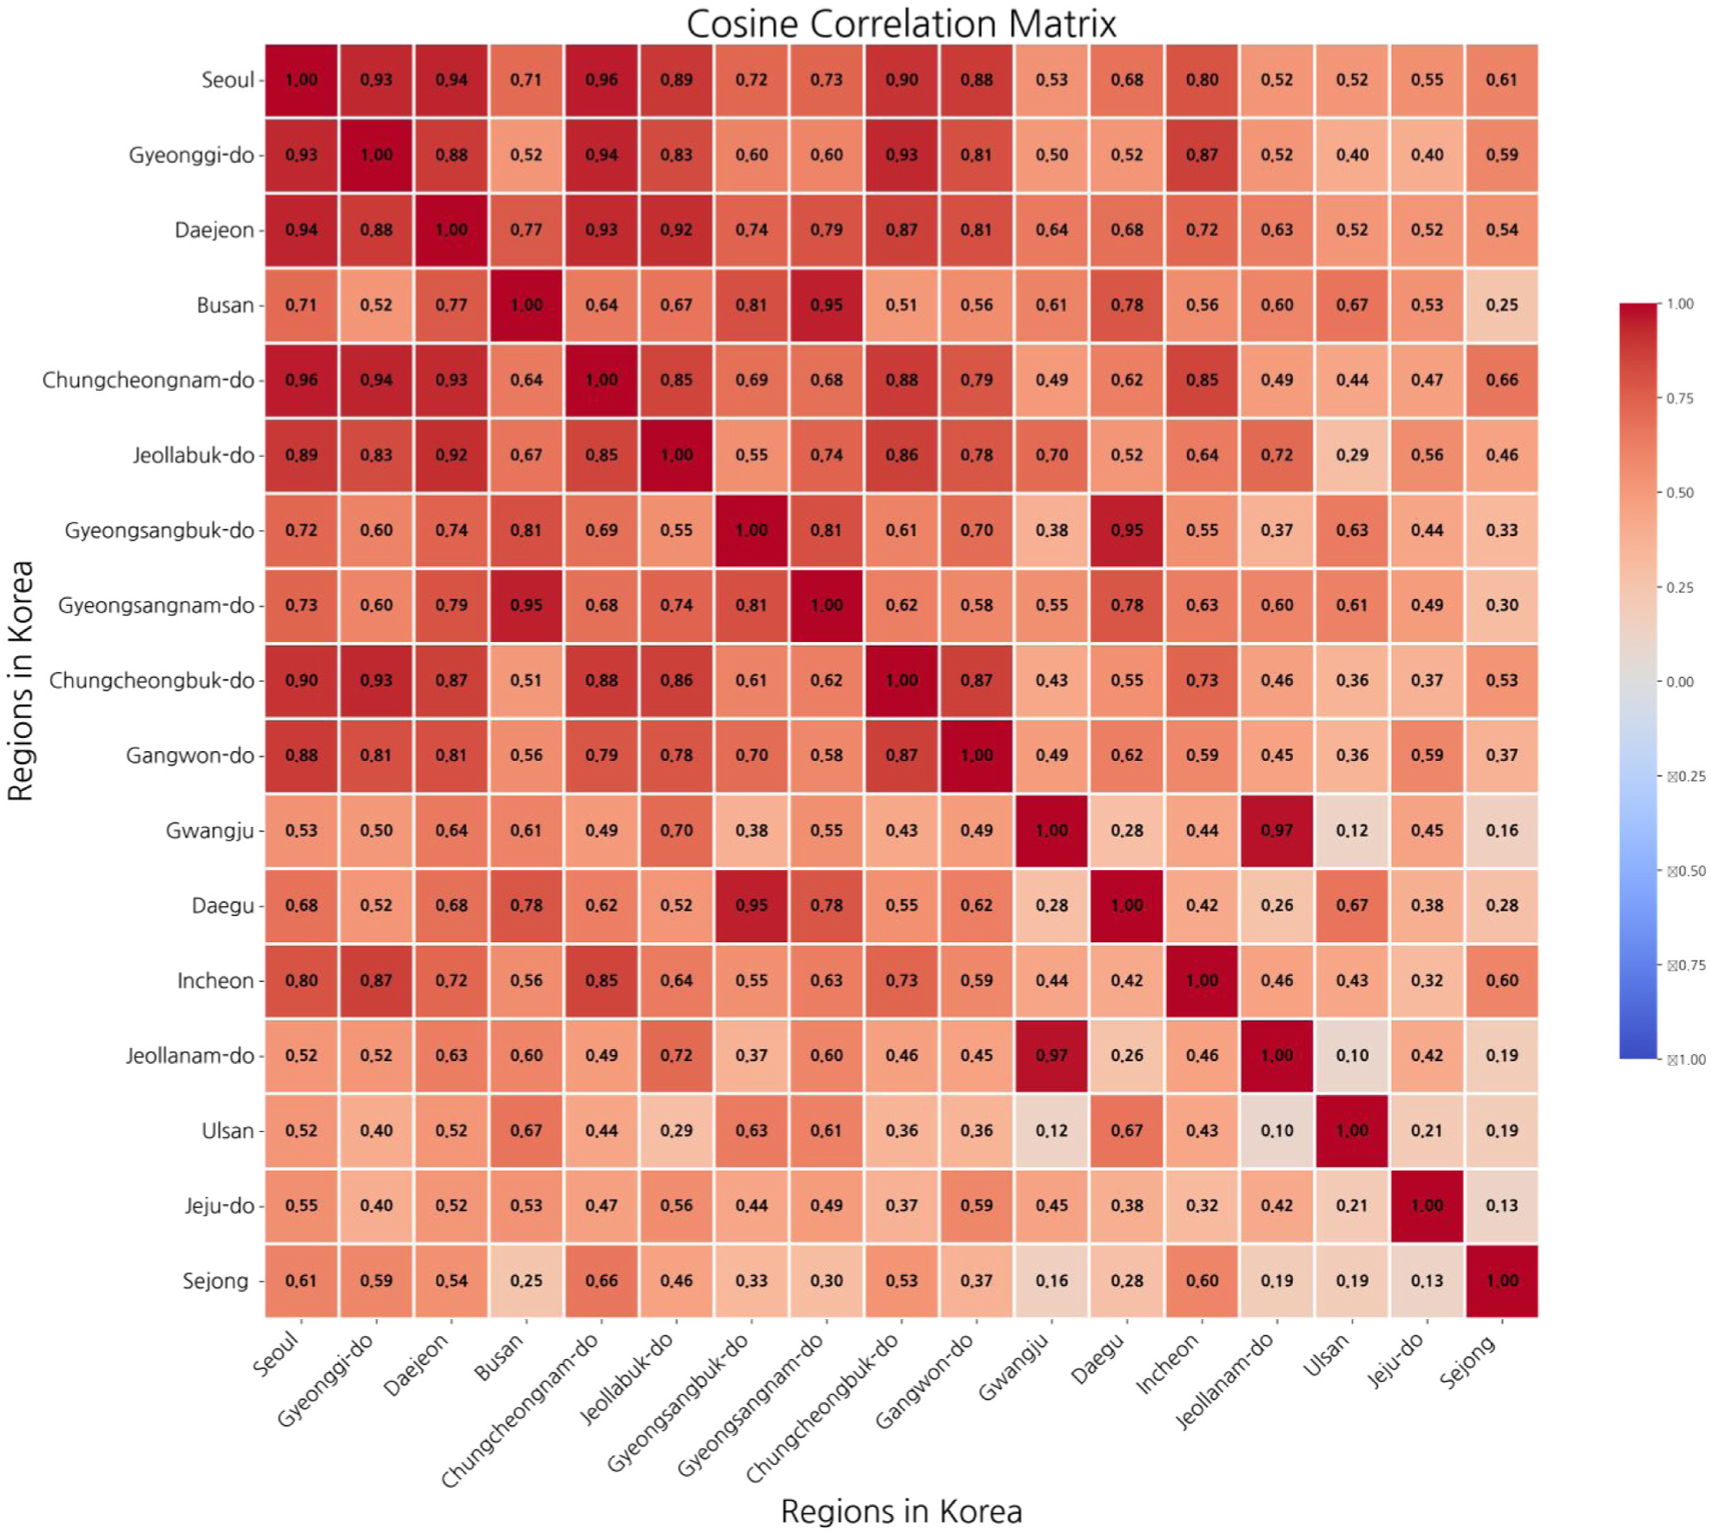
Cosine similarity matrix based on co-occurrence among 17 major cities and provinces in Korea.
Analysis of Author’s Department Affiliation
In this subsection, we present a comprehensive analysis of departmental composition and concentration across various research fields, based on experimental data integrating information on the departmental affiliations of authors at university institutions. Figure 11 illustrates how departmental distributions differ among various research areas at the division level. In the engineering field, ‘ELECTRIC/ELECTRONICS/COMPUTERS’ accounted for the largest proportion (30.5%). Within the natural sciences, ‘MATHEMATICS, PHYSICS, ASTRONOMY, EARTH’ was the most prominent department (15.5%). For Medicine and Pharmacy, ‘MEDICAL TREATMENT’ held the dominant share (57.5%), whereas in Marine Agriculture and Fishery, ‘AGRICULTURE, FORESTRY AND FISHERIES’ comprised the largest proportion (44.5%). ‘SOCIAL SCIENCE’ led in the Interdisciplinary Studies area (24.7%), and within the Social Science field, ‘MANAGEMENT AND ECONOMY’ represented the largest share (34.3%). Lastly, in Arts and Kinesiology, ‘ART’ accounted for the highest proportion (23.6%). These findings clearly demonstrate significant variations in departmental distributions across different research fields. Furthermore, when categorizing by department type at the group level, we carefully examined and found that the proportion of articles authored exclusively by a single department versus those collaboratively authored by multiple departments consistently remained at 80.6% and 19.4%, respectively. Our comprehensive analysis also explicitly highlighted that the Degree of Departmental Collaboration stood at 19.4%. Additionally, among papers authored exclusively by single departments, 21.2% had a single author, whereas a substantial 78.8% had multiple authors.

Statistics on the composition of departmental articles by research area based on the classification of university-affiliated authors’ departments.
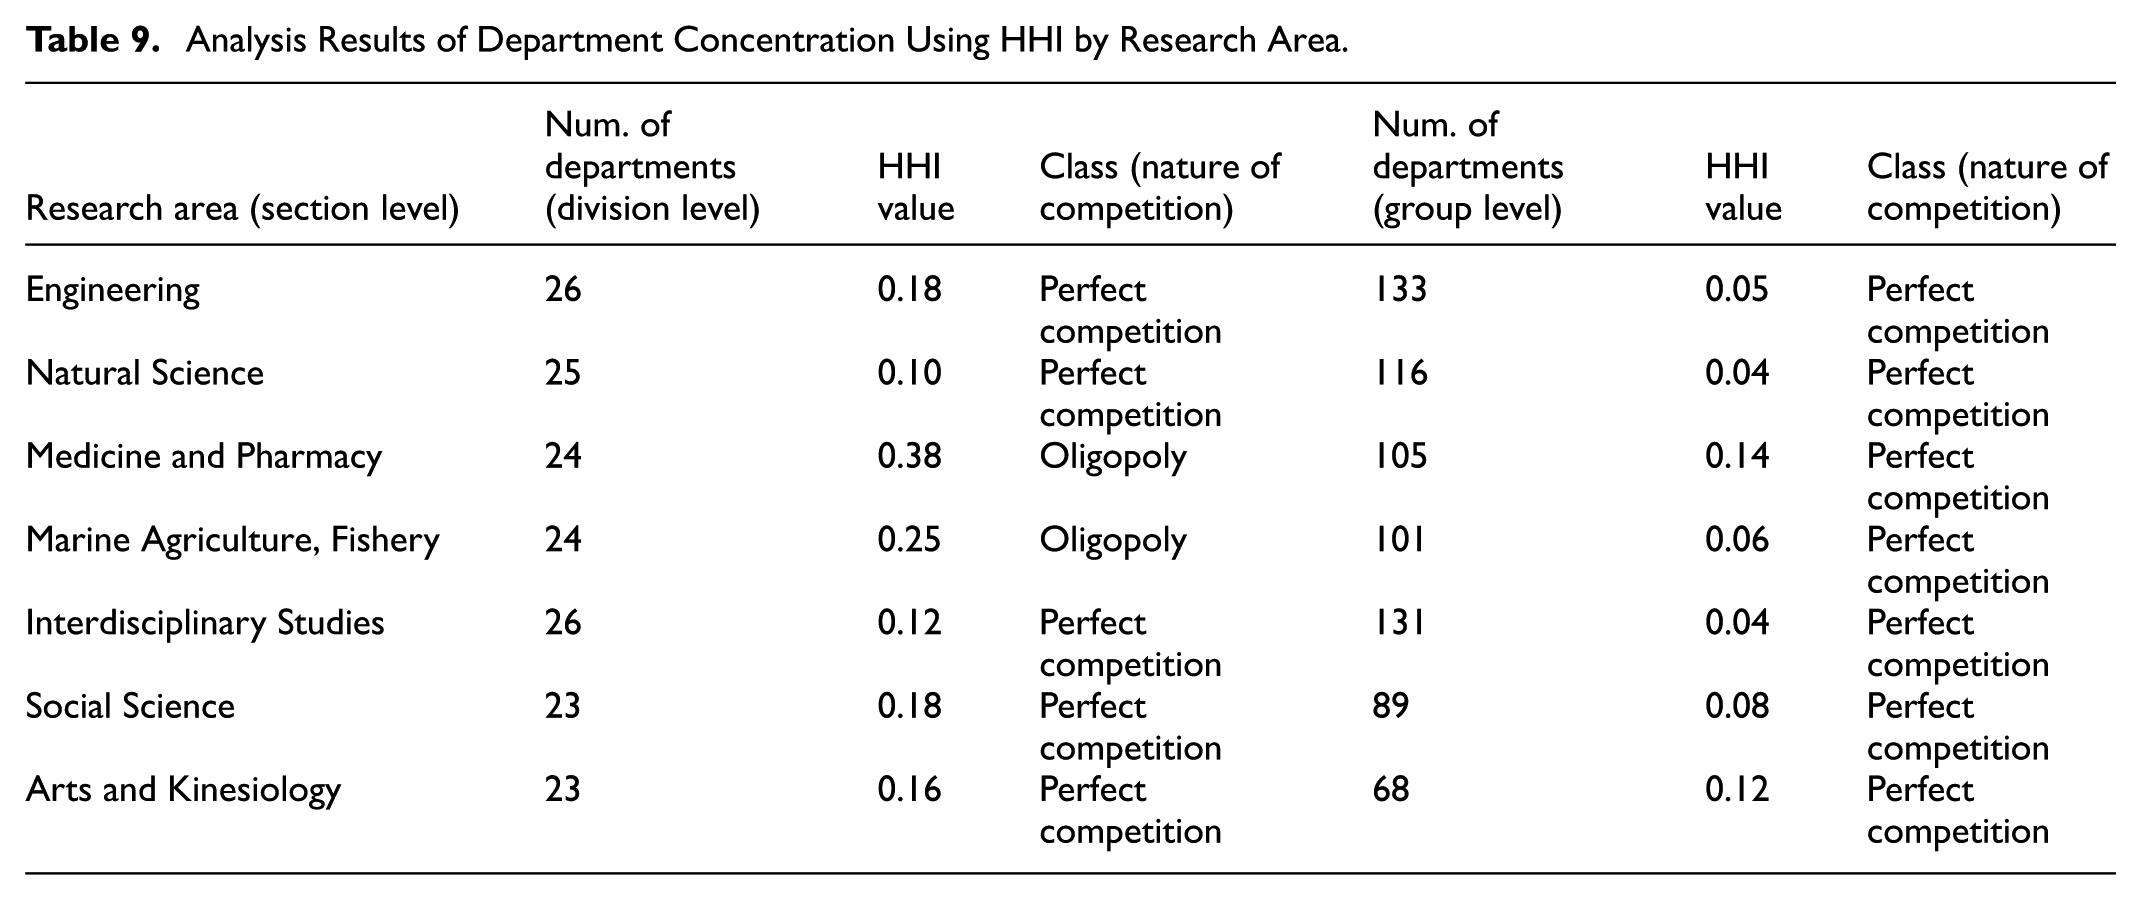
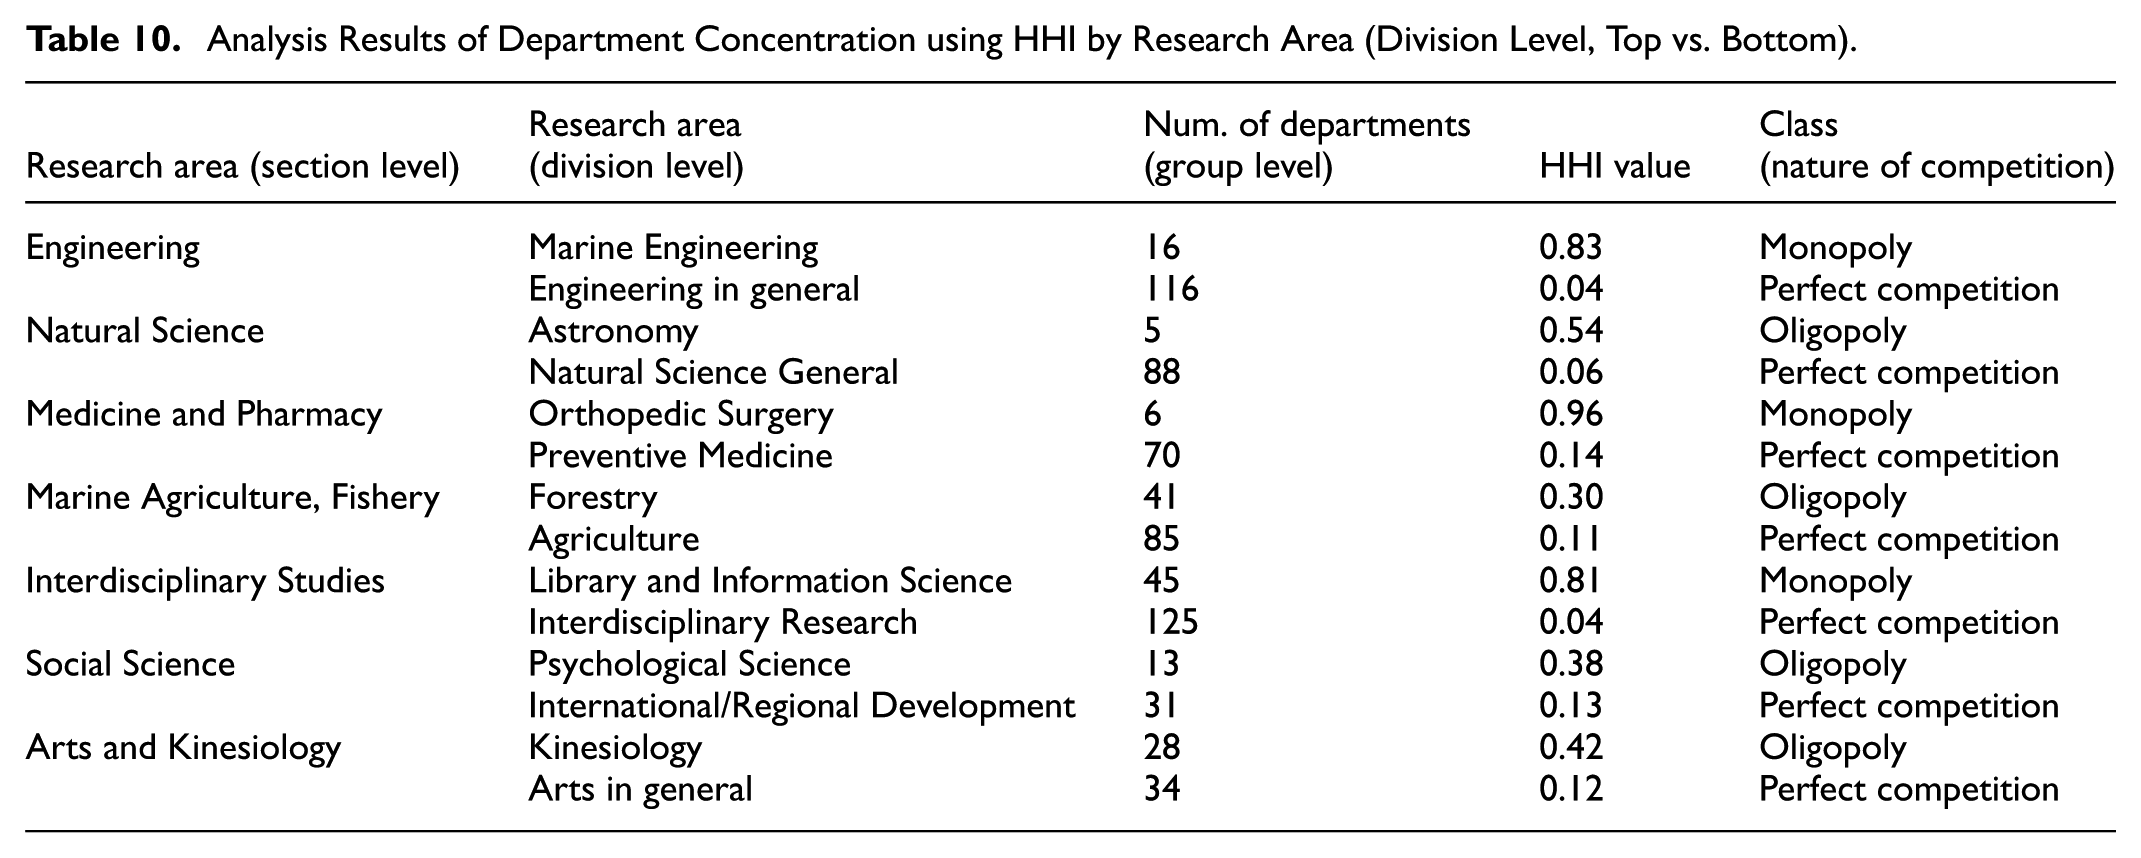
Tables 9 and 10 summarize the results from measuring the number of departmental types and departmental concentration across research areas. Specifically, only two fields (‘Medicine and Pharmacy’ and ‘Marine Agriculture, Fishery’) displayed somewhat concentrated departmental structures characterized as ‘Oligopoly’ at the division level. Conversely, all other fields exhibited structures characterized as ‘Perfect Competition’, meaning that these research areas are broadly distributed among many departments. Moreover, upon closer examination of the subfields with the highest and lowest Herfindahl-Hirschman Index (HHI) values at the group level within each research field, as detailed in Table 10, substantial disparities in departmental concentration were evident among these subfields. Subfields with particularly low HHI values, indicating high competition among numerous departments, included ‘Interdisciplinary Research’ (0.04), ‘Engineering in General’ (0.04), and ‘Natural Science General’ (0.06). Conversely, subfields with high HHI values, indicating dominance by specific departments and consequently lower competition, were identified as ‘Internal Medicine’ (0.96), ‘Marine Engineering’ (0.83), and ‘Library and Information Science’ (0.81).
Analysis Results of Department Concentration Using HHI by Research Area.
Analysis Results of Department Concentration using HHI by Research Area (Division Level, Top vs. Bottom).
The results obtained from calculating the cosine correlation coefficient, based on the number of co-occurrences among department types at the division level, are presented in Figure 12 as a correlation matrix. When analyzing highly correlated pairs, it was observed that ‘CHEMICALS, POLYMERS, ENERGY’ exhibited a notably high similarity to both ‘CHEMISTRY/LIFE SCIENCE/ENVIRONMENT’ (.91) and ‘Materials’ (.91). Similarly, ‘Medical Treatment’ demonstrated significant similarity to both ‘Health’ (.92) and ‘Pharmacy’ (.91). Furthermore, ‘Industry/Safety’ exhibited high similarity to ‘Machinery’ (.91) and ‘Construction’ (.89).

Cosine similarity matrix co-occurrence among department types (division level).
Social Network Analysis of Co-Authorship Networks
Finally, in this subsection, we analyzed network characteristics and centrality measures based on unit-level co-occurrence matrices related to authors’ affiliated institutions, institution types, countries, regions, and department types (in the case of university-affiliated institutions). We also provided visualization maps for each of these networks. The main characteristics of the six networks generated for each unit of analysis are presented in Table 11.
Co-authorship Network Characteristics – Macro Level Analysis Results.

The degree, weighted degree, and three centrality indices were calculated for each network, and the top-ranked items are summarized in Table 12. An analysis of the items with the highest centrality across different units of analysis revealed the following results. At the Institution Type (Division level), ‘University’ ranked highest. At the Institution level, ‘Seoul National University’ had the highest centrality. At the Country level, the ‘ United States of America’ ranked highest after ‘Republic of Korea’. At the Regional level (within Korea), ‘Seoul’ ranked highest based on weighted degree centrality, followed by ‘Gyeonggi-do’, ‘Daejeon’, and ‘Busan’. At the Department Type (Division level), ‘ELECTRIC/ELECTRONICS/COMPUTERS’ had the highest centrality. At the Department Type (Group level), ‘COMPUTER SCIENCE/COMPUTER SCIENCE’ was the most central according to degree and closeness centrality, whereas ‘BUSINESS MANAGEMENT’ was ranked highest in terms of betweenness centrality.
Network Centrality Analysis Results by Analysis Unit and Metric (Top 5 for Each).

Figure 13 presents the results of the correlation analysis between network centrality measures (of author-affiliated institutions) and publication productivity indicators such as the number of publications, cited counts, and article views, using Spearman’s correlation coefficient. Institutions characterized by higher research collaboration and productivity generally exhibited greater centrality within the network (degree centrality and betweenness centrality). Specifically, the correlation coefficient between degree centrality and publication output was .60, indicating a strong positive correlation, whereas the correlation coefficient between betweenness centrality and publication output was even higher at .77, indicating a stronger positive relationship. These findings suggest that institutions with higher publication productivity can enhance their network centrality through active collaboration and bridging roles. Additionally, the correlation coefficient between degree centrality and betweenness centrality was .69, revealing a strong association and highlighting a close linkage between collaborative activities and intermediary roles within the network. The analysis of correlations between network centralities and cited counts showed correlation coefficients of .37 with degree centrality, .42 with betweenness centrality, and .38 with closeness centrality. For views, the correlations were .41 with degree centrality, .47 with betweenness centrality, and .39 with closeness centrality. Overall, these correlations, approximately around .4, indicate moderate positive relationships. These results suggest that institutional network centrality and academic performance indicators, such as cited counts and views, demonstrate moderately positive correlations. In conclusion, researchers and institutions can strengthen their central positions within collaborative networks and continuously enhance their academic impact and influence through high publication output and active collaboration.

Correlation analysis result (network centrality metrics, publication productivity, and usage metrics).
A visualization of the institution-level network as a density map is provided in Figure 14. This map highlights the high density and centrality of domestic universities and government-affiliated research institutes, while private and foreign institutions exhibit lower densities and appear distributed toward the periphery.

Density visualization map based on co-authorship network (Top 1,274 Institutions, Minimum total link strength of an item: 30). The analysis method was Lin/log modularity in VOSviewer. Each node represents an Author’s Affiliated Institution, and the node size is proportional to the number of the co-occurrence. Different colors represented the frequency of keyword occurrences, and red indicated the highest frequency.
The map visualizing the network at the Institution Type (Division level) is depicted in Figure 15. This visualization clearly indicates that highly central domestic universities play a pivotal role, forming robust co-authorship relationships with public institutions and other types of institutions.

Visualization map based on co-authorship network (27 institution types). The analysis method was Lin/log modularity in Vosviewer. Each node represents an Institution Type (Division Level), and the node size is proportional to the number of the co-occurrence. Different colors indicated the variety of clusters.
The visualization map of the co-authorship network at the country level is illustrated in Figure 16. From examining this map, it is evident that Korea maintains notably stronger collaborative ties with countries such as the United States, Japan, China, and India compared to its relationships with other countries.
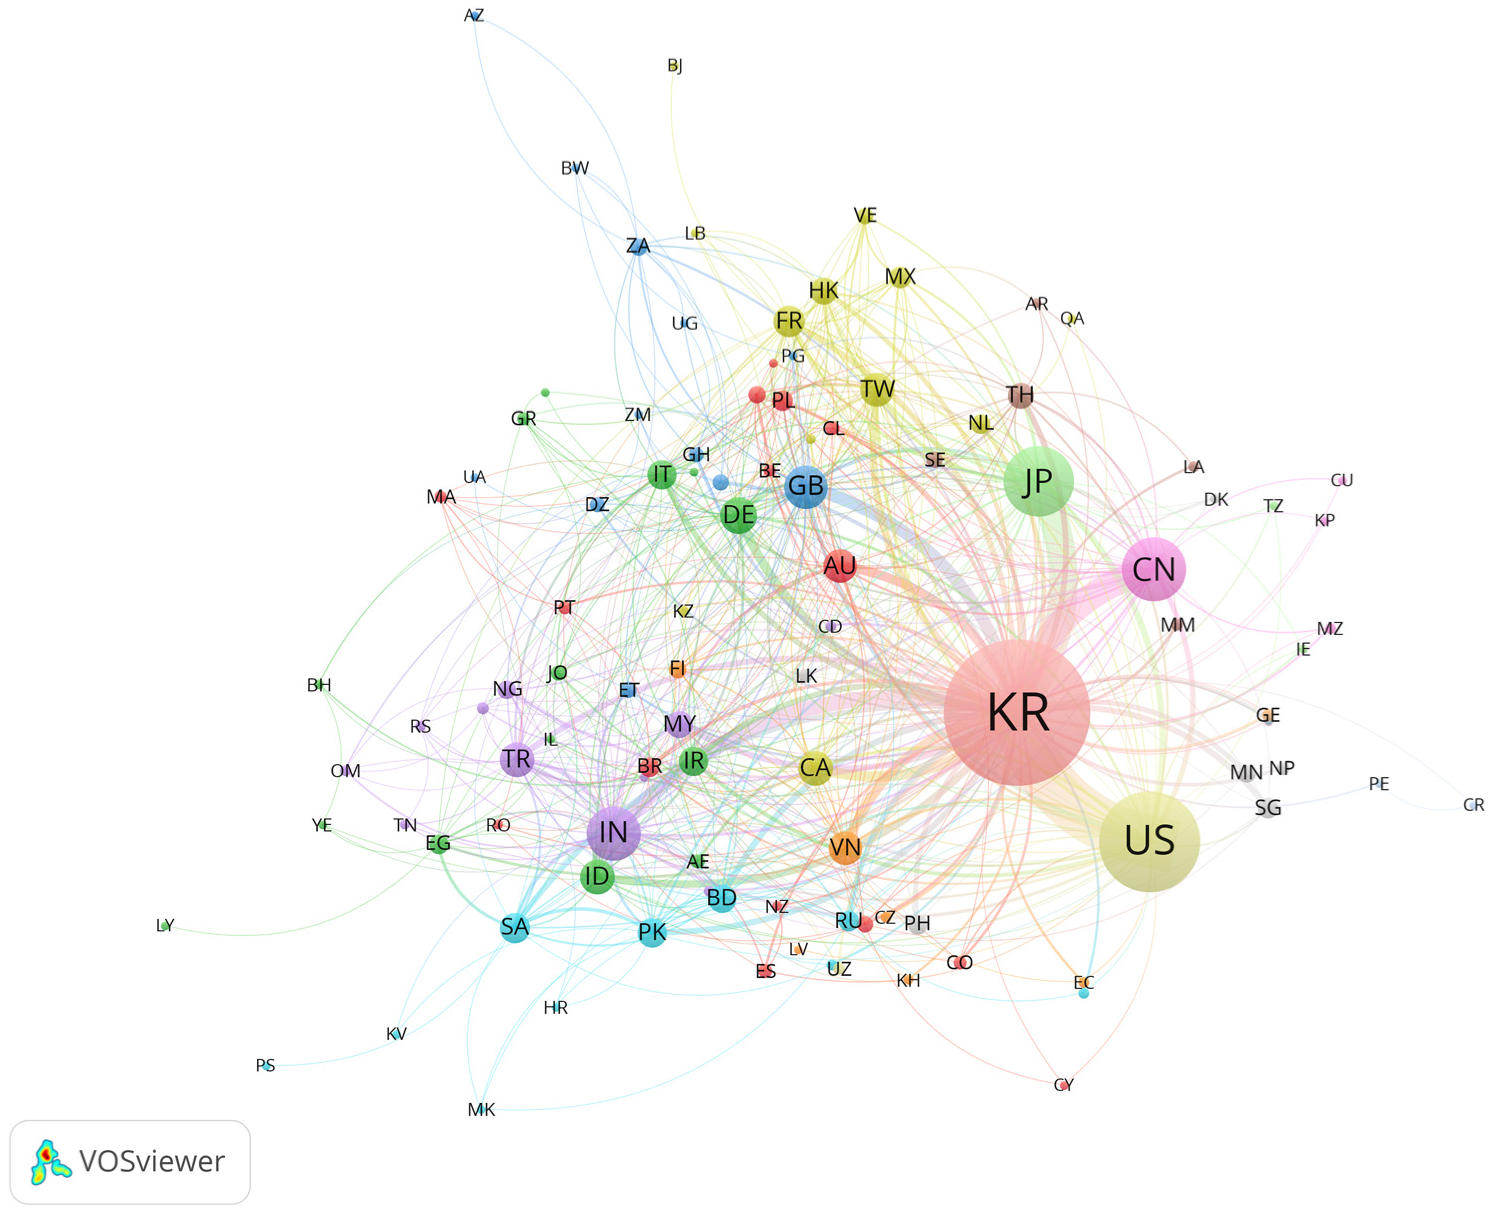
Visualization map based on co-authorship network (100 countries). The analysis method was Lin/log modularity in Vosviewer. Each node represents a country, and the node size is proportional to the number of the co-occurrence. Different colors indicated the variety of clusters.
Figure 17 presents the co-authorship network at the regional level within Korea. A closer inspection of this map reveals prominently strong collaborative connections centered around the Seoul and Gyeonggi-do regions, situated at the heart of the capital area. Strong partnerships are particularly notable between Seoul and Gyeonggi-do, as well as between Seoul and Daejeon. This visualization highlights robust collaboration patterns linking provinces and their central cities.

Visualization map based on the co-authorship network at the regional level in Korea. The analysis method used was Association strength in VOSviewer. Each node represents one of the 17 major cities and provinces, with node size proportional to co-occurrence frequency. Different colors indicate distinct clusters.
Visualization maps of the co-authorship network at the department type (Division and Group level) are shown in Figures 18 and 19. Firstly, at the division level, the map highlights departments with high network centrality such as ‘ELECTRIC/ELECTRONICS/COMPUTERS’, ‘CONSTRUCTION’, and ‘MACHINERY’, emphasizing that departments with related academic disciplines tend to form tightly connected networks. Each node represents a department type, with node size proportional to the frequency of co-occurrence, and colors indicating different clusters.

Visualization map based on co-authorship network (26 department types – division level). The analysis method was Lin/log modularity in VOSviewer. Each node represents one of department Types, and the node size is proportional to the number of the co-occurrence. Different colors indicated the variety of clusters.

Visualization map based on co-authorship network (135 department types – group level). The analysis method was Fractionization in VOSviewer. Each node represents one of department Types, and the node size is proportional to the number of the co-occurrence. Different colors indicated the variety of clusters.
Upon analyzing the group-level co-authorship network map, it becomes evident that departments within similar academic disciplines cluster closely together, forming collaborative connections with departments from other academic domains.
Discussion
This study analyzed research collaboration patterns in South Korea by examining co-authorship networks and collaborative structures across institutions, institution types, countries and regions, and academic departments in domestic scientific journals. The analytical dataset included 149,217 papers from 500 Korean academic journals listed in the KSCD, and a systematic classification framework was applied to authors’ institutional affiliation data to construct the dataset. To investigate long-term trends in author team size and author-level collaboration, additional author information was collected from 433,593 papers published in the same journals between 1980 and 2014. For comparative analysis of domestic and international collaboration, 350,439 papers published between 2015 and 2020 in SCOPUS-indexed journals with at least one Korean author were examined, focusing on team size and international partnership patterns. The study employed bibliometric methods and Social Network Analysis (SNA) techniques.
Based on the findings, the key results can be summarized as follows:
Firstly, the co-authorship analysis revealed an average of 3.1 authors per paper and an overall Degree of Collaboration of 80.8%. These metrics represent significant increases from 1980, with the average number of authors per paper rising by 66.7% and the Degree of Collaboration increasing by 77.4%, but has remained similar since 2007. At the institutional level, the average number of institutions per paper was notably lower at 1.5, with the Degree of Institutional Collaboration of 38.6%, indicating that research collaboration occurs predominantly at the author rather than institutional level. Comparative analysis with SCOPUS-indexed international journals showed that Korean authors publishing internationally exhibited considerably higher collaboration levels, with an average and median author count of 11.7 and 5, respectively, and a collaboration degree of 95.6%.
Secondly, significant variations were observed in collaboration patterns across different fields of study. STEM fields (Science, Technology, Engineering, and Medicine) showed higher levels of collaboration at both author and institutional levels compared to humanities and social sciences. The field demonstrating the highest collaborative activity was ‘Marine Agriculture, Fishery’. Additionally, Korean-language journal articles showed consistently lower author counts, collaboration degrees, and institutional collaboration levels compared to articles published in English-language and mixed-language journals.
Thirdly, analysis of correlations between collaborative structures and usage metrics (cited counts and views) indicated that the number of authors per paper was significantly correlated with the number of participating institutions. However, no statistically significant correlation was directly observed between overall co-authorship composition and usage metrics. Papers authored by smaller teams or single authors comprised a notable proportion of total cited counts and views, yet average citation and view counts progressively increased as the number of authors and institutions grew, highlighting that collaborative research with larger author networks tends to achieve higher visibility and academic impact.
Fourthly, analysis of author institutional affiliations identified a total of 16,941 institutions, with educational institutions accounting for the highest proportion of publications (89.0%), followed by governmental agencies (22.1%), private institutions (12.3%), foreign institutions (5.6%), and medical institutions (4.9%). Major contributing institution subcategories included universities (66.2% of publications and 61.6% of authors), public institutions (19.3%, 16.4%), other private institutions (6.8%, 3.8%), foreign universities (3.8%, 2.9%), and general hospitals (4.0%, 2.4%). International collaboration within domestic journals was relatively limited, with domestic-only papers comprising 94.8%, overseas-only 2.2%, and international collaborative papers 3.0%. English-language journals exhibited notably higher proportions of foreign-affiliated authors and international collaboration compared to Korean-language journals, indicating a clear preference among foreign authors for English-language publications even within Korea.
Fifthly, geographically, authorship was predominantly concentrated in Asia, particularly within South Korea (94.8% of authors). Other notable contributing countries included the United States (1.1%), China (0.6%), Japan (0.6%), and India (0.5%), though these contributions were comparatively minor. Analysis of Korean authors publishing in SCOPUS-indexed international journals indicated significantly higher levels of international collaboration (32.8%), predominantly involving collaborations with the United States (14.7%), China (6.1%), Japan (3.6%), and India (3.2%), highlighting stark contrasts between domestic and international publishing practices.
Sixthly, at the domestic level, research activities were highly centralized within the Seoul Capital Area, accounting for 38.9% of authors and approximately half of all publications. Busan (10.0%) and Daejeon (9.6%) were also prominent regional contributors. Moreover, analysis based on geographical proximity, measured through cosine similarity, revealed a positive correlation between regional closeness and collaboration frequency, emphasizing the importance of geographical proximity in fostering research cooperation.
Seventhly, departmental collaboration analysis within university publications revealed significant differences in disciplinary structure and collaboration intensity. The department ‘ELECTRIC/ELECTRONICS/COMPUTERS’ accounted for the largest share of departmental publications (30.5%), followed by the natural sciences cluster, including ‘MATHEMATICS, PHYSICS, ASTRONOMY, EARTH’ (15.5%). The overall Degree of Departmental Collaboration was relatively low at 19.4%, with roughly 80% of papers authored within a single department. Notable disparities in departmental concentration were observed; fields such as ‘Interdisciplinary Research’ and ‘Engineering in General’ exhibited high competition (HHI = 0.04), whereas specialized fields like ‘Marine Engineering’ (0.83) and ‘Library and Information Science’ (0.81) displayed higher concentration and lower competition. Furthermore, cosine correlation analysis of departmental co-occurrences demonstrated stronger similarities among closely related academic fields.
Lastly, Social Network Analysis (SNA) offered insights into institutional and departmental structural centrality and collaborative positioning. Institutions demonstrating higher collaboration levels and research productivity exhibited greater network centrality, as evidenced by strong positive correlations between publication output and centrality metrics, notably degree centrality (0.60), and betweenness centrality (0.77). Cited counts and article views also showed moderate positive correlations with network centrality metrics. These findings underscore the potential for institutions to enhance their academic influence and central network positions through proactive collaboration and high research productivity.
Based on these findings, the study proposes policy recommendations to address identified collaboration challenges and regional disparities. To mitigate imbalances, research funding and evaluation frameworks should incentivize regional and international collaborative research, fostering diverse, and inclusive partnerships. Additionally, enhancing nationwide infrastructure and data-sharing platforms is crucial to ensure equitable access to research resources for scholars in all regions, ultimately strengthening South Korea’s global research competitiveness, regional equity, and sustainable academic development.
Conclusion
The study analyzed the collaborative structure and network characteristics of academic research in Korea from various perspectives, revealing key trends and characteristics of academic collaboration in Korea. The main findings of the study were as follows: First, the degree of collaboration was 80.8%, and the degree of institutional collaboration was 38.6%, with higher collaboration levels observed in STEM fields. Papers authored by domestic researchers accounted for 95% of the total, and international collaboration was limited. English-language journals had higher collaboration rates and proportions of international collaboration than Korean-language journals. This highlighted the need for increased international collaboration and suggested that future efforts prioritize the internationalization of Korean academic journals and the expansion of global collaborations. Second, research collaboration was mainly concentrated in the Seoul capital area, which accounted for nearly half of all publications and 38.9% of authors. Busan (10.0%) and Daejeon (9.6%) followed, but regional collaboration overall was limited. The weak negative correlation between geographic distance and collaboration frequency showed that closer regions collaborated more often. These results highlight the need for policies to reduce regional gaps in research infrastructure and promote balanced collaboration across Korea. Third, the research network analysis showed that institutions with higher network centrality tended to produce more papers and have higher academic performance (cited counts and views), indicating that research collaboration played an important role in increasing academic impact and performance. Fourth, there was a large difference in the concentration of collaboration by research field, and it was confirmed that exclusive collaboration structures were active in some fields, with evidence showing multidisciplinary collaborations were active in others. This suggested that collaboration strategies tailored to the characteristics of research fields were necessary. This study provided an important foundation for a comprehensive understanding of the collaboration structure and network characteristics of academic research in South Korea.
Footnotes
Ethical Considerations
There are no human participants in this article and informed consent is not required.
Funding
The authors disclosed receipt of the following financial support for the research, authorship, and/or publication of this article: This work was supported by Institute of Information & Communications Technology Planning & Evaluation (IITP) grant funded by the Korea government (MSIT) (No. RS2023-00235509, Development of Security Monitoring Technology Based Network Behavior against Encrypted Cyber Threats in ICT Convergence Environment).
Declaration of Conflicting Interests
The authors declared no potential conflicts of interest with respect to the research, authorship, and/or publication of this article.
Data Availability Statement
Data sharing not applicable to this article as no datasets were generated or analyzed during the current study.