
Abstract
Against the backdrop of intensifying anti-globalisation, scientific and technological cooperation among regional international organisations plays an increasingly significant role. Cooperation among the Shanghai Cooperation Organization (SCO) countries has continued deepening—expanding from the security domain to include education, science, technology, and other areas—and has become an important aspect of international scientific and technological cooperation. This study uses the Web of Science core collection of co-publications to construct a collaborative network and explore the scientific collaborative characteristics and influencing factors of SCO. The main findings are as follows. (a) The amount of cooperation from countries notably increased after 2015. Chemistry, physics, engineering, and computing, as important application-oriented subjects, are the main research areas of scientific collaboration. (b) Major differences exist in collaborative linkages of institutions between SCO member states in the network, based on Social Network Analysis. (c) A Quadratic Assignment Procedure regression analysis reveals that academic size differences and social proximity are key factors promoting SCO scientific collaboration. Further, geographical distance, economic proximity, language similarity, and differences in university size were heterogeneous in certain years.
Plain language summary
Why was the study done? Against the backdrop of intensifying anti-globalisation, scientific and technological cooperation among regional international organisations plays an increasingly significant role. Cooperation among the Shanghai Cooperation Organization (SCO) countries has continued deepening—expanding from the security domain to include education, science, technology, and other areas—and has become an important aspect of international scientific and technological cooperation. What did the researchers do? This study uses the Web of Science core collection of co-publications to construct a collaborative network and explore the scientific collaborative characteristics and influencing factors of SCO. What did the researchers find? The main findings are as follows. (I) The amount of cooperation from countries notably increased after 2015. Chemistry, physics, engineering, and computing, as important application-oriented subjects, are the main research areas of scientific collaboration. (II.) Major differences exist in collaborative linkages of institutions between SCO member states in the network, based on Social Network Analysis. (III.) A Quadratic Assignment Procedure regression analysis reveals that academic size differences and social proximity are key factors promoting SCO scientific collaboration. Further, geographical distance, economic proximity, language similarity, and differences in university size were heterogeneous in certain years. What do the findings mean? This study provides useful information and policy recommendations based on its analysis of scientific collaborations among SCO countries.
Keywords
Introduction
Innovation facilitates the sustainable development of nations and improves global competitiveness (Guan et al., 2021). The study of research and development (R&D) activities is of great importance because science and technology (S&T) is currently a dominant force in society (Moed, 2002). Some studies have indicated that a dense network is favourable for knowledge transfer and innovation (Mao et al., 2019). In a successful knowledge transfer, the experience of one network actor affects that of another (Walter et al., 2007). The extent of diffusion is affected by the structure of the network over which it occurs, and there is an identifiable region in the space of structures in which diffusion is significantly more complete than elsewhere (Cowan & Jonard, 2004). Network structure or topology is a key property that significantly impacts knowledge diffusion (Luo et al., 2015).
With deeper scientific collaboration, modern society is becoming a knowledge society that uses knowledge production and utilisation as core resources (Mao et al., 2019). Scientific cooperative research can be considered the co-production of knowledge, whereby inputs are transformed into outputs (Ponds et al., 2009). Research collaboration is critical for value creation and growth, making countries key participants in technological advances. Collaboration provides information pertaining to development trends and helps reduce the time required for the development of innovation through access to specialised process technologies between countries (Stojčić, 2020). The international research cooperation is defined as the proportion of publications with at least one author from another state anywhere in the world (Jung, 2012). Promoting international scientific research cooperation helps exchange skills, gain complementary knowledge, access facilities, professional advancement, and cost-sharing (Hassan et al., 2015).
The Shanghai Cooperation Organization (SCO), which is younger than other international organisations, presents signs and issues characteristic of any young and growing organism. The SCO has a great potential for numerous unique parameters, and the constant search for new possibilities determines the direction of further growth (Alimov, 2018), such as green technology innovation (Li & Yan, 2024), socio-economic cooperation (Khayrullayevich, 2024), education (Khayrullayevich, 2023), agricultural trade (Abudukeremu et al., 2024), the countries’ inter-university cooperation in the SCO (Egorova et al., 2017), the bilateral trade flows longitudinal cooperation in SCO (Lin et al., 2016), the attempt in the SCO Development Bank (Hooijmaaijers, 2021) and so on. The founders of the SCO, established in 2001, were China, Russia, Kazakhstan, Kyrgyzstan, Tajikistan, and Uzbekistan. Recently, the following new member nations were added: India and Pakistan in 2017 and Iran in 2023. The SCO has significantly contributed to safeguarding the Eurasian continent’s security and stability and promoting regional countries’ prosperity. Since the SCO’s establishment 21 years ago, it has maintained a healthy and stable development under the guidance of the “Shanghai Spirit”—mutual trust, mutual benefit, equality, consultation, respect for different civilisations, and common prosperity. Moreover, the Council of the Heads of State of the Shanghai Cooperation Organisation published the document Statement on Strengthening Cooperation in the Field of Scientific and Technological Innovation to strengthen confidence and amicable neighbourly relations among member countries.
Most SCO member countries have not yet established a powerful system of scientific and technological innovation, are characterised by weak innovation system structures, and often lack internal resources for independent development and innovation. An accurate understanding of the cross-national innovative collaboration of regional communities is important for conducting follow-up research.
Therefore, to shed light on the characteristics of collaborative innovation in the SCO, the present study focuses on the following key research questions:
Question 1: What is the general trend of development of innovation cooperation in the SCO? Question 2: What are the characteristics of collaborative links between institutions of SCO member states in the network? Question 3: What are the factors affecting the SCO collaborative network in different periods?
By addressing these issues, this study seeks to make several contributions. First, the empirical study will enrich our current understanding of the development trend of collaborative innovation in the SCO. Second, this study explores its network structure characteristics at two levels: Topological characteristics and Centralization measures. Third, the analysis of influencing factors reveals that collaborative innovation is not just a single country’s endeavor, but needs to narrow the differences between countries. This study is a practical basis for further promoting the coordinated development of regional innovation and the construction of the SCO regional innovation system.
Literature Review
Regional integration, as a powerful complement to globalization, has become an important bridge between countries (Abudukeremu et al., 2024). It has facilitated the development of the Shanghai Cooperation Organization in areas other than security, such as culture, economy and education. Broader and deeper regional economic cooperation has promoted integration among SCO member States (Alimov, 2018; Shahzad et al., 2024).
With respect to theory literature, Our theoretical focus is on the overlooked characteristics of the development of collaborative innovation cooperation in SCO countries and how collaborative networks affect cross-regional cooperation in SCO countries. Existing literature suggests that collaborative innovation is an important form of organizing and realizing innovation (Dai et al., 2024). In the context of international organizations and trans-regional networks, trans-regional cooperation is seen as a tool for promoting regional knowledge creation (Hazir et al., 2018) and growth, with an increasing impact on innovation as regional diversity increases (Innocenti et al,. 2019). Collaborative innovation is an important pathway to innovation (Liu et al., 2019), and multi-agency collaborative innovation is necessary. Roles such as orchestrators, communicators, and brokerage roles (Mignoni et al., 2021) can help expand collaborative networks (Kim et al., 2024). Collaborative innovation networks will bring new opportunities for the development and cooperation of international organizations.
In the current empirical literature on organisational collaboration in science, technology, and innovation, researchers tend to explore the Organization for Economic Co-operation and Development (OECD), the European Union, and other organisations, but limited attention has been paid to SCO in collaborative innovation and scientific research. (I) OECD: Archontakis (2017) used data from 28 OECD countries to explain the variation in patent flows from the source country to the target country within the framework of an extended gravity model. The short- and long-term interlinkages between ICT innovation, globalisation, and economic growth among OECD countries have been evaluated (Kurniawati, 2020). (II) The European Union: diverse sources of information and cooperation for innovation used in manufacturing and services in the European Union were compared to explore cooperation for innovation (Carvalho et al., 2018). Berné-Martínez (2021) assessed technological innovation in the European Union by employing a fuzzy comparative qualitative analysis and different causal configurations. (III) Other organisations: Song (2018) analysed the community structure of trade networks of the Belt and Road Initiative and estimated topological relationships. Hassan et al. (2015) analysed the intra-and international collaboration of the Organization of Islamic Cooperation (OIC) in S&T disciplines. He then indicated that OIC states must develop comprehensive plans to improve the status of international research networks and that attention must be paid to international collaboration and the state of the outside world. Bashir (2021) systematically analysed research trends in One Belt and One Road for further research by assessing publication hallmarks.
In recent years, scholars have studied collaborative innovation, particularly the use of networks. Studies on innovative collaboration networks have focused on the collaborative network structure and explored its influencing factors through co-publications or co-patents. De Prato and Nepelski (2012) studied the structure and evolution of a global technological collaboration network and demonstrated that the position of a country in the network significantly affects the intensity of cooperation with other countries. Lee (2016) focused on finding convergence networks within robot technology and identified the variables that affect convergence using QAPs. Sun (2017) investigated actors’ positions in a network and generated a QAP regression model to elucidate the relations between actors in the network using a database of China’s technology transactions. Gui et al. (2018) illustrated the spatial patterns of international knowledge flows and estimated the impact of geographical, technological, social, and cultural proximity on variations in inter-country collaboration in science. Pan et al. (2019) discussed the characteristics, evolutionary trends, and influencing factors of China’s interregional innovation correlation effect. Gui (2019) employed bibliographical data and social network analysis to investigate the structures and determinants of international scientific collaboration networks. Shi et al. (2020) explored the scientific collaboration network of Chinese scientists, its complexity, and its proximity mechanism by combining complex network analysis and regression models. Li et al. (2021) explored the structural characteristics and determinants of global green technological collaboration networks using social network analysis and QAP.
Consequently, the current paper seeks to make the following contributions to the existing literature. First, current studies have focused on the EU, APEC, and other highly representative regional international organizations or on the analysis of cooperation networks in specific industries. The current literature has not yet discussed collaborative innovations among SCO countries. Second, most of these studies have focused on network embeddedness, with countries and cities as nodes. However, the ties connecting institutions may differ in terms of their composition and structure. Closer attention to institutions in social networks may provide additional insights (Opper, 2023).
Exploring collaboration in science, technology, and innovation in SCO in depth is of immense value. The output of scientific co-publications reflects the level of research and scale of the country’s innovative development. This study focuses on SCO scientific collaborative network characteristics using the institution as a node and the Web of Science core collection co-publication information based on social network analysis. Furthermore, we investigate the factors influencing innovative collaboration in SCO countries using QAP.
Data and Methodology
Data Collection and Analysis Procedures
To build a network of SCO among nine member countries, we used co-publication data contained in the Web of Science (WOS) database from 2001 to 2022. The retrieval utilized “(CU = Russia AND CU = China) and Article (Document Types) Timespan: 2001-01-01 to 2022-12-31 (Publication Date).” We selected the past 22 years as the observation period from the establishment to the present. In this manner, we retrieved the nine member states—China, Russia, Kazakhstan, Kyrgyzstan, Tajikistan, Uzbekistan, India, Pakistan, and Iran—in pairs, namely “(CU = Kazakhstan AND CU=Kyrgyzstan) and Article (Document Types) Timespan: 2001-01-01 to 2022-12-31 (Publication Date)” etc. Factors included the year of publication and research area.
After that, network of relationships matrices were generated. The relationships between the literature were represented as matrices, and each element of the matrix could represent the connection between the literature. Finally, the matrices were imported into UCINET and other software, after which the network structure analysis was carried out to analyze the structure of the literature network, including the centrality index, cluster structure, path length, etc., using the method of SNA, to reveal the relationship and structural characteristics between different member countries.
Methodology
Section “Measurement Result Analysis and Discussion’s research framework is presented in Figure 1. Further, we explored the characteristics of the collaborative network of institutions and the influencing factors by constructing a collaborative network of SCO based on network analysis and a statistical model of the QAP.

Analysis procedures of network structure characteristics.
Social Network Analysis
Social network analysis is an interdisciplinary approach that is beneficial for integrating the relationships among actors and analysing the structures of the resulting network (Sun et al., 2020)—in theories, tools, and processes for the disciplines of computer science, engineering, and business economics. It is a tool for studying interpersonal relationships, organizational structures, and information dissemination that can help researchers gain a deeper understanding of relational patterns and structures in data. In this research paper, the use of SNA for data collection can help to reveal the connections among the literature. Social network analysis was conducted to explore the weighted networks topology and descriptive statistics of transnational SCO research. In this study, we used VOSviewer software to construct networks among collaborative institutions and UCINET and Gephi software to construct networks among SCO members. Table 1 presents the formulae and descriptions of the indicators.
Explanation of Main Indicators for characteristics of SCO Collaborative Network.

Statistical Model
Notably, QAP is a statistical test commonly used in social network analysis and network agenda-setting studies to calculate the Pearson correlation coefficient between two matrices (Vu et al., 2014). It has the advantages of addressing multicollinearity and structural autocorrelation and increasing standard errors’ reliability; QAP is a regression between a dependent matrix and explanatory matrices using a nonparametric random permutation test. Additionally, QAP has two steps that require the rows and columns of the dependent variable matrix to be permutated and the regression to be recalculated multiple times to estimate the standard error.
This study used the QAP model to perform a regression analysis of the SCO scientific collaboration network and its determinants. Based on the SCO scientific collaboration networks for 2001, 2008, 2015, and 2022, the correlation matrix was randomly permutated 5,000 times and, subsequently, regressed.
Measurement Result Analysis and Discussion
Overall Descriptive Statistics
This section presents the results of the overall statistical data, specifically focusing on transnational collaboration between countries to which the institutions belong. The colour of the heat maps visualises the extent of cross-national collaboration, and the depth of the colour is proportional to the degree of cooperation. Therefore, the graph indicates that co-publications between SCOs from 2001 to 2022 seem to be leading in China, Russia, Pakistan, Iran, and India, which cooperate with other nations with more than 10,000 co-publications.
China cooperates with Pakistan, India, Russia, and Iran, amounting to more than 10,000, and holds a small share with Kazakhstan, Uzbekistan, Kyrgyzstan, and Tajikistan. India has collaborated the most on research publications with China (28,731), followed by Russia, and there is enormous potential for collaboration with Pakistan (7,340) and Iran (6,848). Russia holds the largest share of scientific research with China (26,277), followed by India at 11,922, with Kazakhstan having up to 5,037 co-publications. However, Tajikistan and Kyrgyzstan cooperate with other nations and do not exceed 1,000 co-publications. The number of publications in Uzbekistan does not exceed 700 co-publications, except for those with China and Russia. Furthermore, based on the number of overall co-publications in Figure 2, Iran and Pakistan have an immense potential to attract and expand regional and cross-regional collaborations.

Overall statistic data of co-publications in SCO.
Collaboration Trends
Publication Year
In this section, we analyse trends in transnational collaboration from the perspective of the publication year. The different colours of the nodes represent the different collaborative partnerships of SCO member states. The annual trends presented in Figure 3 indicate that the number of co-publications per year increased slightly in China, India, Iran, Kazakhstan, Pakistan, and Russia from 2001 to 2015 and grew in the most recent period, especially after 2015. The document published in 2013—Statement by the Council of Heads of State of the Shanghai Cooperation Organization on strengthening cooperation in the field of science, technology, and innovation—significantly contributed to global economic growth and sustainable development. The declaration deepened the SCO’s scientific and technological cooperation, which significantly increased cooperation outcomes after 2015. However, the cooperative amount was reduced in 2020, with the outbreak of COVID-19 decelerating transnational development. Moreover, we observed evident fluctuations and variabilities, especially in collaboration with Kyrgyzstan, Tajikistan, and Uzbekistan.

Number of collaborative co-publications in SCO based on publication year.
Research Area
To better capture the characteristics of collaboration trends, we selected partner-nation combinations wherein the cooperative number is the maximum and considered the top 25 research areas of co-publications. We divided these areas into three categories by the share of the total collaboration in Figure 4, wherein different colours represent different shares: faint yellow represents over 10% of the total number, orange represents between 5% and 10%, and, analogously, dark orange represents under 5%.

Research area of co-publications in SCO.
This regard was the same as Hamdan and Alsuqaih (2024), who found the collaboration patterns were regional. The following Figure 4 indicates that China and Pakistan have reached a significant share of collaboration, whereas China has the largest share in physics, engineering, environmental science, ecology, and chemistry. Similarly, these were also the main collaboration areas between India and China; astronomy, astrophysics, and materials science were in the second echelon. However, astronomy, astrophysics, and materials science were the first echelons in Russia and China. However, the share between 5% and 10% was only in two fields, namely, engineering and S&T. China and Russia—as the world’s largest developing country and one of the largest developed countries, respectively—have strong economic power and immense potential for collaboration, and significantly contribute to the SCO. Strengthening collaboration between the two sides and forming a mutually beneficial model of cooperation and development can help inject new dynamism into SCO innovation, strengthen ties within Central Asia, and form a closer structure of collaboration. Additionally, materials science provides a new impetus, with a share of over 10% for collaboration between Iran and China; mathematics, energy fuels, and computer science have been in an active position in collaboration across regions. Interestingly, Kazakhstan, Tajikistan, and Uzbekistan primarily cooperated with Russia, while the strengths in these disciplines were still in physics and chemistry. Kyrgyzstan has different cooperation fields, with geology and geochemistry and geophysics holding the largest share, followed by general internal medicine.
Limited attention has been paid to social sciences, such as sociology, economics, political science, and psychology, whereas most collaborative research is spread across natural sciences and technology publications, such as physical, chemical, energy, and engineering. Why is collaboration focused in these areas? According to the statements issued by the SCO, its initial focus was on international information security, regional situations, and border cooperation. Physics, chemistry, energy, engineering, and computational disciplines are more intuitive and practical and are research areas that promote advanced fields and innovation in technological facilities.
Network Analysis
Descriptive Statistics of the Collaboration Network
Based on WOS co-publication data, we used social network analysis to construct the collaborative institutions’ network using Gephi and UCINET software. Additionally, indicators at the network level explain the topological characteristics of transnational research within an SCO. Network characteristics specifically focus on the entire collaborative network structure to identify its weighted networks characteristics from the perspectives of network nodes, average degree, graph density.
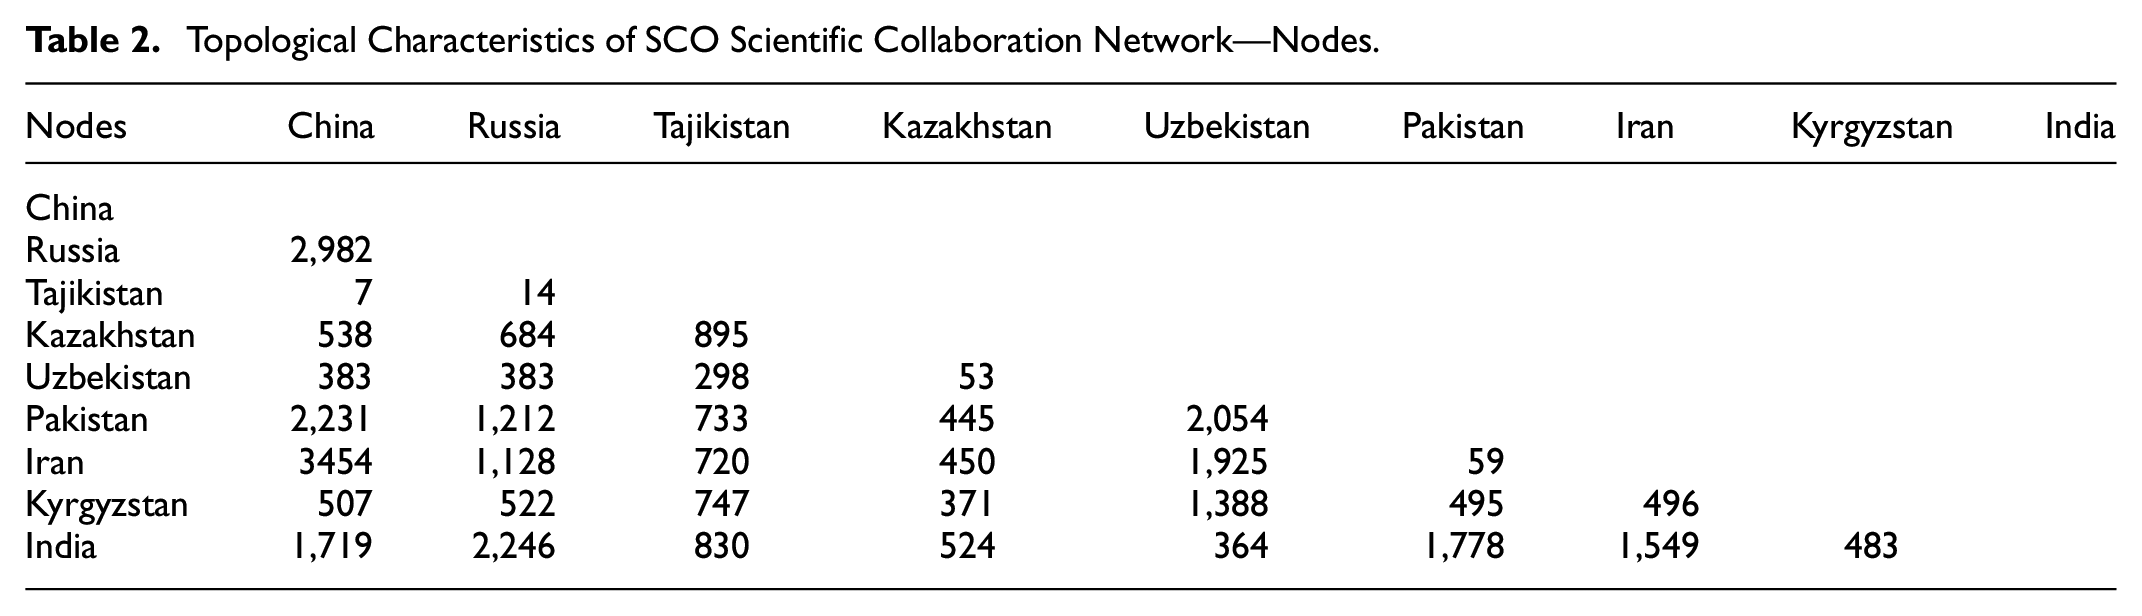
The nature of the network refers to the analysis of the characteristics of the node groups in the network—a quantitative analysis of group organisation (Pu et al., 2022). As presented in Table 2, the numbers of nodes involved in this network significantly differ. For instance, the number of nodes of the cooperative institutions between China and Iran is 3454, suggesting that the participating institutions are the most active among the SCO countries. The number of nodes between China and Russia is 2,982, and that between Russia and India is 2,246; the other pairs also have a high number of nodes for institutions. However, the institutions in Tajikistan with China are only 7 and with Russia are only 14.
Topological Characteristics of SCO Scientific Collaboration Network—Nodes.
The average degree represents the average scale of cooperation of a node. Table 3 reveals that the average degree of the network changes with varying degrees. The average number of collaborations between each institution and other institutions in the core network ranges from 5.429 to 849.081.
Topological Characteristics of SCO Scientific Collaboration Network—Average Degree.

Graph density is the ratio between the actual number of edges in the network to the maximum number of edges based on the given number of nodes (Lacasa & Shubbak, 2018). The network density (Table 4) of the scientific collaborative network of SCO exhibits a trend of polarisation. Noteworthily, the institutional collaboration between countries is excessively widespread and ungathering, and even when overall collaboration is numerous, it results in a relatively low graph density. The number of nodes between China and Russia is 2,982, but the graph density is only 0.281. Conversely, the number of nodes between Pakistan and Kyrgyzstan is merely 495, but the graph density is 0.960.
Topological Characteristics of SCO Scientific Collaboration Network—Graph Density.

Centralisation Measures
To better reflect transnational collaborative relationships, this section explores the centralisation characteristics of the social network using UCINET to describe the centrality of the entire graph (i.e., centralisation) by taking the nine inter-country collaborative institutions as nodes and the interinstitutional research relationships as edges. Figure 5 presents the results of the centralisation metrics.

Centralisation characteristics of SCO scientific collaboration network.
Centrality characterises the positions of individual nodes in a network and is used to measure the extent to which an entire network is centralised. Degree centralisation is an indicator of the overall centrality of a network. The degree centralisation value between a minority of countries fluctuates at 20%, and that of the majority of inter-country is approximately 10%. The number of cooperative nodes between China and Tajikistan is the smallest, resulting in the largest degree of centralisation (30%). The same is observed for cooperation between Russia and Tajikistan (26%). However, the number of nodes is small, and the degree of centralisation of collaboration between Kazakhstan and Uzbekistan (8%) and Pakistan and Iran (8%) is low. These results clearly indicate that the cooperation between these countries is low, irrespective of the number of cooperating institutions involved. Interestingly, the degree of centrality heterogeneity in these member states exhibits a similar trend. Except for these countries, the other values remain below 5% or even 0%.
Some crucial differences appear in closeness centralisation. Higher closeness centralisation indicates greater variability of nodes in the network and vice versa. In particular, the closeness centralisation between Kazakhstan and all countries except Tajikistan is low, while the values of Kyrgyzstan and all countries except Tajikistan and Uzbekistan are also low. The closeness centralisation for collaboration across SCO countries varies from 2% to 65%, indicating that collaborative linkages of institutions between the nodes of SCO member states exist in large differences in the network. By contrast, the values of betweenness centralisation in these networks are relatively small, which hints that a tiny fraction of certain countries or institutions do not highly centralise the SCO collaborative network. Notably, Tajikistan is limited by its development and has higher values of closeness centralisation and betweenness centralisation than other countries, where the gap between Tajikistan and other member states is large.
Network Structure of Collaborative Institutions
The network of institutions that cooperate in SCO research is becoming increasingly complex as collaboration and development continue growing. Based on the above published years and collaboration trends, (a) China, (g) Russia, and (b) India, where collaborations were stable and frequent, were compared with (e) Kyrgyzstan, (h) Tajikistan, and (i) Uzbekistan, where cooperation fluctuated markedly. To better analyse the characteristics of collaborative innovation institutions in transnational networks, we apply network analysis using VOSviewer software to construct linked networks. Considering the focus on specific core data, the Social Science Citation Index and Science Citation Index Expanded were selected to analyse co-institutions. The unit of analysis was the organisation. The sizes of the nodes in Figure 6 indicate the document’s frequency of occurrence, and the coloured shades indicate trends over the years.

Collaborative institutions network of China.
China
As presented in Figure 6, the network is centred on research institutions and branches, including the Indian Institute of Technology, Islamia University Bahawalpur, Bahauddin Zakariya University, and the University of Tehran. In terms of year progression, before 2019, there was a wide range of collaborations, with the main ones being with the English Academy of Science, the Russian Academy of Sciences, Zhejiang University, the University of Chinese Academy of Science, and the Chinese University of Hong Kong. With the rapid development of research, collaboration among research institutions has proliferated since 2020, and the richness of collaboration has increased significantly.
Russia
Figure 7 reveals that, in terms of collaborative nodes, cooperation was concentrated in Russian Academy Sciences, Chinese Academy Sciences, Moscow Mv Lomonosov State University, Ural Federal University, South Ural State University, and St. Petersburg State University. The figure clearly indicates that the Russian Academy of Sciences holds prominent leadership positions. In terms of year progression, around 2014, numerous institutions collaborated, albeit less. From 2014 to 2018, considerable collaboration with the outside world occurred in Russia. Collaboration was concentrated in Russian Academy Sciences. By 2020, partnerships grew richer, including Al-Mustaqbal University College, Plekhanov Russian University Economics, Al-Maarif University College, Fed Res Ctr Ksc Sb Ras, and Tabriz University Medical Science.

Collaborative institutions network of Russia.
India
As presented in Figure 8, in terms of cooperation nodes, India’s closer cooperation was centred on Chinese Academy Sciences, English Academy Sciences, Indian Institute of Technology, Russian Academy Sciences, King Saud University, Islamic Azad University, Chinese University Hong Kong, Peking University, University of Hong Kong, King Abdulaziz University, Zhejiang University, and Shanghai Jiao Tong University. In terms of yearly progression, India’s cooperation commenced late and developed gradually from 2016 to 2019. This stage had several branches of cooperation, but their volume was minimal. By 2020, some new cooperation institutions had emerged, but the number of partnerships formed in this phase was still less than those in China and Russia. The new collaborating agencies included Tabriz University Medical Science, Al-Mustaqbal University College, Davangere University, University Medical & Pharmacy Craiova, Al-Nisour University College, Glasgow University, and Tanker Fdn.

Collaborative institutions network of India.
Kyrgyzstan
Figure 9 indicates the co-institutional network of national cooperators in Kyrgyzstan. In terms of collaborative nodes, the Russian Academy of Sciences, Chinese Academy of Sciences, National Academy Science Kyrgyz Republic, and Al-Farabi Kazakh National University all exhibited a co-institution network. In terms of year progression, the Russian Academy of Science demonstrated strong collaboration around 2012, with the collaboration of other nodes still in their infancy. During 2014 to 2018, the number of nodes increased, and network connectivity expanded. With the rapid development of research after 2020, the number of edges and nodes of networks, such as the Chinese Academy of Sciences, Al-Farabi Kazakh National University, and the University of Central Asia, rose rapidly.

Collaborative institutions network of Kyrgyzstan.
Tajikistan
Figure 2 indicates that Tajikistan cooperates the most with Russia and Pakistan. In Figure 10, in terms of cooperative nodes, the institutions presented in the clusters tend to be centred on Russian Academy Sciences, Chinese Academy of Sciences, Academy Science Republic Tajikistan, Avicenna Tajik State Medical University, and GIK Inst Engn Sci & Technol. In terms of year progression, the breadth of collaboration was minimal before 2016. After 2018, branches began to gradually emerge. Figure 10 indicates that the countries’ SCO collaboration networks are sparse, with few nodes and edges. The above analysis indicates that the collaboration in Tajikistan involved a small range of research institutions and developed slowly.

Collaborative institutions network of Tajikistan.
Uzbekistan
As observed from the overall statistical analysis of view in Figure 2, Uzbekistan’s innovation is more collaborative with China and Russia than with the other countries. In terms of collaborative nodes, Figure 11 indicates that a gap exists in the size of the cooperative nodes in Uzbekistan. In terms of year progression, before 2016, collaboration was focused on Uzbek Acad Sci, Russian Academy Science, English Academy Science, and Joint Inst Nucl Res. Some institutions cooperated less than others. However, after 2020, numerous institutions began cooperating, including Akfa University, Tashkent State University, Tashkent State Tech University, Al-Mustaqbal University College, Imam Jaafar Al-Sadiq University, and Shanghai Astronomical. In brief, there were large gaps at the nodes; hence, integrating vigorous resources and technologies across regions and enabling diversified development in scientific and technological innovation to reduce disparity is essential.

Collaborative institutions network of Uzbekistan.
In summary, in terms of the network and evolution of scientific cooperation among innovation institutions in the SCO, first, countries with frequent and stable cooperation generated greater cooperation in the initial years, whereas countries with significant fluctuations in cooperation have seen more cooperation only in recent years. Second, multiple subnetworks exist in each network that occupy its core. Third, China and Russia exhibited greater involvement in the breadth and depth of cooperation than other countries, forming multiple core nodes.
QAP analysis
Variables
In this section, we examine the determinants of scientific collaboration among the SCO countries. The dependent variable is the number of co-publications between countries i and j. Considering the above literature review, the independent variables include Geographical Distance, Language, Economic proximity, Social Proximity, Economic Size Difference, Academic Size Difference, and University Size Difference. Table 5 summarises the dependent and independent variables used in the statistical models.
Variable descriptions and data sources.

QAP Analysis
To explore the determinants of scientific collaboration among SCO countries, we selected the four time nodes of 2001, 2008, 2015, and 2022 for empirical analysis. To test the correlation between dependent and independent variables, we determined the correlation coefficient between the scientific collaboration network matrix and each independent variable matrix. Using UCINET, we selected 5000 random permutations to ensure the accuracy of the model calculation for the QAP matrix correlation analysis.
To test the correlation between dependent and independent variables, first, we determined the correlation coefficient between the SCO scientific collaboration network matrix and each independent variable matrix. Table 6 indicates that social proximity was positive at the 1% significance level in 2001. In 2008, collaborative scientific publications exhibited a significant negative correlation with geographical distance at the 1% significance level, a significant positive correlation with academic size differences at the 5% significance level, and a significant positive correlation with social proximity at the 1% significance level. In 2015, collaborative scientific publications exhibited a significant negative correlation with geographical distance and a significant positive correlation with academic size difference. The results for 2022 indicated that scientific cooperation publications in SCO were significantly correlated with geographical distance, economic size difference(ln), academic size difference, university size difference, and social proximity. The level of economic proximity was not significantly correlated with cooperation, indicating that the similarity of economic levels does not affect cooperation in the SCO region during the evolution of cooperative innovation networks. Thus, these factors may have overlapping effects on SCO innovation correlations. The problem of multicollinearity must be addressed using a QAP regression analysis (Pan et al., 2019).
Results of QAP Correlation Analysis.

p < .1. **p < .05. ***p < .01.
As the collaborative innovation network in the SCO region evolves, the network structure changes accordingly, making the significance of the impact of each dimension on the innovation network change correspondingly at different times. Table 7 reports the results of the QAP regression. The goodness of model fit is between 0.152 and 0.981, indicating that the variables adequately explain SCO inter-country scientific collaboration.
Results of QAP regression analysis.

p < .1. **p < .05. ***p < .01.
The geographical distance was not significant in 2001, 2008, or 2015 and is not a key factor influencing scientific cooperation in the SCO. The impact of—and barriers to—physical distance is reduced with the development of ICT (Li et al., 2021). Furthermore, scientific cooperation involves the codification of knowledge that can be transmitted over long distances (Heimeriks et al., 2008). However, the regression coefficient for 2022 is negative at the 1% significance level. COVID-19 hindered the development of offline research activities, lowering the amount of cooperation in 2022 with respect to greater geographic distance.
The coefficient of language similarity is not significant in 2001, 2008, and 2015 and exhibits a weakly significant negative correlation in 2022. The influence of language on cooperation in scientific research papers gradually diminishes to a negative value, indicating that language is no longer a key factor influencing scientific research cooperation among SCO countries. This also indicates that the countries have increased the frequency of mutual exchanges, and the degree of cooperation is closer to the side. This difference in language facilitated cooperation among SCO countries to a certain extent.
Economic proximity exhibited a weak negative effect, indicating that research collaboration was more likely to occur among countries with larger economic differences. No significant effect was recorded based on the Economic Size Difference (ln), which indicates that scientific cooperation at the SCO inter-national cooperative level is not limited by the economic size difference (GDP per capita). Acosta (2010) argued that no significant relationship exists between GDP differences and research collaboration and that the higher the economic proximity, the lower the intensity of research collaboration, which is consistent with this study’s results.
The coefficients of academic size difference in 2008, 2015, and 2022 exert a significant positive effect, indicating that the size of the institution plays a key role and that if the academic gap between the two countries widens, more collaborations can be generated. A smaller gap results in insufficient knowledge complementarity between collaborating institutions to stimulate innovation. Smaller scientific research countries need greater knowledge exchange and cooperation with countries having abundant resources, and countries with strong scientific research strength should lead countries with weak scientific research strength, gradually narrowing the gap between countries, providing the usual channels for knowledge flow, and promoting coordinated development of the SCO region. Further, university size difference exerted a significant negative impact in 2008; the larger the difference, the more difficult it is to communicate effectively and fully understand collaborating entities, increasing the cost of scientific research collaboration, and reducing the cooperation. In summary, the similarity in the number of QS top 500 universities facilitates the generation of scientific cooperation networks among SCO countries, whereas the difference in academic size facilitates the establishment of research cooperation links between countries.
Social proximity exerts a significant positive effect on the evolution of innovation networks, with regression coefficients ranging from 0.933 to 0.983 for 2001, 2008, and 2022. Increasing social proximity among SCO countries reduces the uncertainty and risk of cooperation, which helps increase the likelihood of research cooperation and improves research output. Additionally, Miörner (2017) argued that social proximity creates conditions for weaker countries to fully absorb knowledge spillovers from stronger countries, which is a key driver of knowledge flows.
Discussion and Conclusion
Discussion
This study constructed an innovation cooperation network and conducted QAP analysis of its influencing factors to reveal the development trend of scientific research and innovation cooperation among SCO member states and to explore the influencing factors at different stages of the evolution of the innovation network. This study answered the key research questions posed in the Introduction section.
Firstly, scientific and technological cooperation varies among SCO countries and is characterised by unevenness in the regions and areas of cooperation. The overall cooperative volume in China, Russia, India, and Iran accounts for the majority and leads the rest of the country. Notably, the volume of cooperation increased significantly after 2015. Slight fluctuations were observed until 2020. The changes in Kyrgyzstan, Tajikistan, and Uzbekistan fluctuated over the survey period. Additionally, the research areas of cooperation exhibit an imbalance, with the natural sciences being the dominant direction of research in SCO countries, slightly outperforming other disciplines. Our evidence not only supported the study of Joy (2024) regarding SCO’s countries a growing interest in environmental sciences, green and sustainable science and technology, and interdisciplinary mathematics applications, but also suggested that physics, engineering, environmental science, ecology, and chemistry were the primary areas of cooperation.
Then, the social network research analysis clearly indicates that the degree, closeness, and betweenness centralisation of different SCO member states significantly differ. The core cooperative countries with average degrees in the cooperation network were clustered in China and Russia, forming an agglomeration effect. Additionally, the technology nodes with higher control power in the innovation network are primarily distributed in China, Russia, India, and Pakistan, whereas the technology nodes distributed in Tajikistan, Kazakhstan, Kyrgyzstan, Uzbekistan, and Iran are at the edge of the network. The network indicators present signs of small-world SCO cooperation characteristics with a fast information transfer efficiency. Although the overall network is highly clustered among an excessively small number of countries, it is also becoming progressively decentralised. The SCO’s overall innovative capability must be strengthened.
Furthermore, QAP multiple regression analysis was used to introduce the influencing factors to explain the formation of the scientific innovation collaboration network in SCO. The formation of cooperative network is the result of multiple factors (Abudukeremu et al., 2024). In this regard, our conclusions were the same as Gui et al. (2018), who found the social proximity was the driving force for technological innovation in scientific collaborations, and the impact of cultural proximity had decreased. In addition, we found that academic size differences was also one of the factors driving the development, followed by geographical distance, economic proximity, language similarity, and university size difference, whereas the development of economic size differences did not significantly impact the level of technological progress in the SCO.
SCO began with security cooperation and gradually expanded into the economic and human fields, exhibiting a flourishing scene of all-around development. As SCO countries become increasingly interconnected and interdependent, technological innovation has provided a new impetus for the development of SCO. The member countries could grasp the trend of the times and response to the common desire of the developing countries to seek cooperation and development. For example, considering the imbalance in the development of innovation networks among countries, channels for the transformation of S&T achievements could be increased, including the transnational integration of industry, academia, and research, transnational technology transfer centres, documentation, and scientific data sharing centres. It is a practical basis for further promoting the coordinated development of regional innovation and the construction of the SCO regional innovation system. This study makes a significant contribution to exploration of the field of cooperation in the SCO.
Conclusion
This study investigated innovation cooperation in the Shanghai Cooperation Organization (SCO) using the contents of the Web of Science (WOS) database. We conducted social network analysis using different network indicators and visualized and summarized development trends. The factors influencing the SCO cooperation networks observed in different periods were also investigated according to the Quadratic Assignment Procedure (QAP). The examples discussed confirm the value of this approach and demonstrate the promising future research. In past studies, we have learned more about many industries and regional collaborative innovation development. The Shanghai Cooperation Organization (SCO) is the most important part of the Eurasian region and has become a comprehensive regional cooperation organization covering the largest area and the largest population in the world today. In order to better understand the state of collaborative innovation development in the SCO region, the insights brought by such an institute will not only enriched the SCO regional research, but also generated a dialogue between the theory of collaborative innovation and more regions.
Although this study has significant theoretical and practical implications, its shortcomings should be addressed in future studies. First, this study only examined SCO cooperation from the perspective of the WOS paper database, which may not include all relevant economic research publications. Further research can evaluate other databases, such as Scopus and Google Scholar, and compare their findings with this study’s results. Moreover, future research can use patent or project (De Iudicibus et al., 2024; Innocenti et al,. 2019) collaboration data to establish collaborative networks, and comparative research on these networks may provide interesting results. Additionally, this study focused on the trends in cooperation between SCO countries in scientific research papers. Further research could be conducted from specific industries, such as R&D service sector (Turkina et al., 2024), strategic emerging industries (Shi & Xiao, 2024) among member countries, such as agriculture, economic trade, green energy, ecological protection, and so on.
Footnotes
Acknowledgements
None.
Ethical considerations
None.
Consent details (please only include information on consent;do not include consent forms)
All authors approved the final manuscript and the submission to this journal.
Author Contributions
Funding
The author(s) disclosed receipt of the following financial support for the research, authorship, and/or publication of this article: This work was supported by Qilu University of Technology (Shandong Academy of Sciences), [project no. 2022-122]
Declaration of Conflicting Interests
The author(s) declared no potential conflicts of interest with respect to the research, authorship, and/or publication of this article.
Data Availability Statement
The data that support the findings of this study are available in Web of Science.