
Abstract
The cumulative characteristic of science has led to the practice of citation in scientific works. However, citations serve a dual purpose, not only as a means to acknowledge cumulative knowledge but also as a mechanism to substantiate empirical claims within scientific discourse. Over time, whom and what is cited among the increasing number of scientific literature has started to gain importance. In this study, the hypothesis that authors who publish in qualified journals, cite works in qualified journals, which this phenomenon has been defined as “academic elegance,” was analyzed. To answer this question, the works in 164 Librarianship and Information Science journals indexed in WoS and the references of these studies were analyzed. Within the scope of the study, 8,416,138 references in a total of 240,069 works were analyzed in the data set divided into three periods (1945–1972, 1973–1997, and 1998–2022). The chord diagrams show the sources cited by the works in the journals in each quartile according to the journal quartiles (Q1–Q4) in the JCR. According to the findings, in the period 1998 to 2022, the rate of citing studies published in journals indexed in WoS is close to half (45%, higher than in other periods). Also, when the chord diagrams of each period are analyzed, it can be roughly said that the potential citation performance (quartile value) of the journal in which the cited work is included largely matches the potential citation performance of the journals in whose bibliography the studies are included.
Introduction
The overall number of citations received by scientific studies is used at the individual level for hiring, promotion, title, grants, and awards, and as a direct or supporting measure to assess the research performance of larger units such as the academic departments, research institutes or even the countries (Safer & Tang, 2009; Slyder et al., 2011). Citations plays an important role in understanding the connection between scientific studies that are related to each other in terms of theory, methodology or results (Di Marco et al., 2006). Although citations are generally considered as positive, they are not only used to support, but also to criticize the studies (CiTO, 2018). However, there is still a strong possible correlation between the cited studies.
Citation now serves more than plagiarism prevention or due diligence. (Ennser-Kananen, 2019, p. 66). The question of how citation practices have evolved over time and how they inform our academic behavior and identities requires a broader perspective and awareness. Why do some authors receive more citations and others less? For example, there are studies showing that citations are influenced by social networks and close relationships; authors primarily cite the works of other authors they know personally (Cronin, 2005; Mahlck & Persson, 2000; Milard, 2014; Sandstrom et al., 2005; Tang & Safer, 2008; Thornley et al., 2015; White, 2001). On the other hand, it is also a fact that people and studies that we consider as “founders,”“prominent people” or “big names” receive more citations (Matthew effect). In recent years, the dominance of quantitative criteria (such as publication and citation counts) in scientific evaluation and the use of these factors to rank science have had significant effects on all players in the scientific ecosystem. The use of citation indexes—originally not designed for research assessment (Garfield, 1955)—to evaluate academics, institutions, and countries has led to the description of scientific success with quantification values. On the other hand, while open access publishing has provided certain advantages, it has also opened the door to predatory publishing, which has become a major concern for academics and researchers when publishing their work. All these factors have significant implications for researchers’ and authors’ citation patterns. At this point, it is increasingly important for academics to be more cautious when citing sources in their scientific research, ensuring whether the cited source is a study that has been retracted or published in a predatory journal. This is crucial to prevent publications that have not undergone the necessary peer review process from continuing to circulate in the scientific literature. In this regard, it has been observed that authors publishing in high-quality, leading journals tend to cite works from similarly reputable journals. This phenomenon is conceptualized in this study as “academic elegance.”
The concept of “academic elegance” might initially be confused with the “Matthew effect”; however, in scientific communication, the Matthew effect is formulated as the tendency for well-known or esteemed scientists to receive more citations than lesser-known researchers, even when their work is similar in quality (Merton, 1968; Smucker, 2008). In the concept of “academic elegance,” the emphasis is not on leading scholars or highly cited individuals but rather on the tendency to cite publications in high-quality, reputable journals.
There may be many other factors that impact the authors’ citation practices in addition to basic factors such as the indexing status of the journal, language of publication, and accessibility.
Although there are many studies on the factors affecting citation practices, there are currently no studies that focus on the question of whether citation behaviors have been influenced since the adoption of citation indices, impact values, and other calculations as evaluation criteria. The questioning of the source of citations, which is addressed as Popularity and Prestige in the literature, should also be questioned for the practice of citation. Citation not only shows the impact of studies on the field with numbers in the scientific literature and communication process, but also has the power to shape the cited author and the study and determine its journey in the scientific literature. The aim of this study is to investigate to what extent the citations made in studies published in journals with high citation value potential are made to qualified sources. The study focuses on the hypothesis called “academic elegance,” which conceptualizes that the citations made in studies published in high impact journals are generally from their own networks, that is, studies published in high impact journals.
Literature Evaluation
Who is cited in scientific studies often shows who is followed in the literature and which sources they are relied upon. In this context, it is always more likely to cite the elders and founders of the profession that have shaped our academic existence, or names or studies that have become cult figures in the field. Furthermore, it is assumed that the more frequently a study is cited, the more frequently that study will be cited in the future. That is, the possible number of future citations is a linear function of the current number which surpasses a certain threshold (Burrell, 2003; Cano & Lind, 1991; Garfield, 1981; Rabow, 2005). The threshold value differs by the fields. Studies that surpass a certain threshold are more likely to be re-cited than others (Tonta & Akbulut, 2021). This is true not only for highly cited publications, but also for highly cited scientists (Garfield, 2002, Merton, 1968, Price, 1976).
A citation to an authoritative journal or study in the field is considered more convincing both by the author of the study and by the reader audiance (Aksnes et al., 2019; Thornley et al., 2015). In other words, the impact factor, quality or prestige of the journal can also impact the frequency of citation (Boyack & Klavans, 2005; Callaham et al., 2002; Cronin, 1984; Meadows, 1998; Tainer, 1991; Thornley et al., 2015; Van Dalen & Henkens, 2005). In addition, the frequency of publication of the journal (Stewart, 1983), the order of publications in the journal (Laband & Piette, 1994; Smart & Waldfogel, 1996), the accessibility, visibility, and internationalization of the journal (Yue & Wilson, 2004; Van Dalen & Henkens, 2005) can influence the citation probability. However, evaluations based solely on quantitative citation counts have been criticized in the literature (Akbulut & Akça, 2017; Zhang et al., 2013). Because, citations are based on different reasons and may have different functions in practice (CiTO, 2018).
One of the earliest studies listing authors’ motivations for citation was conducted by Garfield (1962). In the study, the following was enumerated as the possible reasons for making citation: respecting the pioneers of the field, discussing methodology, providing background reading, validating the cited work or validating one’s own work, and criticizing previous studies (Garfield, 1962, p. 85). Moreover, citation practices may vary from one field to another. For example, in some fields, while researchers cite new literature more frequently than others (Peters & Van Raan, 1994, p. 39), more specific fields may receive far fewer citations than general fields (King, 1987). Again, since some fields have a higher frequency of publications, their citation potential is higher than fields that are monographic and that produce fewer publications. Although these situations are tried to be overcome with normalized calculations depending on the fields, it does not seem possible to make sense of the practice of citation with precise measures. In some cases, authors may not have read the articles they cite (Ramos et al., 2012; Simkin & Roychowdhury, 2003; Wright & Armstrong, 2008), or there may be geographical and linguistic biases that influence the authors’ citation practices (Todd & Ladle, 2008).
Beyond all these debates, it is observed that with the exponential increase in scientific outputs, more citations are being made in studies year by year. Bazerman (1988) found that the number of references increased steadily from about 1.5 per article in the Physical Review in 1910 to over 25 in 1980. However, easier access to information than in the past has led to an increase in studies measuring the citation routine (Cui et al., 2023). Especially with the involvement of the predatory sector, which has occupied the academic community in recent years, the question of who and which work should be cited has become more important. However, with the recent advances in artificial intelligence technology, GenAI tools support researchers with functions such as automatic source finding, article summarization and thematic categorization in literature search processes. Especially young researchers can quickly identify trends and gaps with these tools, but human input is essential for critical evaluation and original synthesis. While AI encourage users to create a wider and more comprehensive citation network, in some cases they can also generate false or fictitious citations. This makes it mandatory to check the accuracy of citations (De Grijs, 2023). At the same time, this situation may lead to important studies being ignored in the citation ecosystem and certain studies receiving much more citations. Issues such as the risk of false citations and the narrowing of the diversity of literature become important in terms of academic ethics. The question of whether those who publish in qualified journals, which are known as academically elegant in the study, cite publications in qualified journals has not been studied in the literature before. Since the studies included in the citation network are more visible and likely to be cited, it seems inevitable to read the literature more carefully and selectively in the midst of a large pile. This study examines the references of studies published in journals indexed in the Web of Science database, which has a relatively more rigorous quality barrier, in the field of Library and Information Science. Considering the journal quartiles (Q1–Q4), the status of the journals included in the references was examined, and the citation status of the publications in high quality journals was also investigated. Accordingly, the research sought to answer the following basic question:
What is the progressive course of the citation patterns of studies published in journals within quartiles calculated according to citation potential in Web of Science?
Method and Creation of Data Set
Within the scope of the study, a detailed dataset was obtained at the citation level by combining article, journal, and citation level data. The data source of the study consists of the studies in 164 journals in the Library Science and Information Science (hereafter LIS) category in the Journal Citation Report (hereafter JCR) and the studies in their references. The dataset was created gradually as a result of retrieving all the information (including metadata and reference data) of the articles in the journals in the LIS category by searching all indexes in the Web of Science database on 21 March, 2022. A four-stage method was used to obtain citation-level data from journal-level data. The stages are explained in detail below.
First Step: Phase 1: Obtaining Journal Level Data in the Library Science and Information Science Category
At this stage, journal-level data for 164 journals in the LIS category were downloaded from the JCR on March 21, 2022. Figure 1 shows a sample representation. Journal Impact Factor (hereafter JIF) from journal level data is based on 2021 JCR, which requires calculation such as journal quartile.

Example presentation of a journal level dataset.
Second Step: Downloading Article-Level Data from WoS
The list of journals downloaded for the field of LIS was searched in Web of Science (hereafter WoS) for each journal and data on all the articles in these journals were downloaded. An example of the created dataset is shown in Figure 2. There are 57 different field tags in the data downloaded from WoS (only 15 are visible in this example). The first column in the figure is the ID manually assigned to each article. This ID is important for linking to later created datasets.
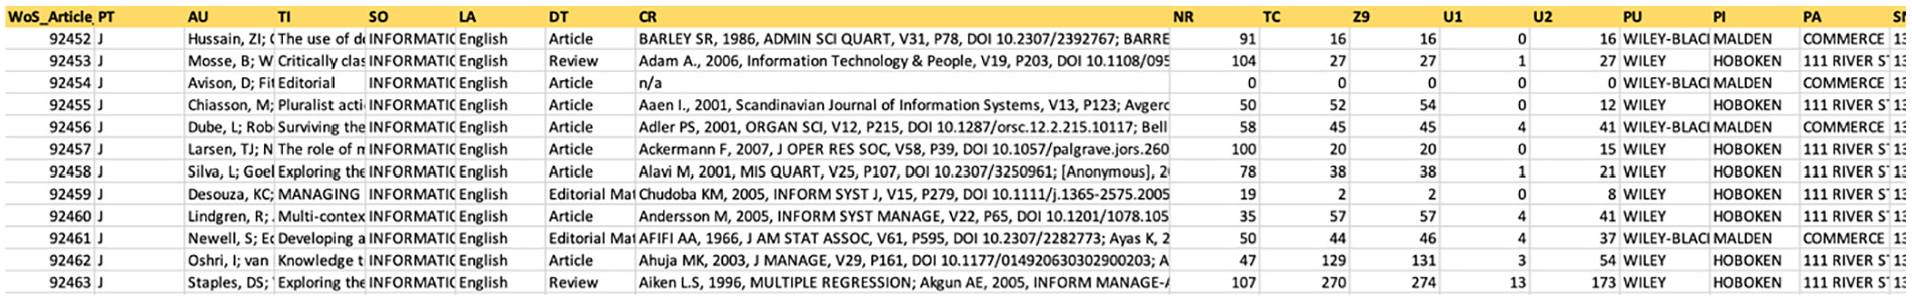
Example presentation of an article level dataset.
Third Step: Obtaining Citation Level Data from Article Level Data
In order to reduce the data to the citation level, the journal names (abbreviated and capitalized journal names) and frequencies in the CR (Cited References) field in the article-level records downloaded from WoS were extracted and made standardized. At this point, it is useful to examine the CR field in detail. Some of the information in the CR field in the article level dataset downloaded from WoS for the review article titled “Critically classifying: UK e-government website benchmarking and the recasting of the citizen as customer,” whose WoS ID is 92453, which appears in second row in Figure 2, is as follows.
Adam A., 2006, Information Technology & People, V19, P203, DOI 10.1108/09593840610689822; Andersen J, 2001, KNOWL ORGAN, V28, P203; [Anonymous], 1989, OXFORD ENGLISH DICT; [Anonymous], 2006, BBC NEWS; Ansell J., 2003, International Transactions in Operational Research, V10, P339, DOI 10.1111/1475-3995.00411; Barnes S., 2000, Proceedings of the 8th European Conference on Information Systems, P298; Barzelay M., 1992, BREAKING BUREAUCRACY; Bellamy C., 1998, GOVERNING INFORM AGE; Benner P., 2000, HEIDEGGER COPING COG, P293; Bevir M, 2003, PUBLIC ADMIN, V81, P1, DOI 10.1111/1467-9299.00334; Beynon-Davies P., 2006, Information Polity, V11, P3; ….
As it is understood, the studies in the field of CR (i.e., the studies included in the reference of the review article numbered 92453) have been standardized. The standard structure is as follows: first author’s first name and initial, year of publication, journal name (abbreviated) if available. Then information such as volume, issue, DOI, if available, is added. Semicolons are used to separate the references. So for the example CR field above, there are 11 references (containing 11). The CR field of each article level data was standardized to create a citation level dataset. The image of the created dataset is shown in Figure 3. Study 1259 (WoS ID 92453) in Information Systems Journal, journal number 60 (11 studies in the references of the review article titled “Critically classifying: UK e-government website benchmarking and the recasting of the citizen as customer”) can be seen in Figure 3. The created dataset was prepared to be related to both journal and article level datasets.

Citation level dataset.
Fourth Step: Adding Journal Level Data to Citation Level Data
In the last stage, standardized journal names were matched with journal level data such as journal quartile value, ISSN, publisher, etc. in JCR 2021. Since citations in journal articles can be made to all fields, at this stage, journal-level data for all fields were downloaded from JCR and matched with the dataset. In this way, WoS records were moved from the article level to the reference level and journal-level data were obtained for related journals. The final dataset contains approximately 240 thousand studies and 8.5 million studies in their references. The dataset also includes data on the journals (for all fields) in which the cited studies are included for articles in journals in the field of LIS. Figure 4 shows the addition of journal level articles to the citation level data. General ID is the unique ID at the primary key level for this dataset. The figure shows the journals in which articles seven through 11 in the references of the 12th ranked article (WoS ID: 132463) and the 13th ranked article (WoS ID: 132464) in the Journal of Documentation (WoS ID: 132463), whose ID is 82, are cited and the journal quartile values of these journals, if any.

Journal-level data added to citation-level data.
In the study, Python and R codes were used to combine the lists, calculations, and chord diagrams.
The selected time periods (1945–1972, 1973–1997, 1998–2022) were chosen to reflect historical changes in citation practices, taking into account the development of bibliometric databases and the increasing role of citation indices in scientific evaluation. Since a single time period cannot capture all possible long-term trends, we meaningfully analyzed citation behavior over specific historical periods. Future studies could expand the scope to include longer time periods or alternative methodologies.
Findings
The citation patterns in the references of the articles in the journals indexed in WoS citation database in the field of LIS, which constitute the dataset of the study, were monitored in the context of the main question of the study. To better track citation patterns over time, the period starting from the earliest date indexed in WoS until the date of data download (March 21, 2022) was divided into three time periods: 1945 to 1972, 1973 to 1997, and 1998 to 2022. Since the impact of citation indexes was felt relatively late in the scientific community, the first period range was wider than the other periods and was set as 27 years. The other two periods were divided into time periods of 24 years each. Accordingly, there are only seven journals currently indexed in WoS between 1945 and 1972, which includes the oldest period. In the other periods, there are 45 and 164 journals, respectively (see Table 1.). Based on the periods, the number of journals in question has increased in parallel with the general increase in the number of scientific journals. In the second part of Table 1, citation level statistics are presented. Within the scope of the study, 8,416,138 references in a total of 240,069 studies were analyzed. As expected, the number of references has increased over time in line with the number of articles published in journals.
Descriptive Statistics of the Dataset.

The types of sources cited were coded as journals with calculated journal quartiles and others. In this context, while 90% of the citations in the references of the articles in the 1945 to 1972 period were to sources (theses, books, etc.) whose quartile was not calculated or not included in WoS, this rate decreased in the other two periods (78% and 55%, respectively). This may be due to the low number of journals in the field or the lack of access to indexed journals in relatively earlier years.
The Journal Impact Factor shows the average number of times articles published in the journal in the last 2 years have been cited in the relevant JCR year. Journal impact factor is calculated by dividing the number of citations in the JCR year by the total number of articles published in the previous 2 years. Journal impact factors for 1972 were calculated according to this formula for seven journals in the period between 1945 and 1972 (see Table 1.). The impact factor for 1972 for each of the journals was calculated by dividing the total number of citations in 1972 to articles published in 1971 and 1970 by the total number of articles published in the same journal in 1971 and 1970.
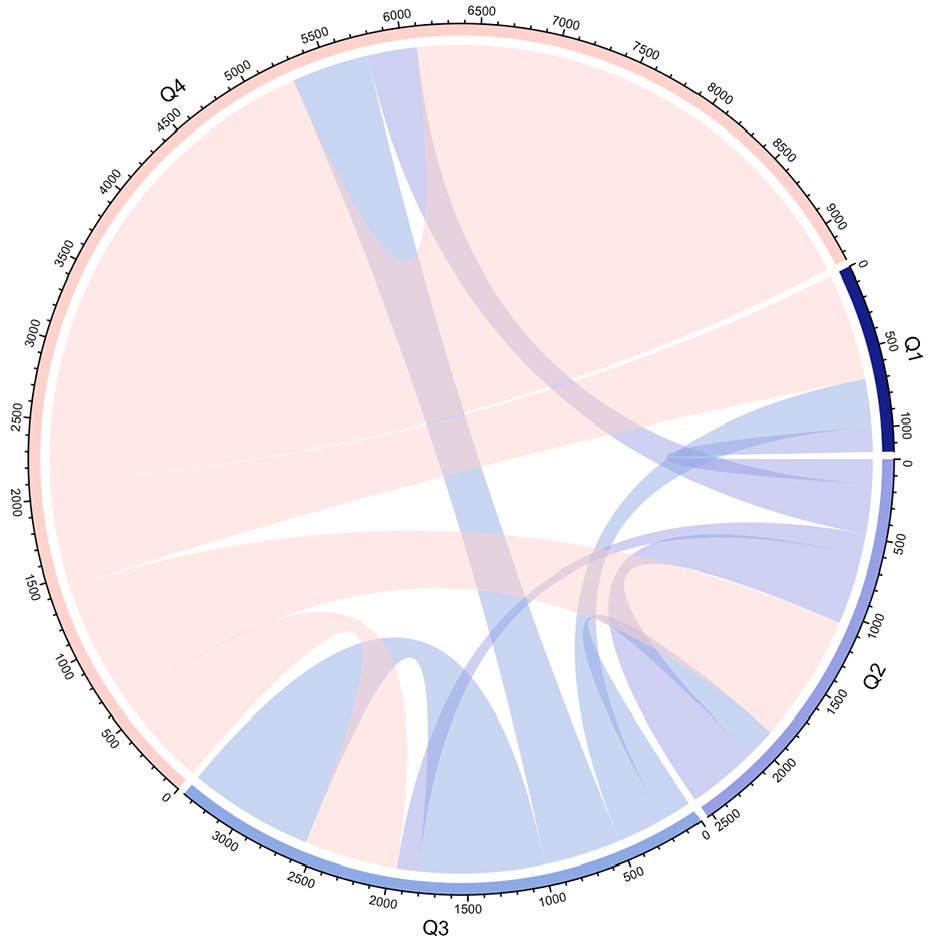
The chord diagrams, which were prepared using approximately 8 and a half million citation relationships, show the citation relationships between journal quartiles in the most general terms. Figure 5 shows the quartile values for the citations made to publications in LIS field that are included in WoS from the studies included in WoS. The chord diagram showing the journal quartile status for citations to publications that are not included in WoS or citations to journals that are included in WoS but for which journal quartiles are not calculated is presented in Figure 6. The journal quartile values represent the quartile values listed in the JCR (Q1 is the highest quartile, Q4 is the lowest quartile).
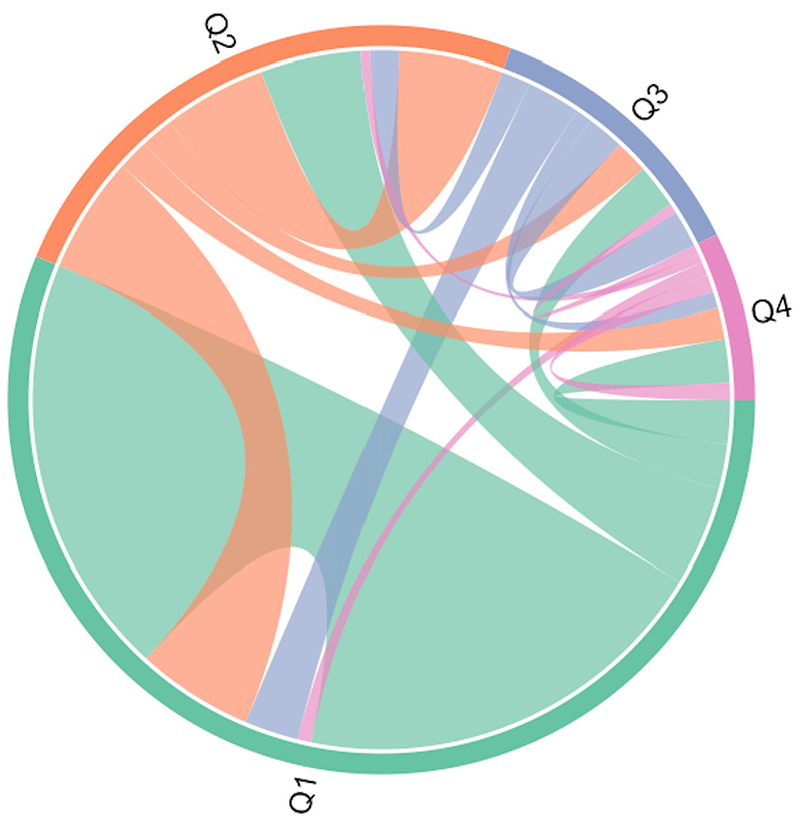
Chord diagram for studies in journals for which only journal quartile value is calculated.

Chord diagram for studies in all LIS journals.
In Figure 5, which was prepared only for the citation rates of the studies in journals with calculated Q values (Journal Quartiles) to other journals with calculated journal quartile values, the first noticeable situation is that the authors of the publications in Q1 and Q2 journals with relatively higher impact values benefited from the publications in the same quartile. In more detail, when Q1 journals, which can be considered as the journals with the highest impact value, are examined, it is observed that approximately half of the citations of the studies in these journals are made to the studies in Q1 journals (48.9%). For the remaining half of the citations, 27% were made to Q2 journals. About a quarter of the citations were to studies in Q3 and Q4 journals with the lowest impact factor (12.8% and 11.3% respectively). Thus, it can be suggested that the potential citation performance (journal quartile value) of the journal in which the cited study is located matches the potential citation performance of the journals in which the studies in the reference are largely located.
The dataset also includes journals that are included in WoS but for which the journal quartile value has not been calculated. For example, journals that are indexed in WoS but not enough time has passed to calculate the journal quartile value, or journals in ESCI, books, theses, etc. fall into this category. When we consider the studies in such journals, a pattern emerges as shown in Figure 6. Here, similarly, it is observed that the citations in the studies in journals whose journal quartile value is not calculated are generally made to publications in journals whose journal quartile value is not calculated. Among the journals for which the journal quartile value cannot be calculated, while citations to publications in Q2, Q3, and Q4 journals are similar, it is observed that there are more intense citation relationships with Q1 journals with relatively high impact values. The reason that makes this pattern different may be the citation of different types of publications such as books or theses.
It is a known fact that the impact of citation databases on science has increased over time. There is a cumulative effect due to the increase in access opportunities. However, developments in the scientific field in different time periods (consortial agreements, enlargement policies, etc.) influence citation behaviors and patterns. For this reason, to observe whether there are periodic differences in our dataset covering the period between 1945 and 1922, these date ranges were analyzed in detail in 27 (1945–1972), 24 (1973–1997), and 24 (1998–2022) year periods. Periodic chord diagrams were prepared based on 78,210, 683,390, and 7,654,538 attributions respectively (see Figures 7, 8, and 9).
1945 to 1972 period (based on 78,210 citations).

1973 to 1997 period (based on 683,390 citations).

1998 to 2022 period (based on 7,920,461 attributions).
For the first 27 years, there are no journals in the Q1 quartile among the journals with citing studies. However, when the citations to the journals in the Q1 quartile between 1945 and 1972 are analyzed, it is observed that the citation relations between the studies in Q1 journals with the highest impact value and the studies in Q4 journals with the lowest impact value are intense. In other words, it can be said that the studies in Q4 journals cited the Q1 journals with the highest impact value. It is seen that more than half (53.2%) of the citations made to the articles in Q1 journals in all of the articles in the field in the year range in question come from the studies in Q4 journals. While interpreting this finding, it should be kept in mind that journal quartile values change from year to year. Within the scope of the study, journal quartile values were calculated according to the JCR 2021 list.
Another notable point in the chord diagrams is that while the studies in the 1945 to 1972 period (Figure 7) are mostly from journals in the Q4 quartile (there are even no Q1 journals), more than half of the citations in the other two periods are among the studies in Q1 journals. The reason for this is that the dataset consists of journals in the Information Science field. Since Information Science was not initially defined as a sub-field in WoS, the journals here may be Q4 journals of a higher field. This is probably the reason why there were no Q1 journals in the dataset during this period. In other words, this situation may be related to the system called inheritance in the WoS system. This situation also has a disadvantage for the dataset of the study. Even if a study directly related to LIS was included in a journal labeled as Social Science in the legacy system, this study could not enter our dataset.
In the periods 1973 to 1997 (Figure 8) and 1998 to 2022 (Figure 9), citation links between studies in Q1 journals and studies in Q1 journals are quite intense, with a pattern similar to the general pattern (Figure 5). For example, in 1973 to 1997, 65.9% of the studies in Q1 journals have citation links with studies in Q1 journals. Roughly we can say that in 1998 and onwards, studies in the journals cited studies in the equivalent quartile.
Chord diagrams, in which eight and a half million citation relationships are analyzed, are valuable in showing the practices and citation patterns of the field. At this point, it is useful to look at this period with a closer projection to better understand the citation pattern in the 1945 to 1972 period, which has fewer publications and has a different pattern from other periods. Seven journals in this period started to be indexed in WoS in the second half of the 1900s (see Table 2).
Descriptive Statistics for Journals in the Period 1945 to 1972.
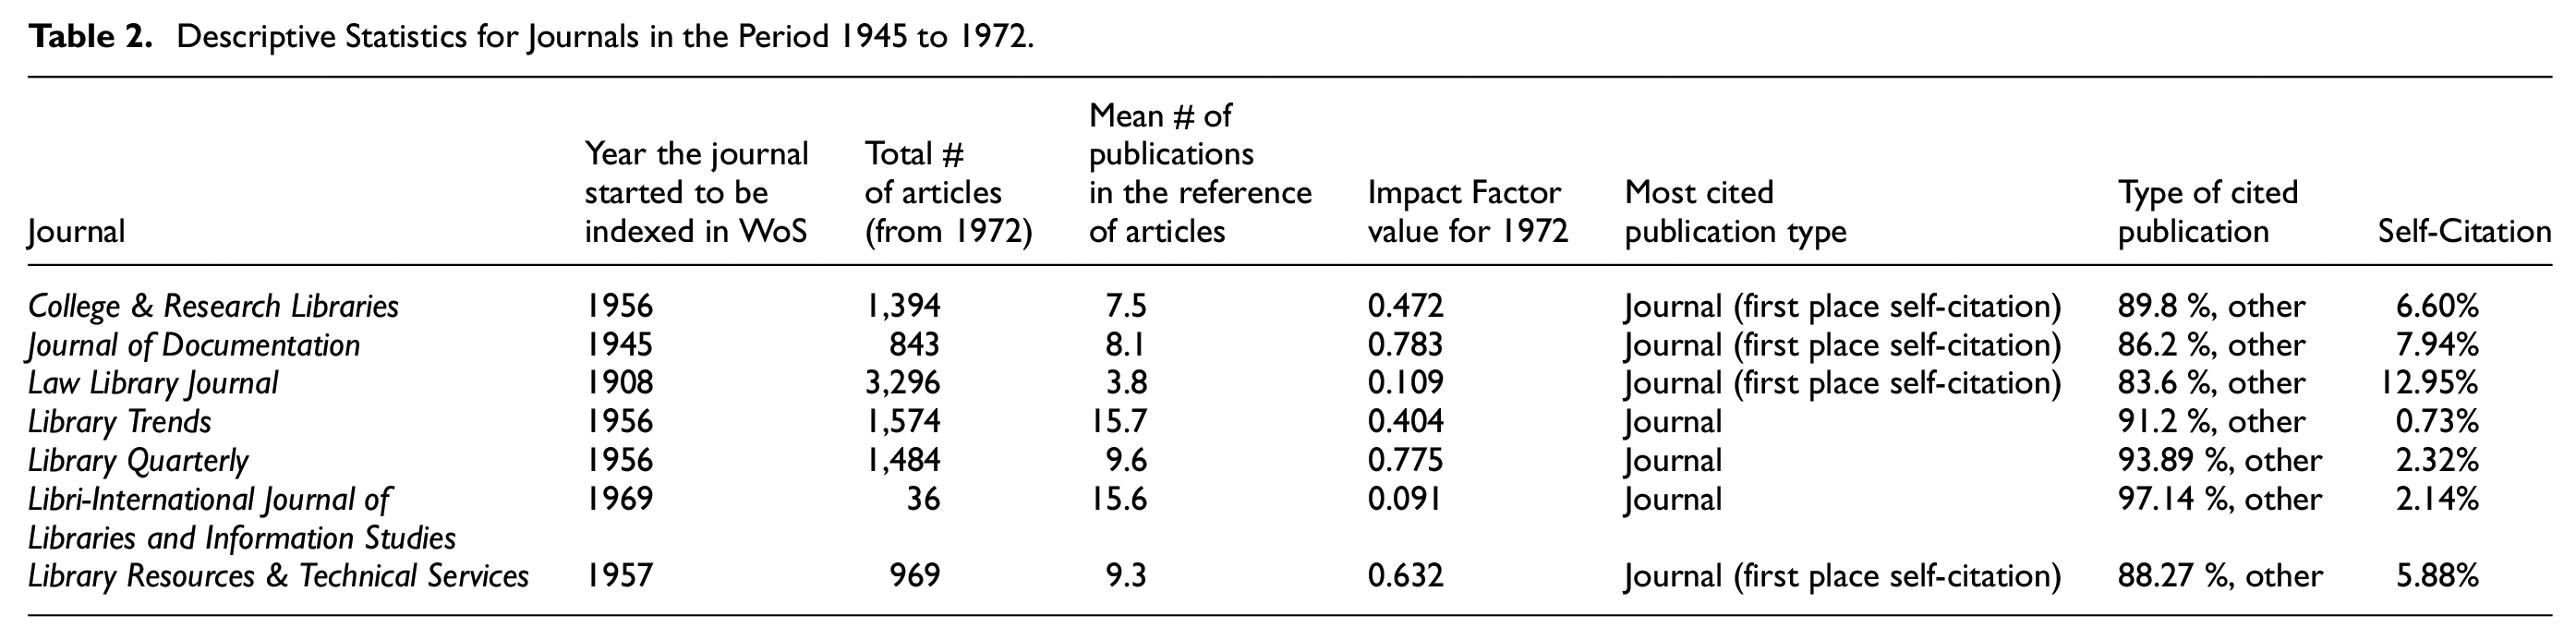
Since there were very few journals in the 1945 to 1972 period, the majority of the studies published there (about 90%) cited publications other than journal articles (including monographs, theses, dissertations, newspaper articles, and publications for which the journal quartile value was not calculated). The average self-citation rate of these journals was 5.5%. When the citations of four journals (College & Research Libraries, Journal of Documentation, Law Library Journal, and Library Resources & Technical Services) were analyzed, it was found that the most cited studies were from the same journal. In addition, since the number of journals indexed in WoS was very low during this period, it is expected that the potential self-citation rate would be high. Law Library Journal, which is the oldest journal among the seven journals (1908), has the highest self-citation rate. The impact factor of this journal, which has a self-citation rate of 12.95%, is 0.109 in 1972. In addition, this journal has the second lowest citation potential among these seven journals. Library Trends, which has the lowest self-citation ratio (0.73), is the richest journal in terms of the number of publications in references (mean 15.7). In this period (1945–1972), the limited availability of WoS-indexed journals may have naturally led researchers to rely more on books and non-indexed sources. Thus, the observed pattern could reflect changes in journal accessibility rather than a fundamental shift in citation practices. The apparent trend in citation behavior may not necessarily indicate a change in researchers’ citation habits but rather an expansion in the availability of indexed journals over time.
The last period in the dataset, 1998 to 2022, is the most suitable period to answer the main question of the study, as it contains the largest number of journals and citation information. JCR started reporting journal quartiles in 1997. As mentioned before, JCR 2021 journal quartile values were used in the chord diagrams made to analyze the question of the study. How much the journal quartile values of the journals have changed in this process is also important. According to the JCR, 32 of the 85 journals indexed in WoS and whose quartile values were calculated, had their quartile values calculated since 1997. Only three of these journals have remained the same from the beginning. When we look at the middle of the period, the situation is slightly different. 30 of the journals with quarterly values calculated in 2009 have the same journal quartile values as in 2021. It is considered normal to have fluctuations in quarterly calculations calculated using citation data, which are inherently skewed (Tonta & Akbulut, 2021, p. 392).
Within the scope of the study, author and journal level networks were also created to monitor the projection of citations in the field. While creating the network, a sample (25%) using stratified probabilistic sampling technique was selected from the dataset to avoid the “out of memory” error encountered in VOSviewer. As mentioned before, data were downloaded from WoS according to journal names. The articles in the relevant journal are sorted by date, which is the default in WoS, and are in 500 records. These files were sorted by journal name and a 25% sample was selected from the sorted list using a probability-based stratified sampling method. A complete count method was used to calculate the networks.
When the network created for authors (Figure 10) is analyzed, three main clusters stand out. In very general terms, the cluster in the upper left corner contains mostly authors working in the field of bibliometrics. The upper right cluster includes authors working on digitization and the lower cluster includes authors working on scholarly communication. Matthew effect, which means accumulated superiority, is used in sociology to explain situations where the rich get richer and the poor get poorer (Akbulut, 2016, p. 16). Similarly, in bibliometrics, the Matthew effect describes the probability that the more well-known of two scholars will receive a much higher number of citations than the less well-known one (Smucker, 2008). Kailash Chandra Garg is one of the first names to stand out when the network for authors is analyzed from this perspective. Garg is prominent with his work in scientometrics and bibliometrics and has numerous publications. Another prominent name is Anna Maria Tammaro, who also publishes on digitization. Both authors are more prominent in the network than authors with a similar number of publications. This can be explained by the fact that authors who exceed a certain citation threshold are more likely to be cited (the Matthew effect).

Author network.
The Matthew effect observed in social networks was also observed when analyzing chord diagrams. After a while, citations to publications with a similar structure or potential citation impact bring some authors to the forefront and the Matthew effect becomes even sharper. As the number of publications increases, the potential citation impact increases, and authors who exceed the citation threshold are more likely to be cited. This structure is easily observed when the projection of the field is traced on a map (Figure 10).
When the network of journals cited in the studies in the dataset (Figure 11) is analyzed, it is seen that the brown colored cluster, which is located as a discrete cluster in the network, consists of journals of Italian origin and containing Italian studies. These journals have formed a cluster because they have intense citation relationships between local studies in their content. Two of the biggest spots in the network are theses and studies without titles. Especially in the references of older studies, untitled studies and theses are in the majority. On the other hand, the journal that constitutes the largest point in the blue cluster and the entire network is Scientometrics, which is one of the important journals in the field and has a high index of betweenness in the network as it is able to connect with other clusters.

Network created for journals cited in the dataset.
Discussion
The exponential increase in academic publications in recent years (Bornmann et al., 2021, p. 9) requires a more selective citation routine that forms the basis of scientific research. Citation behavior, which is directly or indirectly influenced by many situations, is considered to be the main factor in the healthy functioning of the scientific ecosystem. In this study, articles and citations in journals in the field of Librarianship and Information Science in the WoS citation database were analyzed to investigate the citation tendency in more qualified or better controlled publications. In the study, the journals in the field were examined on the basic question of whether qualified publications are cited in qualified publications, which is defined as “academic elegancy,” and their course over time was followed. According to the findings, while more non-WoS materials were observed in the citation set in the 1945 to 1972 period, which is the oldest date in the dataset, this rate decreased in the 1998 to 2022 period. In other words, in the period 1998 to 2022, which is the last period that constitutes the data set, the rate of citing studies published in journals indexed in WoS is close to half (45%). Considering that non-WoS materials include sources such as books and theses, this rate is significantly higher. In addition, ESCI journals, whose quarterly value is not calculated, are also included in this rate. Based on this data, it can be said that academic elegance has started to emerge in scientific communication in the last 20 years. It is expected that authors’ tendency towards elegance will increase as access to resources increases. The WoS platform, where relatively good publications in the field are found together, has also facilitated the creation of elegance in a way
While the fact that the importance of a study is usually measured by the number of citations (Boyack & Klavans, 2005) has been discussed, it seems that the citation routine has also been affected by this change after the importance of publishing in WoS indexed journals has become one of the main criteria in evaluations such as promotion and incentives. As an example, in the findings of the study, the references of studies published in Q1 journals, which have a higher impact factor, were included in almost half of the studies cited in Q1 journals (1,883,285 citations, 48.9%) (See Figure 1).
The theory in sociology that those with similar characteristics exhibit similar behaviors (Hofstede, 1980) also fits the citation routine of the authors in the WoS indexed journals in the field of Librarianship and Information Science in the data set. When we look at the whole picture in the findings, it is seen that in the analysis, which includes journals in ESCI or journals whose Q value is not calculated and sources such as books, theses, etc., it is seen that these sources are mostly cited to sources whose Q value is not calculated. In addition, when the analysis is examined in detail, it is seen that the Q1 quadrant is cited more than the others (Q2, Q3, Q4) from the ones in the category of the without a quarter value (other) (see Figure 2). On the other hand, using current journal quartile data without historical context may misrepresent how journals’ prestige and rankings have changed over time. The quartile (Q1, Q2, Q3, Q4) values used by Web of Science are recalculated annually based on the citation performance of journals and may vary according to the journal’s impact factor and other bibliometric measures. For example, a journal may be in the Q1 category 1 year, and then drop to Q2 or Q3 the next year due to fluctuations in citation rates. Furthermore, field-based differences and the fact that some journals’ citation rates are influenced by external factors (e.g., editorial policies or special issues) can further complicate the stability of quartile values. Therefore, this variability can make it difficult for researchers and institutions to establish a standard when evaluating their publications and can provide a potential bias when trying to understand citation patterns.
Ensuring research integrity is one of the most important issues in scientific communication in recent times. Researchers now need trust to rely on the work of others (Simon, 2022). The most important reason why this issue is on the agenda is the negligence and illegal structures in the publishing sector. For example, although the findings of the cold fusion research by Martin Fleischmann and B. Stanley Pons (1989) have not been confirmed, they continue to be the subject of many scientific publications. However, it is also important to take extra care from damaging the scientific accumulation when choosing the sources used in studies in order to prevent the predatory structures that have emerged in the last decade. Previous studies in the literature on researchers’ citation routines have found that the journal’s impact factor (JIF), quality and prestige are important. However, when the publications in the journals in the WoS database, where relatively better controlled quality publications are indexed, almost half of the bibliographic citations go to the studies in this index, which is important in terms of showing that elegancy has increased in academia.
Limitations and Potential Bias of the Study
This study was conducted only in the field of Library Science and Information Science. An analysis that includes other disciplines would yield more generalizable results. Although citation metrics are often used as indicators of research impact, they may not necessarily correspond to scientific quality. Citations can be influenced by a variety of factors, including self-citation practices, academic network effects, journal prestige and trends in scholarly communication. While high impact factor journals tend to receive more citations, this does not necessarily mean that all work published in those journals is of higher quality. Similarly, low impact factor journals may contain less cited due to limited visibility but highly valuable contributions. However, the analysis of the 1945 to 1972 period is constrained by a limited number of indexed journals, potentially introducing bias into the citation patterns observed. On the other hand, misclassification due to the WoS inheritance system could affect the accuracy of the journal dataset and citation classifications. The use of a 25% sample size for constructing the citation network introduces a methodological constraint, as it may inadequately capture the full diversity of scholarly contributions, particularly marginalizing niche authors or specialized journals with fewer citations. This reduction in data granularity risks skewing the understanding of intellectual influence and knowledge dissemination patterns, potentially overlooking underrepresented yet impactful nodes within the academic ecosystem.
Footnotes
Acknowledgements
Thanks to Dr. Müge Akbulut for reviewing an earlier version of the study.
Ethical Approval
Since this study does not concern any ethical issues, there is no need for ethical approval.
Funding
The author received no financial support for the research, authorship, and/or publication of this article.
Declaration of Conflicting Interests
The author declared no potential conflicts of interest with respect to the research, authorship, and/or publication of this article.
Data Availability Statement
The datasets analysed during the current study are available from the corresponding author on a request.