
Abstract
As the global economy enters a phase of complexity and volatility, sustainable innovation has become the primary driving force behind the economic development of nations. While existing literature acknowledges the existence of peer effects in corporate innovation, the impact of multi-sourced peer pressure arising from the innovation gap between focal firms and their peer group on enterprises’ sustainable innovation (ESI) remains to be explored. This study explores the impact of network, regional, and industry peer pressure on ESI, as well as the moderating effect of digital transformation (DT) based on the Chinese A-share listed manufacturing firms’ panel data in Shanghai and Shenzhen from 2016 to 2021. The findings reveal that: (1) Network, regional, and industrial peer pressure all have a significant positive impact on ESI, the effect of average peer pressure on ESI is significantly higher than that of maximum peer pressure. (2) The impact of peer pressure on ESI exhibits heterogeneity across different innovation types, firm sizes, and network embedding groups. (3) DT plays a positive moderating role in the relationship between peer pressure and ESI. For large-size and high-network embedding firms, DT significantly moderates the effect of average peer pressure on ESI. This study broadens the scope of factors influencing corporate innovation and deepens the understanding of peer effects. The findings provide valuable insights for policymakers and corporate managers seeking to promote ESI in the digital age.
Keywords
Introduction
According to the Global Innovation Index (GII) 2024 released by the World Intellectual Property Organization, the global innovation landscape is characterized by considerable uncertainty. Critical indicators of future innovation, such as venture capital activity and R&D funding, have displayed distinct signs of decline. In spite of these challenges, China has advanced to 11th globally and remains the sole middle-income economy among the top 30 in the GII rankings. As a prominent force in global innovation, China acknowledges the essential role of enterprises in driving technological progress. In response, the Chinese government has enacted a series of policies aimed at stimulating enterprise innovation and increasing R&D investment. The report of the 20th National Congress of the Communist Party of China further emphasizes the importance of the “innovation-driven strategy,” stating that “we will reinforce the principal role of enterprises in innovation, give full play to the guiding and supporting role of key high-tech enterprises, create an enabling environment for the growth of micro, small, and medium technological enterprises.” According to the National Bureau of Statistics, Chinese enterprise R&D investment accounted for over three-quarters of the total societal R&D expenditure in 2022. Moreover, enterprises participated in nearly 80% of national key R&D projects and contributed over 80% to the total transaction value of technology contracts nationwide. In today’s society, sustainable innovation serves as an endless driver for the growth of enterprises (S. Chen, 2016). Enterprise sustainable innovation (ESI) can be defined as a continuous effort to build an enterprise’s creative ability in terms of products, processes, and services (Latan et al., 2020). It reflects the long-term accumulation of knowledge and the ongoing technological advancements in corporate innovation (Geroski et al., 1997). The enterprise life cycle theory suggests that companies can maintain sustainable development and prolong their market presence by continuously adapting and evolving. Therefore, sustaining innovation is a critical strategy for companies to gain a competitive advantage and enhance their market position in an uncertain environment (Tavassoli & Karlsson, 2015).
Previous studies have examined the factors influencing ESI from both macro and micro perspectives, offering insights into the dynamics of firms’ engagement in ESI (Bhatti et al., 2023; G. Chen et al., 2021; N. Li et al., 2023). However, these studies often treat companies as isolated entities neglecting their mutual influences. Innovation activities require substantial investments and involve significant risks. As a result, companies frequently observe and imitate the innovation practices of their peers in areas such as R&D investment, innovation investment, and information disclosure to mitigate the effects of information asymmetry. This interaction leads to frequent mutual referencing and imitation among companies, known as innovation peer effects (Yang et al., 2024). Existing research in economics and sociology indicates that peer behavior can create a social multiplier effect, often leading to consequences that ripple throughout the system (S. Wang et al., 2024). Peer effects not only consider the relationship between individuals and markets in traditional economics but also incorporate the influence of shared social ties, industry affiliation, or regional proximity on firms (Huang et al., 2024; T. Zhang, 2023). Meanwhile, with the advancement of information technology, DT has become deeply integrated into various sectors and has yielded significant results in ESI. Luo et al. (2023) found that the development of the digital economy can enhance the level of green innovation by increasing economic openness, optimizing industrial structure, and expanding market potential. Zheng and Zhang (2023) discovered that DT can strengthen enterprises’ green technological innovation capabilities, with small and medium-sized enterprises having a distinct advantage. Although existing studies have acknowledged the presence of the peer effects in corporate innovation, insufficient attention has been paid to the pressure mechanisms through which these effects influence ESI in the digital age.
Rooted in the preceding discourse, this paper addresses two pivotal questions: How do multi-source peer pressures arising from network, regional, and industrial contexts influence ESI in the digital age, and what role does DT play in moderating these effects?To bridge these theoretical gaps, this paper integrates pressure interaction theory and peer effect literature to construct a multi-source peer pressure framework. First, this paper extends the peer effect theory by conceptualizing network, regional, and industry peer pressure indicators based on interlocking directorate networks, company registration locations, and industry affiliations, and then, examines their impact on ESI. Second, the paper examines heterogeneous effects across innovation types, firm sizes, and network embeddednesses. Third, the study demonstrates the positive moderating role of DT in the relationship between peer pressure and ESI. The study’s conceptual framework is shown in Figure 1. This research reveals the mechanisms through which multi-source pressures influence ESI and emphasizes the regulatory role of DT. Furthermore, it provides valuable insights for manufacturing firms seeking to enhance their sustainable innovation capabilities and offers guidance for policymakers.
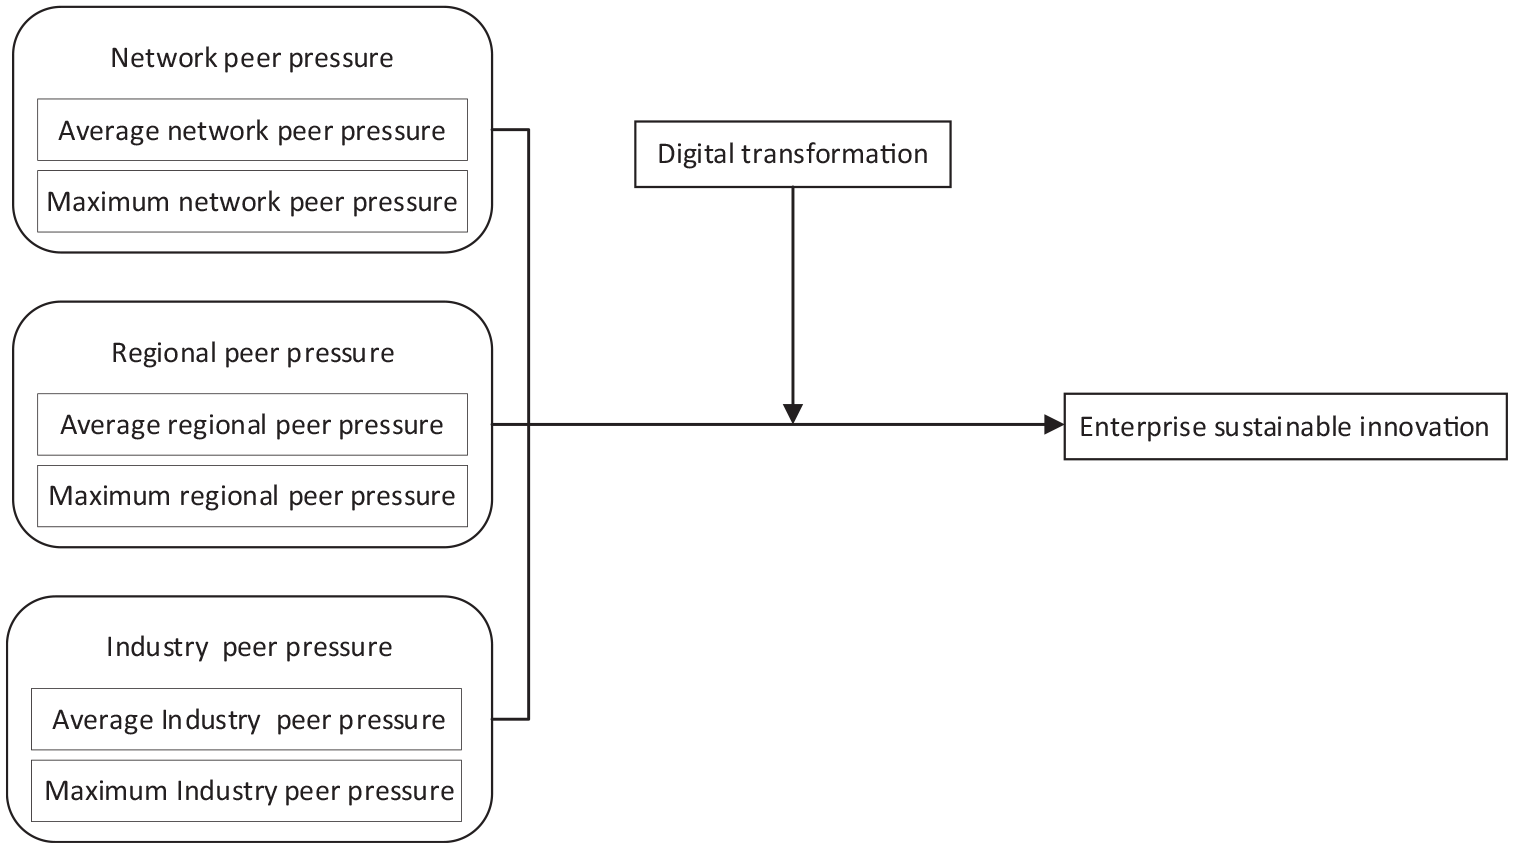
Conceptual framework.
Literature Review and Hypothesis Development
Peer effect refers to a scenario in which individuals within a defined group intentionally emulate the actions of their counterparts when faced with similar situational contexts (Guo et al., 2024). This phenomenon can be categorized into network peer effect (Dong et al., 2023), industry peer effect (Zaighum et al., 2024), and regional peer effect (X. Zhang & Du, 2023). Continuous innovation is an important way to maintain a competitive advantage in an uncertain environment (Tavassoli & Karlsson, 2015). It requires enterprises to break through the short-term performance orientation and form long-term capabilities to cope with environmental uncertainties through the continuous accumulation of knowledge assets, the dynamic optimization of innovation processes, and the systematic integration of internal and external resources (Saxena et al., 2024). The stress interaction theory is a theory used to explain the coping behaviors and outcomes of individuals or organizations in stressful environments, which emphasizes the mutual influence between external pressures and the coping behaviors of individuals or organizations (Mitchell et al., 2019).
Existing research on peer effects mainly focuses on the consistency of outcomes among peer firms, while paying insufficient attention to the pressure mechanisms that lead to such outcomes. From the perspective of pressure mechanisms, if an enterprise has relatively low innovation capabilities while its peer enterprises possess strong innovation capabilities, then it will face tremendous innovation peer pressure. Drawing on the theory of pressure interaction, when confronted with the pressure of high innovation output from peer firms, focal firms evaluate their internal and external resources to develop either proactive or reactive innovation strategies (Greve, 2003). Theoretically, firms have the autonomy to choose to imitate one or more competitors in the market. This study explores the peer pressure stemming from the gap in the innovation quantity between the focal firms and their peers, bifurcating into network pressure, industry peer pressure, and regional peer pressure.
First, previous research has demonstrated that a firm’s social network facilitates access to essential knowledge, experience, and information resources (Dbouk et al., 2020). As an important social network relationship, the interlocking director network not only facilitates low-cost information sharing and knowledge exchange between firms but also provides essential resource support for firms’ risk-taking behaviors (H. Li et al., 2023; Z. Wang et al., 2022). The interlocking directorate network, which is formed between firms through the concurrent appointments of directors (Feng et al., 2024), has become widely prevalent among firms in China. Based on upper echelons theory, interlocking directors utilize their cognitive judgment to harness the advantages and resources necessary for implementing sustained innovation strategies within their appointed firms. They play a pivotal role in directly transferring specific innovation experiences from one firm to another, particularly to focal firms that require such expertise. The gap in innovation output places focal enterprises under peer pressure, driving increased investment and enhanced innovation capabilities. This process facilitates the seamless transmission of sustained innovation practices across firms, optimizing internal expertise and social resources, and enhancing the effectiveness of innovation implementation.
Second, firms within the same region share similar business environments, locational advantages, and innovation ecosystems, which fosters regional convergence in innovation behavior as firms seek to access resources and development opportunities (Yang et al., 2024). Through the flow of labor and information, companies within the same region are more likely to engage in information sharing, technological exchange, and knowledge transfer (Dougal et al., 2015), thus creating a conducive environment for mutual observation and learning. According to strategic ecology theory, while the “symbiont” identity of peer members facilitates resource sharing, it also imposes institutional constraints and environmental pressures on the strategic decisions of focal firms. When the innovation performance of a focal firm lags behind that of its regional peers, the firm is likely to increase its innovation investment to improve performance (H. Liu et al., 2023). As peer pressure intensifies, focal firms are more likely to take measures to narrow the innovation output gap.
Third, according to market competition theory, firms face comparable business, technological, and market challenges (Seo, 2021), compelling them to closely observe competitors’ strategies and adapt proactively to preserve their competitive edge. Empirical evidence indicates that corporate behavior often mirrors that of industry peers (T. Zhao & Wang, 2024), and the competitive dynamics within an industry create peer pressure that encourages firms to adopt imitative strategies (Aerts et al., 2006). The greater the performance gap between the target firm and the industry cluster, the more likely it is that the firm will adopt a high-intensity R&D strategy. Firms whose performance falls short of expectations are more inclined to imitate the innovation behaviors of their peers. When there is an innovation performance gap between the focal firm and its industry peers, it motivates the firm to continuously enhance its innovation capabilities. Based on this analysis, the following hypotheses are proposed in this paper:
H1: Peer pressure promotes ESI.
ESI is a dynamic and continuous process of knowledge creation, exploration, development, and resource integration (Xu et al., 2024). With the rapid advancement of technological innovation, the scope of technological fields involved in innovation has expanded significantly, and the complexity of innovation has increased. DT, characterized by high-tech capabilities, wide-ranging coverage, and strong penetration, has emerged as a critical driving force for ESI in manufacturing enterprises.
DT dismantles corporate boundaries by leveraging artificial intelligence and machine learning technologies to identify, classify, and organize extensive external knowledge, thereby extracting valuable insights that update the enterprise’s knowledge system (Cohen & Levinthal, 1989). Moreover, data mining techniques such as cluster analysis enable in-depth examination of user needs, offering insights into market trends and competitor dynamics, thus establishing a robust foundation for continuous innovation. From an internal operational perspective, DT enhances management efficiency, reduces costs, and boosts total factor productivity (Andrés et al., 2024). It facilitates the formation of a data-driven decision-making model (Brynjolfsson & McElheran, 2016), minimizes information costs, alleviates information asymmetry, and promotes the effective integration of internal and external resources. This not only improves the marginal productivity of data factors but also elevates the overall operational efficiency of enterprises, reinforcing their capacity for continuous innovation.
Existing research demonstrates that DT can amplify herd behavior in corporate innovation (Z. Wang & Yang, 2024), and serve as a pivotal strategy for enterprises to address external pressures (X. Zhao & Cai, 2023). Peer pressure, as a significant external factor, frequently influences enterprises’ innovation decisions. DT accelerates information diffusion and knowledge spillover, enhancing the scale, efficiency, and integration of information flow. This enables enterprises to better comprehend peer innovation strategies and market trends, leading to more informed innovation decisions. The open innovation network established through DT fosters knowledge interaction and collaborative cooperation among enterprises. Enterprises with advanced DT capabilities can effectively harness peer pressure, transforming external challenges into innovation drivers, and ultimately strengthening ESI.
Based on this analysis, this study proposes the following hypothesis:
H2: DT positively moderates the effect of peer pressure on ESI.
Research Design
Data Source and Sample Selection
The study examines all manufacturing companies listed on the Shanghai and Shenzhen stock exchanges from 2016 to 2021. General data are sourced from the CSMAR database, while patent data are obtained from the INNOJOY database. After excluding firm-year observations with missing data for variables used in the main regression models, the final sample consists of 3,918 firm-year observations from 653 unique firms.
Definition of Variables
Enterprise Sustainable Innovation
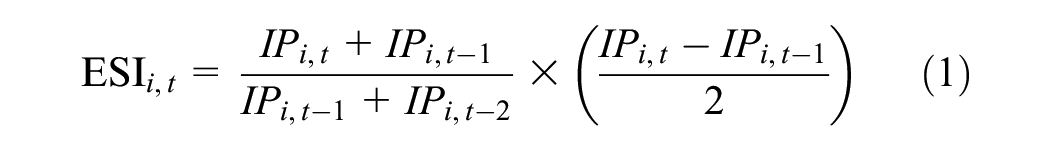
The Chinese patent system grants three types of patents: invention patents, utility patents, and design patents. Invention patents (IP) are distinguished by their novelty and technical inventiveness (Lei et al., 2024). IP typically refers to a new and creative technological development in the process of ESI. Drawing on existing studies (Roper & Hewitt-Dundas, 2008), this research establishes a model to measure ESI:
Multi-Source Peer Pressure
According to existing research (Yang et al., 2024; T. Zhang, 2023), this paper constructed peer pressure indicators based on network, regional, and industry peer effects. As described in Figure 2, suppose there are seven companies (A–G) located across three industries and two regions. Company C is used as an example to illustrate the three types of peer relationships. For network peer effects, Company C has network peers—Companies A, D, E, F, and G—based on inter-firm linkages. For the regional peer effect, Company C located in Region b, has regional peers—Companies E, F, and G. For the industry peer effect, Company C located in Industry B, has industry peers—Companies A and G. Peer pressure is measured by the difference in the number of IP held by the focal enterprise and its peer enterprises.

Schematic diagram of the peer effects.
Peer pressure is measured in two ways: average peer pressure and maximum peer pressure. Average peer pressure is the difference between the average number of patents filed by peer firms and the total number of patents filed by the focal firm. Maximum peer pressure is the difference between the maximum number of patents filed by any peer firm and the total number of patents filed by the focal firm.
Network peer pressure is based on interlocking director network relationships, where enterprises that have a network adjacency relationship with the focal enterprise are defined as its peer enterprises. Regional peer pressure is based on geographic proximity, with firms located in the same province as the focal enterprise considered peer firms. Industry peer pressure is based on industry classification, where companies within the same industry as the focal firm are identified as peer firms. The specific measurement methods for the variables are provided in Table 1.
Definitions of Variables.

Digital Transformation
According to existing research (Lei et al., 2024), we use the natural logarithm of 1 plus the frequency of the keywords “digital transformation” in the annual report to measure the firm’s degree of DT. This assessment focuses on five dimensions: artificial intelligence, blockchain, cloud computing, big data, and digital technology applications.
Control Variables
To control other factors that can affect ESI, the article selects the following variables based on the existingliterature (B. Chen et al., 2024; Lei et al., 2024; Ortiz-de-Mandojana & Bansal, 2016): Age, Size, Debt, Earn, Industry, and Year.
Model
Baseline Model
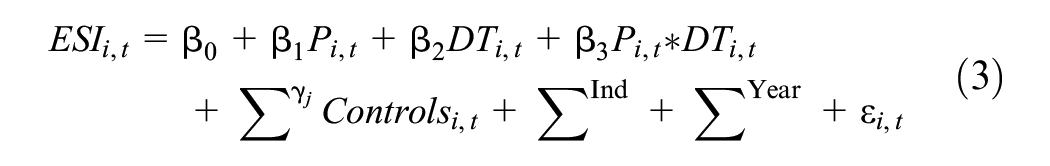
In this study, the Hausman test and F test were conducted on the regression between multi-source peer pressure (ANPP, MNPP, ARPP, MRPP, AIPP, and MIPP) and ESI using the full sample. The results show that the Hausman test statistic is 36.48 and significant at the 1% significance level, indicating that the null hypothesis of the random effects model should be rejected. Meanwhile, the F-test statistic was 1.25, which was also significant at the 1% level, further supporting the applicability of the fixed-effect model. Therefore, this paper ultimately adopts the fixed effects model for analysis. To examine the impact of peer pressure on ESI, the following estimation equation was formulated:

Where i and t indicate the company and year, respectively, and the independent variable
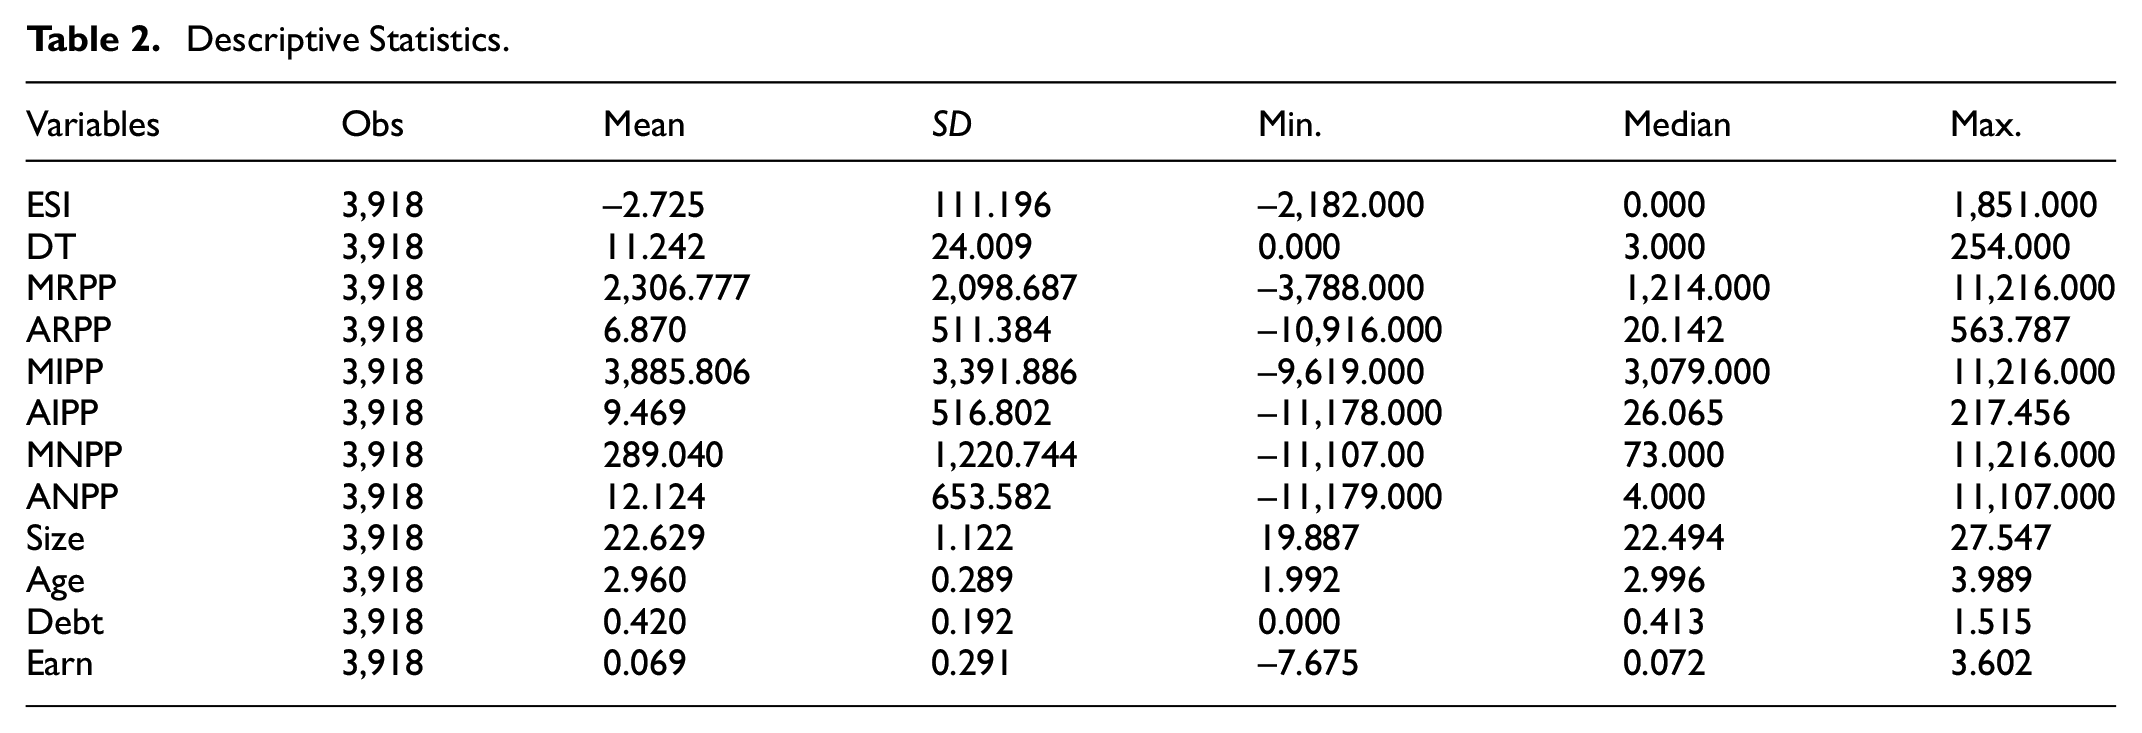
Descriptive Statistics.
Mediating Effect Model
Following prior study (Z. Wang & Yang, 2024), DT may act as a moderating role. In order to test H2, the study establishes the following equation:
Empirical Results
Correlation Analysis
Table 3 presents the Pearson correlation coefficients of the key variables. In line with Hypothesis 1 of this study, it is evident that the coefficients for multi-source peer pressure (MRPP, ARPP, MIPP, AIPP, MNPP, ANPP) and ESI are approximately 0.041, 0.293, 0.070, 0.298, 0.122, and 0.210, respectively, all of which are positively significant at the 1% level. Furthermore, the correlation coefficients among the variables do not exceed .8, indicating that multicollinearity issues among the variables have been effectively avoided.
Correlation Coefficients.
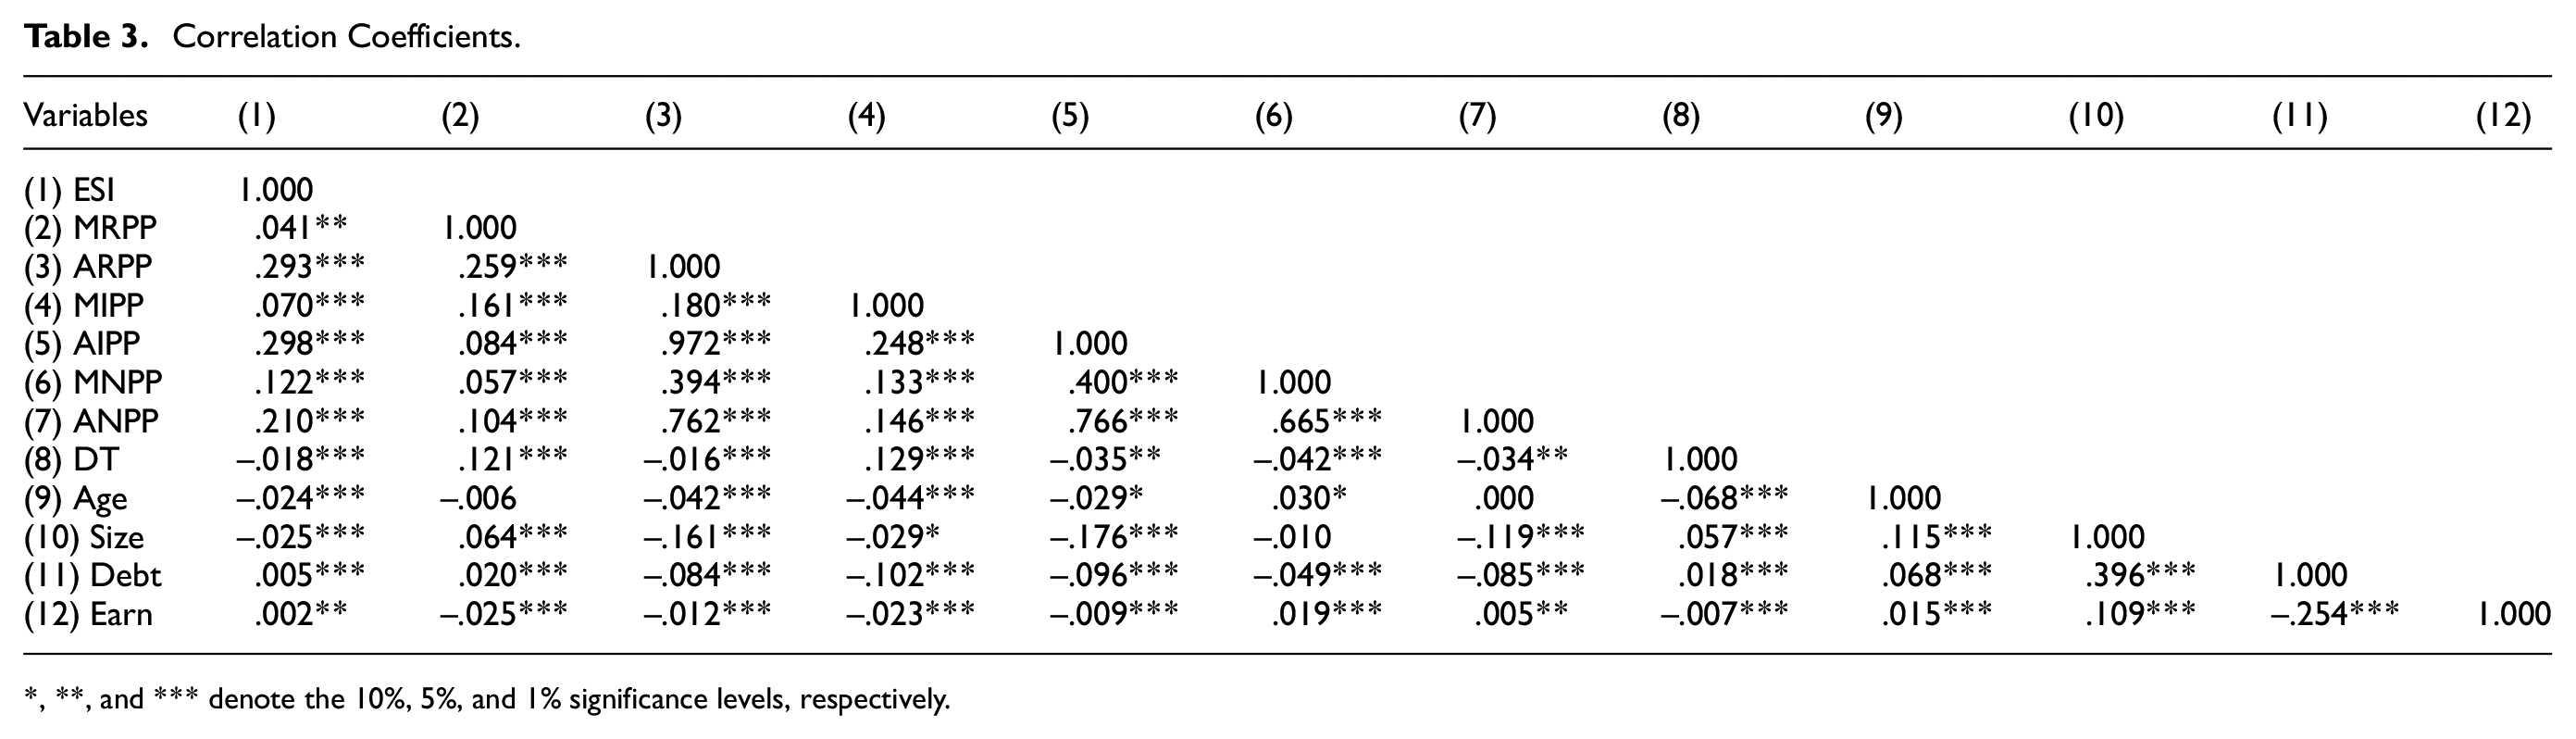
, **, and *** denote the 10%, 5%, and 1% significance levels, respectively.
In order to ensure the accuracy and reliability of the empirical analysis, this study employed the Variance Inflation Factor (VIF) method to test for multicollinearity among the explanatory variables. According to the test results presented in Table 4, it can be observed that all Variance Inflation Factor (VIF) values of the explanatory variables are below 10. This indicates the absence of multicollinearity among the explanatory variables, thereby allowing us to proceed with further empirical analysis.
VIF Test Result.

Baseline Results
The regression results for Model 2 are shown in Table 5. Columns (1) and (2) show that both ANPP and MNPP have a positive effect on ESI, with significance at the 1% level. This indicates that when the number of invention patents held by network peer enterprises is high, the focal firm, influenced by network peer pressure, tends to increase its level of continuous innovation. Similarly, columns (3) and (4) show that the coefficients for ARPP and MRPP are positive and significant at the 1% level, suggesting that peer pressure from firms within the same region has a significant positive impact on ESI. Columns (5) and (6) show that the coefficients for AIPP and MIPP are positive and significant at the 1% level, which is consistent with the finding of Yang et al. (2024), indicating that peer pressure from firms within the same industry significantly positively influences continuous innovation. Based on the above results, H1 is validated.
Baseline Results.

indicates significance at the 1% level.
When examining average peer pressure and maximum peer pressure separately, it is observed that average peer pressure has a significantly stronger impact on ESI than maximum peer pressure. In the context of innovation activities, focal firms are likely to increase their research and development efforts to catch up with the average innovation level of other firms within their network, industry, or region. However, maximum peer pressure may be much higher than the focal firm’s current innovation level, and such a large gap could reduce the motivation to increase innovation efforts. Therefore, when the innovation level is within reach of the peer group, peer pressure is more likely to drive ESI. In contrast, focal firms are less responsive to maximum peer pressure, and when the innovation gap is wide, peer pressure is less likely to foster innovation,
When considering average peer pressure from the network, region, and industry separately, it is found that ANPP has a relatively weaker effect on ESI compared to ARPP and AIPP. In this study, the corporate network is based on interlocking directorates, which tends to foster collaboration and communication between firms. In contrast, firms within the same region or industry may face competitive relationships, especially in terms of information, resources, and market access. As a result, ARPP and AIPP are more likely to drive continuous innovation in focal firms, while ANPP has a comparatively weaker impact on continuous innovation.
Robustness Test
This paper conducts a series of robustness tests to mitigate concerns that the positive relation between multi-source peer pressure and ESI.
Different Fixed Effects
Considering that enterprises located in the same province may have certain influences on each other’s innovation strategies due to adjacent spatial locations. According to the existing research (Ren et al., 2023), this paper further controls for the provincial fixed effect. The test results are presented in panel A of Table 6. It can be found that the regression coefficients of ANPP, MNPP, ARPP, MRPP, AIPP, and MIPP are .036, .011, .066, .003, .066, and .012 respectively, all of which are significant at the 1% level. which is close to the results obtained from the baseline regressions.
Robustness Tests: Different Fixed Effects, Increase Control Variable, and Lagged Independent.

, **, and *** denote the 10%, 5%, and 1% significance levels, respectively.
Increase Control Variable
Corporate governance plays a pivotal role in shaping enterprise decision-making, serving as a critical determinant of innovation adoption and technological transformation—factors that ultimately influence firm survival and long-term development (Scherer & Voegtlin, 2020). To enhance the robustness of the empirical analysis, this study additionally controls the impact of corporate ownership concentration, measured by the percentage of equity held by the largest shareholder. The regression results presented in Panel B of Table 6 demonstrate robust statistical significance across all peer pressure measures, with coefficients for ANPP (0.038, p < .01), MNPP (0.015, p < .01), ARPP (0.064, p < .01), MRPP (0.002, p < .05), AIPP (0.065, p < .01), and MIPP (0.003, p < .01). These estimates remain statistically significant and align precisely with our baseline hypothesis testing results.
Lagged Independent Variables
Innovation activities are inherently characterized by long cycles and high risks, which may result in a delayed effect of peer pressure on ESI. Additionally, to address potential endogeneity concerns stemming from the bidirectional causality between multi-source peer pressure and ESI, this study employs one-period-lagged multi-source peer pressure measures—including ANPPt – 1, MNPPt – 1, ARPPt – 1, MRPPt – 1, AIPPt – 1, and MIPPt – 1—as explanatory variables. Panel C of Table 6 present the regression results. The estimated coefficients for the impact of one-period lagged ANPP, MNPP, ARPP, MRPP, AIPP, and MIPP on ESI are .074, .022, .118, .005, .118, .017, respectively, all significant at the 1% level. These findings support the robustness of our research conclusions.
Endogenous Concerns
This paper employs the instrumental variables method for stability tests to address potential endogeneity issues related to peer effects, consistent with prior studies (Adhikari & Agrawal, 2018; Leary & Roberts, 2014). Specifically, this study utilizes an extended market index model to construct the instrumental variable—idiosyncratic returns. The validity of equity return shock as an instrumental variable rests on two grounds. First, idiosyncratic returns serve as a proxy for a company’s profitability and innovation potential. The disparity in idiosyncratic returns between peer companies and the focal company reflects the relative advantage of peer companies in terms of innovation input. This disparity may induce the focal company to enhance its own innovation efforts due to competitive pressure from peers, thereby satisfying the relevance criterion. Second, given that idiosyncratic returns are calculated by excluding market-wide and industry-specific factors, the difference in idiosyncratic returns between peer and focal companies is primarily driven by firm-specific factors. These factors are not directly linked to the sustainable innovation decisions of the focal company, thus ensuring the exogeneity of the instrumental variable.The idiosyncratic returns are calculated as follows:


In the above equations,
Panel A of Table 7 presents the first-stage regression results, the estimated coefficients of the instrumental variables return_ANPP, return_MNPP, return_ARPP, return_MRPP, return_AIPP, and return_MIPP are .070, .020, .112, .004, .112, and .020, respectively, all significant at the 1% level. This indicates that the instrumental variables have good explanatory power. Additionally, the Kleibergen-Paap rk Wald F statistics all exceed the minimum critical value of 10 set by Stock and Yogo (2002), confirming the statistical validity of the instrumental variables. The second-stage results reported in Panel B of Table 7 show that the coefficients of ANPP, MNPP, ARPP, MRPP, AIPP, and MIPP are all positive and statistically significant, consistent with theoretical predictions and robustly supporting the study’s main conclusions.
Endogenous Test.

and *** denote the 5% and 1% significance levels, respectively.
Heterogeneity Analysis
Innovation Types Heterogeneity
To further investigate the influence of peer pressure on focal enterprises with different innovation capabilities, the samples are classified according to the differences between the number of invention patents of peer enterprises (network peers, regional peers, and industry peers) and that of focal enterprises. Specifically, the number of invention patents of peer enterprises is calculated using both the average value and the maximum value.
This study classified follower companies as those in the bottom median and leader one as those in the top median of the patent quantity distribution (Yang et al., 2024). When the focal firm is a follower type, columns (1)-(3) of Table 8 Panel A show that ANPP, ARPP, and AIPP have no significant effect on the focal ESI. In contrast, when the focal firm is the leader type, columns (4)-(6) of Table 8 Panel A show that ANPP, ARPP, and AIPP have positive effects on ESI with 1% significance levels. The results of the above analysis indicate that peer pressure (ANPP, ARPP, AIPP) is more likely to promote ESI in leader firms.
Innovation Types Heterogeneity Test.
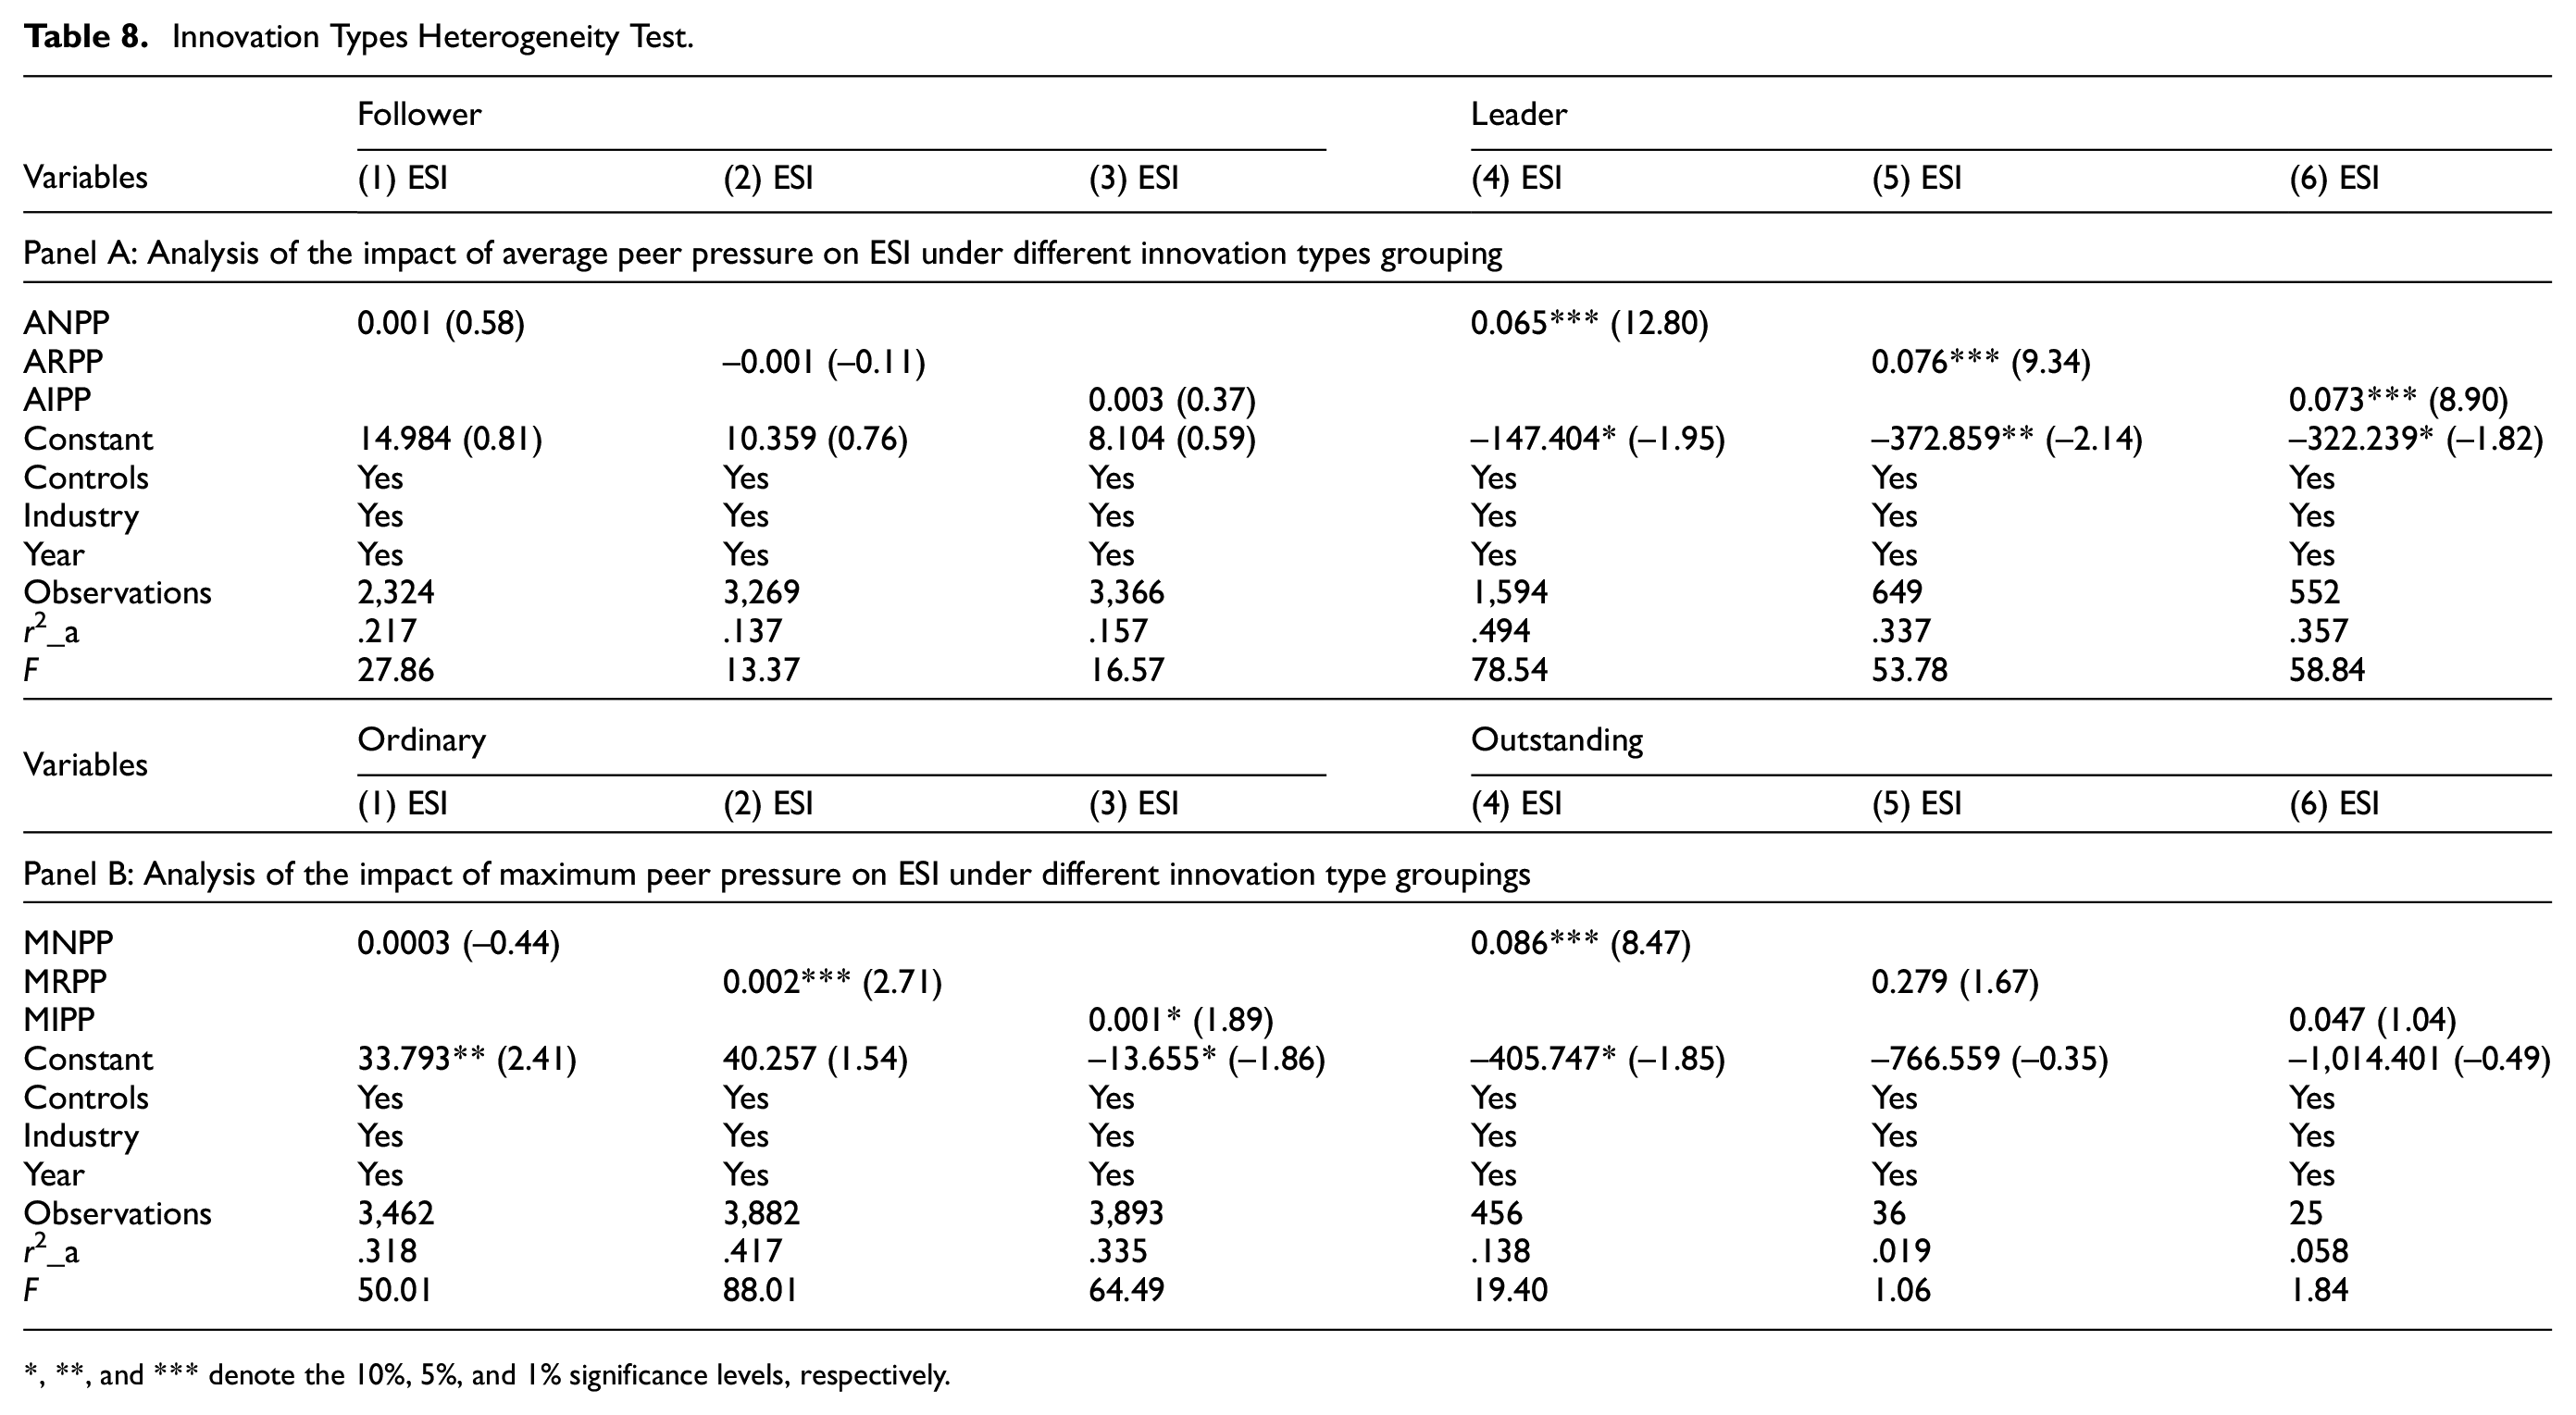
, **, and *** denote the 10%, 5%, and 1% significance levels, respectively.
Furthermore, the samples are classified into ordinary type and outstanding type based on whether the number of invention patents of the focal firm is below or equal to the maximum number of patents held by peer firms. The impact of maximum peer pressure on ESI is shown in Panel B of Table 8. When the focal enterprise is of the ordinary type, Column (1) shows that MNPP has no significant effect on ESI. Columns (2) and (3) indicate that MRPP and MNPP have a significant impact on ESI, but the magnitude of the effect is relatively small. When the focal enterprise is of the outstanding type, Column (4) shows that MNPP has a significant impact on ESI, while Columns (5) and (6) demonstrate that neither the MRPP nor the MIPP has a significant impact on ESI. Such results suggest that MNPP can better promote the ESI of outstanding firms.
Firm Size Heterogeneity
In studies on inter-firm innovation peer effects, firm size is often used as an important grouping variable. In this paper, asset size is chosen as the metric for firm size (Ling et al., 2024). Generally, small-sized firms possess fewer innovation resources and typically exhibit lower innovation output compared to their peer firms, often being under greater peer pressure. Driven by the peer pressure of innovation, small firms are more likely to make larger innovation investment decisions in the next innovation cycle to increase their continuous innovation performance. In contrast, large firms, with more accumulated innovation resources from their operational processes, face relatively lower risks in their innovation activities and usually generate more innovation output than their peer firms. Therefore, when considering the influence of peer pressure, it is necessary to discuss the impact of peer pressure on ESI in the context of firm size.
In the analysis of the impact of average peer pressure on ESI, columns (1)-(3) of Table 9 Panel A show that average peer pressure has a positive effect on ESI of small-sized firms, and this effect is significant at the 1% level. Columns (4)-(6) indicate that average peer pressure also has a positive effect on the ESI of large-sized firms, with significance at the 1% level. These results suggest that the positive impact of average peer pressure on ESI remains unchanged regardless of firm size. However, relatively speaking, the effect of average peer pressure on small-sized firms is more pronounced.
Firm Size Heterogeneity Test.

, and *** denote the 5%, and 1% significance levels, respectively.
In the analysis of the impact of maximum peer pressure on ESI, the coefficients in columns (1)-(6) in Panel B of Table 9 are all significant at the 1% level. The results show that maximum peer pressure has a positive effect on continuous innovation for both small and large firms, these findings indicate that maximum peer pressure positively promotes ESI in firms of different sizes, with the effect being relatively similar between both groups.
Network Embeddedness Heterogeneity
Existing research indicates that enterprises with a high degree of network embeddedness can better access innovative resources (Dong et al., 2023). To investigate the impact of peer pressure under different degrees of network embeddedness, we divide the sample into two groups: a low network embeddedness group and a high network embeddedness group. The boundary is determined by the median of the network embeddedness degree of the listed enterprises.
According to the findings presented in Panel A of Table 10, the beneficial impact of peer pressure (ANPP, ARPP, and AIPP) on ESI effects is apparent predominantly in high network embeddedness enterprises.
Network Embeddedness Heterogeneity Test.
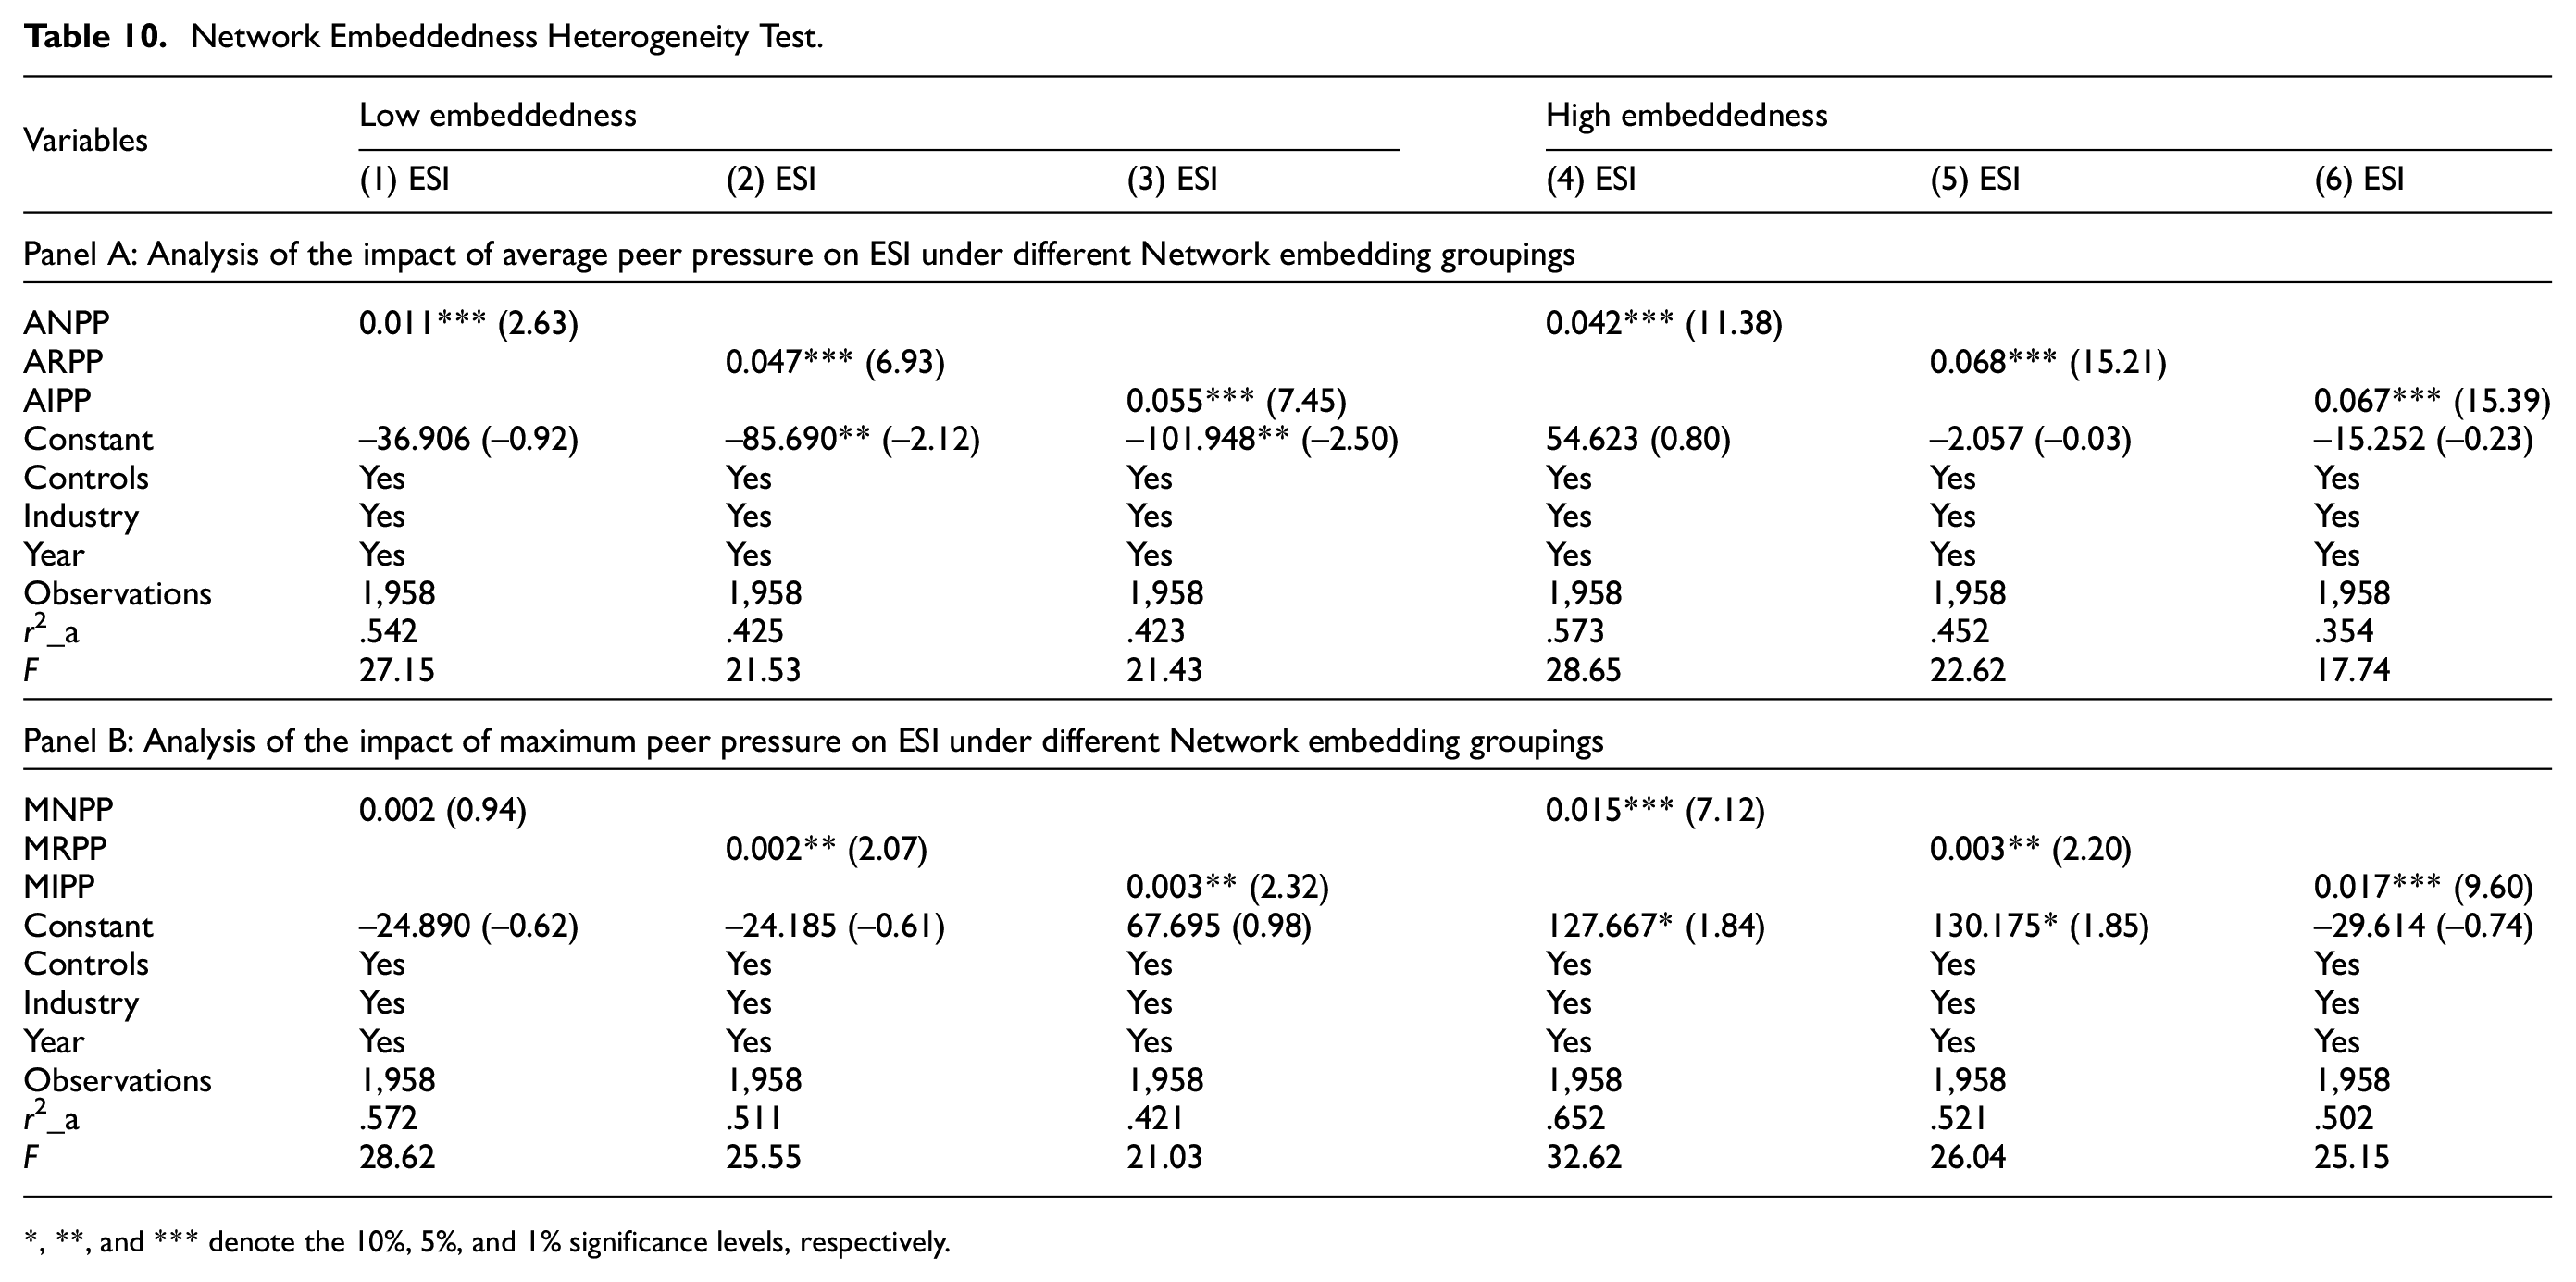
, **, and *** denote the 10%, 5%, and 1% significance levels, respectively.
According to columns (1)-(3) in Panel B of Table 10, when the degree of network embedding is low, the impact of MNPP on ESI is not significant. However, as shown in columns (4)-(6), when the level of network embedding is high, MNPP has a more significant impact on ESI. Additionally, the impact of MRPP on ESI does not vary substantially between the two groups. Firms with a higher degree of social network embedding tend to possess more extensive connections and engage in more frequent social interactions. Under such conditions, focal firms incur lower costs in acquiring and interpreting external information, enabling them to perceive and utilize information and experiences from other firms more clearly and accurately. Consequently, in the high-embedding group, MNPP has a more pronounced effect on ESI.
The Moderating Effect of Digital Transformation
Total Effect Analysis of Digital Transformation
The result of the moderating effect of DT is presented in Table 11, the regression results presented in columns (1)-(6) indicate that the coefficients for all peer pressure variables are significant at the 1% level. Specifically, the interaction term coefficients P × DT in columns (1), (2), (3), and (5) are significantly positive at the 1% level, while those in columns (4) and (6) are not statistically significant. These finds suggest that DT serves as a positive moderator in the relationship between peer pressure—specifically ANPP, MNPP, ARPP, and AIPP—and ESI, thus partially confirming H2. The moderating effect results show that a higher degree of DT within a firm significantly strengthens the positive influence of peer pressure on ESI.
The Moderating Effect of DT.

indicates significance at the 1% level.
Group Analysis of Moderating Effects
As the impact of peer pressure on ESI within the innovation-type grouping is primarily significant among leading firms, and the results for both sample groups in the firm size and network embedding groupings are significant. Therefore, this paper further explores the moderating effect of DT on enterprises with different enterprise sizes and network embedding.
The results of moderating effect regression based on firm size groups are presented in Panel A of Table 12. For the small-sized enterprise sample, the coefficients of the interaction terms P × DT in columns (2) and (3) indicate that DT does not play a significant moderating role in the effect of peer pressure on ESI. In contrast, for the large-sized enterprise sample, the coefficients of the interaction terms P × DT in columns (4)-(6) are .001, .001, .001, respectively, and are significant at the 1% level. These results demonstrate that DT significantly moderated the effect of peer pressure on ESI for large-sized enterprises.
Group Test of Moderating Effects.

, **, and *** denote the 10%, 5%, and 1% significance levels, respectively.
The moderating effect regression results based on network embedding groups are presented in Panel B of Table 12. For enterprises with low network embedding, the coefficients of the interaction terms P × DT in columns (2) and (3) are not statistically significant, indicating that DT does not significantly moderate the relationship between ARPP, AIPP, and ESI. Conversely, for enterprises with high network embeddedness, the coefficients of the interaction terms P × DT in columns (4)-(6) are .003, .002, .003, respectively, all of which are significant at the 1% level. These results suggests that DT play a significant moderating role in enhancing the impact of all three types of peer pressure on ESI in high-network-embedded enterprises.
Conclusions and Implications
Research Conclusions
This article constructs the multi-source peer pressure indicators (ANPP, MNPP, ARPP, MRPP, AIPP, and MIPP) based on the number of IPs, analyzes the influence mechanism of the peer pressure on ESI, and reveals the moderating role of DT. The study finds the following conclusions:
First, the peer pressure arising from the innovation quantity gap between focal firms and peer firms has a significant positive effect on ESI. The impact of average peer pressure on ESI is considerably stronger than that of maximum peer pressure. Moreover, both ARPP and AIPP have a more substantial influence on ESI compared to ANPP. Second, the effect of peer pressure on ESI shows heterogeneity across different groupings, including innovation type, enterprise size, and network embedding. Within the groups of leading and outstanding enterprises, ANPP exerts a relatively stronger effect on ESI. In contrast to large enterprises, the three types of average peer pressure have a more pronounced positive effect on small enterprises. Furthermore, when the degree of network embedding is high, the impact of ANPP on ESI is more significant. Third, in the context of peer pressure’s influence on ESI, DT plays a positive moderating role. In the sample groups of large enterprises and high network embedding, DT exerts a more pronounced moderating effect on the relationship between average peer pressure and ESI.
Theoretical Contributions
This study provides an in-depth exploration of the mechanism through which peer pressure influences ESI, with two main theoretical contributions:
First, this research enriches the existing literature on peer effects by integrating peer effects with pressure interaction theory. While previous studies have predominantly focused on regional and industry-based peer groups, they have often overlooked the network relationships among enterprises and inadequately examined the pressure mechanisms arising from these peer effects. By incorporating network peer relationships and pressure interaction theory, this study constructs three distinct types of peer pressure indicators, thereby broadening the analytical framework of innovation peer effects. Previous research has shown that excessive pressure can hinder enterprise innovation (Y. Liu et al., 2025). Furthermore, the findings of this study reveal that peer pressure can act as a catalyst for ESI when the innovation gap is within an attainable range. In contrast, when the gap becomes excessively wide, the effectiveness of peer pressure in driving ESI is substantially weakened.
Second, this study reveals the moderating role of DT in the relationship between peer pressure and ESI, thereby expanding the theoretical understanding of DT. While existing research on DT has primarily focused on its impact on enterprise development, this study delves into its moderating effect. In contrast to previous studies on the peer effects of DT (X. Zhang & Du, 2023), this research highlights how DT moderates the influence of peer pressure on ESI. Previous studies have shown that enterprises with high social network embedding are more likely to select appropriate reference points in the process of formulating and implementing DT strategies, thus reducing decision-making errors (Dong et al., 2023). This study further explores the mechanisms behind this phenomenon. Through a subgroup analysis of DT, the findings reveal that, for firms with high network embedding and large size, DT is more likely to foster peer pressure into a driving force for ESI.
This study offers theoretical and methodological foundations for exploring multi-source peer pressure and corporate sustainable innovation. Researchers may build on its framework to analyze peer pressure variations across industries or integrate it with theories such as the resource-based view. For practitioners, the findings provide actionable insights for innovation strategy development, including implementing peer pressure monitoring mechanisms and fostering peer collaboration to boost innovation efficiency. Policymakers can leverage this research to design targeted industrial policies, utilizing the proposed analytical approach to evaluate policy impacts and refine measures that support sustainable innovation and socioeconomic growth.
Managerial Implications
Based on the research results, the following countermeasures, suggestions and future prospects are proposed:
At the enterprise level, peer pressure serves as a significant driver of ESI. Enterprises should enhance their ability to respond to peer pressure from networks, regions, and industries. For enterprises of the follower type and ordinary type, it is crucial to intensify R&D efforts to narrow the innovation gap with their peers. Leading and outstanding enterprises should maintain their pioneering roles, fostering positive innovation peer effects through the catch-up efforts of other enterprises. Small-sized enterprises should focus on enhancing their ability to cope with pressure, while large-sized enterprises can improve their continuous innovation capabilities through DT. Enterprises with high network embeddedness should strengthen inter-firm connections and enhance the level of DT.
At the government level, the impact of peer pressure on ESI reflects both “close behind” and “far beyond reach” effects. Policymakers should amplify the positive effects of peer pressure when the gap is “within reach” and mitigate the negative consequences when the gap is “too far beyond reach.” Efforts should be focused on harnessing the role model effect of leading and outstanding enterprises while increasing policy support for ordinary and follower type firms. For large-sized enterprises, the government should encourage greater investment in DT, while for small-sized enterprises, the emphasis should be on boosting innovation investment. Furthermore, support should be extended to high network-embedded enterprises, enabling them to enhance their continuous innovation capabilities through increased innovation investment and promotion of DT.
This paper has some research limitations. First, there is a lack of discussion from an industry perspective. The research subjects of this paper only focus on manufacturing enterprises. In reality, listed companies in different industries exhibit significant differences in business strategies, production models, and development concepts. Peer pressure in different industries may have vastly different effects on ESI performance, making it necessary to conduct a more in-depth exploration based on the industry characteristics of listed companies. Additionally, this research is primarily a quantitative empirical study based on Chinese samples, lacking qualitative case studies and comparative research. Subsequent research can select typical cases from Chinese and overseas for comparison, summarize the advanced experience from developed economies in improving innovation performance, and make adjustments in light of China’s national conditions. Finally, this study solely relies on secondary data from the CSMAR and INNOJOY databases. In the future, it is necessary to further verify whether similar conclusions can be drawn using other data sources.
Footnotes
Acknowledgements
Thanks to the Soft Science Researsh Program in Shaanxi Province of China; and Xi’an Science and Technology Plan Project for funding.
Ethical Considerations
This study was approved by the Ethics Committee of Xi’an Polytechnic University and all methods were performed in accordance with the relevant guidelines and regulations and informed consent was waived.
Funding
The authors disclosed receipt of the following financial support for the research, authorship, and/or publication of this article: The Project Supported by Soft Science Research Program in Shaanxi Province of China (No. 2023-CX-RKX-060); Xi’an Science and Technology Plan Project (No. 2023JH-RKXYB-0162).
Declaration of Conflicting Interests
The authors declared no potential conflicts of interest with respect to the research, authorship, and/or publication of this article.
Data Availability Statement
The data are available from the corresponding author on reasonable request.