
Abstract
This paper is to explore the association between environmental, social, and governance (ESG) dimensions and corporate innovative activities. Given that existing literature in the relationship between ESG and firm performance to date offers no clearly consistent empirical results and large-scale sample studies based on global companies remain scarce, this paper aims to offer a fresh and noteworthy insight about relationship between the ESG and innovation in recent times when ESG has been considered as important tenets of management because of the ESG’s enormous significance for corporate solid performance and sound development of capital markets. To test the hypotheses derived from the theoretical reasoning, this paper selected ESG indicators and financial data of global companies from 1999 to 2009 based on the relationship between ESG activities and corporate innovation, and the effects on corporate innovative product development performance are analyzed according to detailed ESG activities by logistic regression analysis. The study found that positive environmental and social activities appear to enhance innovation outputs by firms in various industries. These results indicate that the firms challenged by environmental issues respond with assertive innovative activities and the firms’ efforts to stimulate certain types of social activities are reflected in a higher level of innovation. Supporting the complex relationship between ESG activities and corporate innovation performance, the findings will help firms’ decision-makers, stakeholders, as well as academics, to improve their awareness of the impact of ESG activities on the innovation performance of the firm, both as a comprehensive factor and individually by pillar.
Plain Language Summary
The main purpose of this paper is to explore the association between environmental, social, and governance (ESG) dimensions and corporate innovative activities empirically using international data with a detailed literature review expounding the theoretical reasoning inherent between the two constructs. Using ESG information compiled by MSCI ESG KLD STATS, this paper selected ESG indicators and financial data of global companies from 1999 to 2009 based on the relationship between ESG activities and corporate innovation, and the effects on corporate innovative product development performance are analyzed according to detailed ESG activities by logistic regression analysis. We find that positive environmental activities appear to enhance innovation outputs by firms in various industries. This indicates that when firms are challenged by environmental issues and respond with positive activities to meet the challenges, these efforts are reflected in the form of increased capabilities to develop innovation competencies and new products. On the other hand, the results of analysis pertaining to the impact of corporate governance activities on innovation are interesting and slightly confounding. Findings on governance negative indicators, including “governance structure issues” and “controversial investments” are shown to be strongly positively associated with corporate innovation. Supporting the complex relationship between ESG activities and corporate innovation performance, the findings of study will help firms’ decision-makers, stakeholders, as well as academics, to improve their awareness of the impact of ESG activities on the innovation performance of the firm, both as a comprehensive factor and individually by pillar.
Introduction
Environment, social, and governance (ESG) criteria have gained considerable importance as means to influence a company’s capability to generate value. Referring to the integration of non-financial factors within a broad range of environmental, social, and corporate governance factors, ESG values are becoming a tenet of corporate strategies and decision-making processes (Yu et al., 2018). Today’s company managers and financial practitioners, including institutional investors, believe that a company’s efforts to make management more transparent, responsible, and accountable—both internally and to society—will, together with effective operation, profoundly impact the company’s value. While ESG elements are definitionally non-financial, they have powerful financial implications insofar as they are linked to corporate competitiveness and profitability (S&P Global, 2019). According to Bloomberg Intelligence, it is estimated that global ESG-related assets are expected to exceed $53 trillion by 2025, representing more than 30% of total assets under management. Given the need to mitigate the vulnerability caused by COVID-19 pandemic and sort out post-pandemic crises management (Dheer & Salamzadeh, 2022) and identify the impact of complexities on the performance and recovery (Pereira et al., 2021) worldwide, ESG criteria may help in analyzing a new set of financial risks in capital markets (Bloomberg Intelligence, 2021). With the growing interest in ESG investing, many market participants are seeking to explore the degree to which ESG credentials can affect financial performance both in terms of corporate earnings and investment returns.
Environment, social, and governance factors provide valuable insights into current and future corporate risks and opportunities and, in turn, have the potential to result in direct or indirect financial impacts on companies’ profits and investment returns. A number of studies have tried to dig into the link between ESG and financial performance. Results have been mixed on the relationship between ESG and financial performance. A significant amount of research finds a positive relationship between ESG and financial performance—up to approximately 90% of empirical results report this positive relationship according to the work of Friede et al. (2015). Other research, however, finds a negative relationship or no relationship between ESG and corporate financial performance (e.g., Duque-Grisales & Aguilera-Caracuel, 2021; Paolone et al., 2022). In studies affirming a positive relationship, researchers have attempted to figure out what induces this favorable association between ESG and firm performance. The reduction of information asymmetry and adverse selection between investors and companies and/or the improvement of brand image and other customer-facing dimensions can act as intermediary paths that link ESG with financial performance (Cheng et al., 2014; Ioannou & Serafeim, 2015; Lee & Kim, 2016).
Nevertheless, research that analyzes the mediating or moderating factors driving better corporate performance is limited. The current research looks closely at these intermediary factors that may lead to improved corporate performance. In this paper, we explore the possibility that companies’ ESG activities can be a conduit to innovation performance (assuming that innovation itself catalyzes better financial performance, which is another research question worthy of investigation). A company’s efforts to improve ESG may enhance its innovative capacity, causing the company to end up with a higher level of innovation performance and better innovation outputs. In turn, this improved innovation capability may or may not result in the company’s better financial performance. When a company endeavors to innovate in line with ESG engagement, however, it seems obvious that these efforts will create the potential for higher financial performance to be realized in the long term. Our research agenda on whether firms’ levels of engagement with ESG are linked to their innovation is relatively less explored in the existing literature than frameworks that attempt to establish links between ESG and firm performance. The freshness of this approach alone makes our research worthy of investigation.
What is the nature of the relationship between ESG and innovation? The work of Brogi and Lagasio (2019) holds the view that each of ESG and innovation require significant capital investment, thus generating cannibalization effects by the occupation of one another’s resources and implying that ESG and innovation incur substitutive strategic decisions for firm value. We assume that ESG and innovation are complementary, and that they thereby mutually reinforce all the benefits derived from both priorities. In this sense, ESG and innovation are more likely to enhance firm value in the long term (McWilliams & Siegel, 2000), while the short-term effects may not be clear. When ESG and innovation complement each other in enhancing firm value, companies have a motive to increase ESG to stimulate innovative activities. Furthermore, we expect that increased efforts to improve ESG can induce more capital influx, which will, in turn, be channeled to innovation activities requiring huge levels of research and development (R&D) investment in different managerial areas relating to ESG. Prioritizing ESG can have effects of developing new products, improving brand image, and ameliorating information asymmetry between companies and investors. Consequently, companies can enjoy more cash flow from institutional investors and have room to spend the increased capital for innovation and R&D. We argue that innovation is a worthwhile intermediary link, and we herein attempt to examine in-depth empirical evidence of whether adherence to ESG criteria induces high levels of innovation.
In this paper, we aim to explore the relationship between ESG and innovation, in particular, attempting to find the impact of companies’ involvement with respective E, S, and G dimension on firm innovation. To do this, we set out the theoretical framework by reviewing the previous literature on the relationship between the two constructs and expounding our theoretical reasoning on the likely positive relationship in which the companies’ increased engagements with E, S, and G lead to higher level of innovation. Following the detailed discussion, we propose testable hypotheses. For empirical analysis, we focus on the period of time from 1999 to 2009 when ESG values were taking on greater importance between the dot-com bubble and global financial crisis. For analysis, we use the MSCI ESG KLD STATS database (a set of acronyms to signify organizations with information pertaining to a capitalization weighted index indicating companies with outstanding ESG ratings) wherein ESG and innovation data were compiled consistently throughout the time period across firms worldwide.
In comparison to previous literature that generally dealt with the relationship between ESG and financial performance such as profitability and market performance (e.g., in Sage Open journal, all the related papers analyzed the effect of ESG and sustainability on the financial performance as in Qureshi et al. [2021] and Hongming et al. [2020]), our research turns our attention to the link between ESG and more specific performance indicator, firm innovation, which was rarely analyzed in the previous research work. Our research provides a well-structured theoretical foundation to develop the research hypotheses and examine the postulated relationship between the two variables using a comprehensive dataset complied in a global setting. In this way, our research not only fills a missing link in the ESG analysis but also enriches the ESG literature, which is one of the main contributions to the research field. This paper is organized as follows. Beyond the introduction, Section “Theoretical Foundation of the Relationship Between ESG and Innovation” accounts for theoretical perspectives on the association of ESG and corporate innovation in full detail. Section “Empirical Setting” describes research methods in relation to econometric specifications and data sources. Empirical results are presented in Sections “Empirical Results” and “Conclusions” summarize our findings, implications, and limitations.
Theoretical Foundation of the Relationship Between ESG and Innovation
In this section, we provide the theoretical accounts of the relationship between ESG and innovation in detail and expound our reasonings that establish likely positive associations between each ESG dimension and corporate innovative activities. On the basis of comprehensive review on the related literature, we posit that a company is more likely to increase innovative activities when it engages in ESG activities, due to a variety of antecedent factors, for example, its heightened efforts to comply with environmental regulation (Broadstock et al., 2020), promote social activities consistent with stakeholders’ behaviors (Boffo & Patalano, 2020) and improve its governance structure for decision-making (Asensio-López et al., 2019). Following our detailed discussion, we derive testable hypotheses for empirical analysis.
The E (Environmental) Dimension and Corporate Innovation
Activities in the “E” dimension of ESG are associated with a company’s efforts to render its business model and production processes more environmentally friendly. By increasing investments to improve environmental supervision and comply with environmental regulations, a company’s overall rating in the environmental dimension increases. This helps a company acquire or gain access to more capital among institutional investors who find that information asymmetry and adverse selection concerns caused by the company are mitigated (Hughes et al., 2021). Environmental regulations and a company’s innovative capacity are closely interlinked (Broadstock et al., 2020). A couple of studies have found evidence that environmental compliance expenditures increased R&D investment (Jaffe & Palmer, 1997; McWilliams & Siegel, 2000). Fully endeavoring to promote environment-friendly business practices can improve a company’s capability to innovate (Porter & van der Linde, 1995). Porter (1991) states, in his so-called Porter’s Hypothesis, that a company’s consistent compliance with strict environmental regulations can promote innovation that generates efficiencies in production processes and induces improvement in competitiveness. This hypothesis suggests that an active response to environmental regulations can lead to greater innovation effects by triggering the discovery and introduction of clean technologies. Furthermore, the cost savings following corporate innovation activities are more than enough to compensate for expenditures on compliance with environmental regulations. Companies can experience the first-mover advantage by adapting to environmental regulations ahead of other companies, exploiting innovation by falling back on the concept of the “learning curve” and obtaining patents for technologies used for innovation.
A company’s engagement in environment-compliant activities can lead to a positive relationship with their performance through the implementation of innovation-related processes (Hull & Rothenberg, 2008). Firms involved with these activities are more likely to be innovative in improving processes to meet the needs of pertinent stakeholders. These activities are reflected in firms’ efforts to improve stakeholder-related innovation capacities. In this way, activities for environmental compliance can be useful in launching “exploitative” innovation that aims expressly for improvements, refinements, and cost reduction for firms. Companies endeavor to adopt environmentally friendly production processes by way of efficiency-seeking innovation.
Thus, environmental compliance emerges as a source of enhancement for competitive advantage insofar as investments in environmental compliance are related to firms’ efforts to refine their business models or differentiate from competitors (Porter, 1991; Porter & Kramer, 2011; Saeidi et al., 2015). The work of Reinhardt (1998) states that environmental differentiation exists when a business creates products that offer greater environmental benefits or impose smaller environmental costs than similar products. Companies with an environmental differentiation advantage are able to charge higher premium prices and gain greater market share. Consumers who prioritize environmental issues are willing to pay more for products with more environmental value. Companies with greater environmental differentiation advantages provide legitimate information about environmental product attributes, protect their innovative products from imitators, and gain the confidence of customers by earning and retaining customers’ trust in these environmentally differentiated products.
Companies with high levels of innovation view environmental regulations as new opportunities rather than as constraints. Porter and van der Linde (1995) state that innovation undertaken by firms that follow environmental strategies leads to competitive advantages by achieving new innovations. Companies that are more proactive in terms of their environmental strategies align more resources with these new opportunities and thereby seek out competitive advantages (Yang et al., 2019). When companies attempt to enhance competitive advantage by pursuing differentiation strategies with environmentally augmented products and services, they increase investment in innovation. As a result of this, they obtain physical (or non-physical) innovation outputs.
Environmental compliance activities help companies identify strategic opportunities and effectively respond to challenges posed by stakeholders in the process of continually assessing their relationships with each stakeholder (Costa & Pesci, 2016; Herrera, 2015). Ongoing information exchanges via the provision of feedback from stakeholders help companies find new ideas about innovation; investment in ESG made with stakeholder evaluation (particularly some specific types of stakeholders, such as consumers and competitors) can be critical for successful innovation and achieving competitive advantage. Environmental compliance activities can have a positive impact on “exploratory” innovation (the creation of new products or services and new markets or the offering of innovative designs and creative ways to satisfy customer and market needs) (Costa & Pesci, 2016). Firms may be able to develop innovation competencies that are new to them in being continuously challenged by environmental issues and in responding appropriately to these challenges. A company’s technological innovation is influenced by its continuing concerns to improve internal structures and processes creating sustainability (Salamzadeh et al., 2022; Zhang et al., 2019). These competencies are reflected in the form of capabilities to develop new products. Whether environmental compliance significantly promotes technological innovation directly with linear or non-linear effects is another question to be answered (Liu et al., 2021). Nevertheless, we anticipate that improvement in environmental regulation compliance will ultimately cause more innovation activities and better performance.
Within this discussion, we propose the following hypothesis.
Hypothesis 1: As a company’s increased efforts to comply with environmental (E) issues open up new opportunities to refine products and related processes, its more engagement in environmental (E) dimension will have a positive impact on corporate innovation.
The S (Social) Dimension and Corporate Innovation
The main tenets of the social dimension in ESG issues are constituted by the relationships of a company with its workforce, the societies in which it operates, and the political environment. While environmental and governance dimensions are respectively concerned with a company’s effects on nature and its internal decision-making processes and the political context within which the company operates, the social dimension mainly deals with the relationships between a company and the people or institutions outside of the company. The social dimension entails how businesses treat key stakeholders—namely, consumers, employees, suppliers, and communities. Businesses with strong social aspects build trusting relationships with stakeholders, benefiting these companies’ growth and expansion on stable ground (Miralles-Quirós et al., 2019; Van Duuren et al., 2016). Active interaction with and in-depth understanding of key stakeholders require social qualification. Socially embedded activities require companies to maintain long-term consideration of sustainable business models and encourage their initiation of projects on innovation in the process of building growth opportunities with stakeholders.
Effective involvement with consumers keeps companies upto-date with marketable ideas and social trends, which makes it possible for companies to stimulate innovations internally by the introduction of new products and the implementation of related marketing strategies (Preston, 2016). Connecting with consumers via familiar, cause-related marketing campaigns is useful for companies to establish relationships with customers and build trust in new products (Singh & Duque, 2019). With mounting international pressure to guarantee human rights and ensure sound labor relations, companies are required to invest in the infrastructure of production to ensure safe and fair working environments by way of innovation in this area (Min et al., 2019). Companies that align their businesses with decent work practices exhibit readiness to embrace regulations adapted for international partnerships in innovative ways (United Nations, 2015). Companies attempt to establish good working conditions to recruit and maintain talented and qualified employees by providing positive signals about job environments to job-seeking candidates and current employees, bearing in mind that human resources (HR) policies are strongly anchored in external social recognition of employer brands (Sloggett & Reinboth, 2017). Aspects of employee engagement and retention constitute a crucial social dimension in the area of human capital management. Additionally, it is necessary for companies to devise and upgrade software to track performance and promote efficiencies by introducing innovative measures in the management of workplace health and safety (McFeely, 2019). Companies will adopt useful tools to renovate performance indicators (including productivity levels, hiring and training costs, knowledge transfer difficulties, workplace safety, and branding threats generated by employers) in communication processes with employees. In this way, companies become equipped with a social license to operate (Mercer-Mapstone et al., 2017).
Social dimension activities are intended to improve fairness in employee payment and workplace policies regarding diversity, inclusion, and prevention of discrimination, employee training and education programs, and employee engagement with management (Boffo & Patalano, 2020). Employee diversity is advantageous for firm innovation insofar as diversity in employees broadens the search space and makes a company more creative and open to new ideas. Diversity in ethnic, gender, educational, and cultural backgrounds among employees can expand a company’s knowledge base. Diversified personnel can increase interactions and communication between different types of competencies and skills and strengthen capacity for knowledge accumulation. Innovation is an interactive process that often involves communication and interaction among employees in a firm (Østergaard et al., 2011). Hewlett et al. (2013) find that companies encouraging inherent diversity involving traits people identify with such as gender, ethnicity, and sexual orientation and acquired diversity which people gain from experience such as the appreciation of cultural differences tend to out-innovate companies that do not.
Companies that promote practices related to the social dimension of ESG will yield more product, process, and organizational innovations. Firms’ increasing involvement in these activities can positively affect the adoption of organizational changes—which themselves are a type of innovation. Companies must overcome their structural problems by establishing a culture of innovation and improving innovation capabilities in order to develop new products and shepherd significant changes in advancing technologies. Organizational innovation is an antecedent to product and process innovation and includes the implementation of new methods in workplace routines and procedures, in the distribution of responsibilities among employees, and in the structure of stakeholder relations (Boffo & Patalano, 2020). This indicates that certain social dimension activities can initiate changes in organizational processes and structures to promote higher work ethic and spirit among employees in organizations, thereby enabling significantly higher levels of product and process innovation.
Based on this discussion, the following hypothesis is proposed.
Hypothesis 2: As a company’s attempts to improve its overall relationship with the stakeholders promote a more favorable condition for business, the engagement in social (S) dimension by a company will have a positive impact on firm innovation.
The G (Governance) Dimension and Corporate Innovation
Governance refers to the processes by which decision-making is implemented. When companies are structured with good corporate governance systems, they are able to manage mechanisms inherent in decision-making processes effectively and produce sustainable long-term economic value for both shareholders and stakeholders. The work of Nordberg (2018) asserts that good corporate governance aims to ensure the principles of transparency, accountability, responsibility, independence, and fairness and equality. Financial markets look for well-functioning governance systems wherein companies utilize accurate and transparent accounting methods and stockholders are allowed to vote on important issues. Additional positive signals are companies that avoid conflicts of interest in their selection of board members, companies that do not use political contributions to obtain favorable treatment, and companies that do not engage in illegal practices (Anson et al., 2004). Furthermore, governance-focused choices that embrace diversity among board members and the CEO independent of the board chair are other good tactics to improve the governance dimension in ESG (Bebchuk et al., 2009; Gompers et al., 2003).
Our overall expectation on the relationship between governance and innovation is that companies are more likely to engage in innovation activities as their governance dimension improves. A company that has a sound business model and allocates capital to the most profitable opportunities with a transparent and accountable governance structure is expected to make more active investments in innovation and R&D to maintain its competitive advantage and long-term survival in the market than a company without these characteristics (Friedman, 1970). In particular, the improvement of board composition together with the enhancement of diversity in governance have been found to make positive impacts on firm innovation (Asensio-López et al., 2019). The relationship between board diversity and innovation can be highlighted in terms of the board’s role in aligning interests between shareholders and managers. Indeed, a diverse board is useful for monitoring and controlling management according to the need to balance priorities among diverse characteristics (Yoo & Sung, 2015). A diverse board of directors is essential for bringing together resources, strategic advice, knowledge, and networking to benefit the company from varied sources (Hillman et al., 2000; Pfeffer, 1972).
From this perspective, many studies have investigated the impact of board heterogeneity and diversity on firm strategy and performance. Board diversity can be defined as variety in the composition of a board of directors with regard to features such as gender, age, nationality, and educational/work backgrounds. It has been pointed out that diversity in board directorship offers several benefits to firms, including higher creativity, better understanding of the industry, and more effective problem-solving capabilities (Goodstein et al., 1994). The various perspectives provided by a diverse board of directors can generate a wider range of solutions for strategic decisions (Eisenhardt & Bourgeois, 1988). The incorporation of diverse stakeholders into a board makes it possible for a company to access critical resources (Pfeffer & Salancik, 1978). Board diversity enables a board of directors to be more sensitive to employer shared responsibility (ESR) initiatives and to help a company better deal with meeting ESG criteria (Bear et al., 2010). Board diversity is expected to contribute to innovation activities more favorably (Miller & Triana, 2009). Diversity among board members provides firms with divergent human and social capital to come up with ideas and discover new business opportunities, thereby increasing innovation (Zahra & Garvis, 2000). Thus, diversity in board directorship is a crucial factor in support of firm innovation activities.
We must also deconstruct the practical challenges of good corporate governance across any collection of board members, managers, and stakeholders in today’s competitive global environment. Diversity in board directorship may generate coordination difficulties between board members who may be vulnerable to conflicts and misunderstandings (Huse et al., 2009). Diverse board members may need more time for discussion and may lack a cohesive spirit (Goodstein et al., 1994). Considerable effort may be needed for diverse board members to reach consensus on risky projects that require a company to spend capital for innovation. Internal directors who have been assigned roles by shareholders (some main examples being circumstances of concentrated ownership generally not in favor of board diversity) may be more likely to adopt new strategies for innovation due to long-standing similarities in their awareness of products and markets (Hoskisson et al., 2002). Internal senior executives may be more prepared to invest in risky R&D projects if they are well represented on boards because they are less dependent on the opinions and evaluations of external directors (Baysinger et al., 1991). Divergent board members may focus on disciplining certain strategic decisions made by main shareholders, thus causing them to become cautious and unwilling to accept uncertainties in risky innovation projects (Yoo & Sung, 2015). External board members are not able to access all the available information for strategic decisions, and thus tend not to agree on risky projects about which they are not fully informed (Lorsch & Young, 1990). All things considered, we state that, while improvement in the governance dimension of ESG (especially in terms of board composition) must be acknowledged as a positive signal and that its contribution to innovation is favorable, more investigation into the relationship between corporate governance and innovation is needed when we unpack the complexities of decision-making.
With this discussion, we propose the following hypothesis.
Hypothesis 3: As a company’s increased endeavor to improve governance structure leads to a better decision-making on resources allocation for business opportunities, the engagement in governance (G) dimension by a company will have a positive impact on firm innovation.
Empirical Setting
Sample Construction and Data Sources
Our empirical analysis centers on the effects of ESG activities, specifically with regard to firms’ innovation performance. The following databases were used for analysis: (i) MSCI ESG KLD STATS, which provides an annual dataset of environmental, social, and governance (ESG) performance indicators applied to a universe of publicly traded companies and (ii) Wharton Research Data Services (WRDS), which provides financial statement data.
First, we used a panel dataset where ESG ratings were obtained from the MSCI ESG KLD STATS database. A statistical tool for analyzing trends in social and environmental performance, KLD STATS began registering ESG ratings in 1991 and stopped in December of 2017, yielding one of the longest continuous ESG data time series available. The KLD database shows binary values of 0 and 1 for strengths and weaknesses in seven categories and six controversy scores for more than 3,000 companies (Geczy & John, 2021). Today, the KLD STATS database has been integrated with Morgan Stanley Capital International (MSCI) to make available the world’s largest ESG-related information objectives, comparisons, and auditable databases.
Finally, we obtained firm-level financial data from the WRDS database by company code. Observations with missing data for dependent or independent variables were removed. Our final sample consists of a panel of 14,347 firm-year observations for the period of 1999 to 2009 from companies worldwide.
Variables
Dependent Variable
The dependent variable established in this paper is the innovation performance of a firm. It is hard to measure processes that incorporate innovation. Many studies have focused on measuring innovation inputs and outputs in terms of factors such as spending, licenses, patents, number of new products, and R&D expenditure. Research and development is used extensively as a proxy for innovation, insofar as R&D improves firms’ capabilities to develop new products and processes and improve existing ones.
In this paper, we employ the term Innovation, which is defined as any company that is an R&D leader in its industry, specifically measured with the bringing of explicitly innovative products to market. The term Innovation is obtained from MSCI ESG KLD STATS as a dummy variable. It is widely used as a measure of corporate innovation in existing literature, including studies by Thornhill (2006), Girotra et al. (2007), Yang et al. (2019), and Naranjo-Valencia, et al. (2016).
Due to the unbalanced nature of the dependent variable, we have performed down-sampling on 1,000 observations of the dependent variable. The accuracy of the data before down-sampling is 0.9843, while it decreases to 0.8992 after down-sampling. Since, there is no significant change in accuracy even with down-sampling indicates that this data is suitable for this study, and therefore we can conclude that we achieve more accurate predictions using the raw data. Moreover, various methodologies exist to address the unbalanced nature of the dependent variable. However, our choice of logistic regression was driven by our emphasis on interpretation. We aimed to derive meaningful insights from the logistic model we constructed (Figure 1).

The histogram of before and after down-sampling. This result was performed using R.
Independent Variable
The independent variables herein are ESG activities. The MSCI ESG KLD STATS database is composed of environmental, social, and governance indicators that are collected by analysts at geographic levels from academic, government, non-governmental organization (NGO) datasets, company disclosures, proxy reports, and other stakeholder sources, as well as from news reports of all major providers (see MSCI’s data collection and rating methodology). Each annual dataset contains company information and a set of indicators assessing positive and negative ESG performance (i.e., environmental, social, and corporate governance indexes). Among the ESG information, each ESG indicator is classified as positive or negative, and applied either as a “strength” or “concern” to variable names. “Number of Strengths” and “Number of Concerns” are terminology directly provided by MSCI ESG KLD STATS, and simply represent the sum of “strengths” and “concerns” for each variable. For example, environmental indicators are divided into positive and negative indicators and labeled with “strength” and “concern” in the variable names. The positive (negative) environmental performance indicators are denoted by “ENV-str (ENV-con)” according to MSCI ESG KLD STATS datasets (see Appendix A). In most previous studies, the total value of each positive and negative indicator has been used as the “Number of Strengths” and the “Number of Concerns.”
The problem with total value, however, is that missing data are included when evaluation is omitted for a specific field. That is, when an indicator value receives 0 points or the evaluation is omitted, all of them are equally calculated as 0 points. In the case of analysis herein, this causes a limitation in that the parameter cannot be accurately estimated due to missing data in the statistical model. Therefore, to compensate for these limitations, this study uses the average value of “strengths” and “concerns” instead of “Number of Strengths” and “Number of Concerns.” The advantage of using the average value is that only areas in which companies’ have received scores are divided by the number—a tactic which, in effect, completely reflects the results of a company’s actual evaluation. That is, because missing data are not reflected, a research model can be formed statistically more accurately and elaborately.
We established the sample mean of ESG indicators to more accurately estimate parameters by setting them as statistics. This distinguishes our study from comparable previous studies.
From the indicators, we set variables as “EnvPos,”“SocPos,” and “GovPos,” which represent the average value of positive indicators in each area of environmental, social, and governance factors. “EnvNeg,”“SocNeg,” and “GovPos” represent the average value of negative indicators in each area. First, we set the environmental activity variables of environmental indicators as an average value of the “strength” and “concern” components. Definitions of environmental indicators are as follows.


Second, social indicators consisting of community, human rights, employee relations, and diversity aspects of ESG are established. Each part is classified into positive and negative activities for the social dimension of ESG, and are applied either as a “strength” or “concern” to variable names. The positive (negative) social performance indicators are denoted by “SOC-str (SOC-con)” from the MSCI ESG KLD STATS datasets. From this, the variables in the social indicators are set as an average value of the “strength” and “concern” parts of the whole. Definitions of social indicators are as follows.

where N is the total number of “(COM + HUM + EMP + DIV)-str” indicators

where N is the total number of “(COM + HUM + EMP + DIV)-con” indicators
Third, governance indicators are classified into positive and negative indicators, and are applied either as a “strength” or “concern” to variable names. The positive (negative) governance performance indicators are denoted by “CGOV-str (CGOV-con)” from the MSCI ESG KLD STATS datasets. From this, we set the variables of governance indicators as an average value of the “strength” and “concern” components. Definitions of governance indicators are as follows.


Control Variables
Finally, we control for the differential effects of firm-level characteristics on innovation activities by including firm size (total revenue), return on assets (ROA), leverage, R&D intensity (R&D/total assets), and industry. Regarding the relationship between firm size and innovation, previous research has focused on the positive impact of firm size on R&D expenditures. In other words, the tendency of a firm to invest in R&D has been shown to be positively correlated with its size (Dosi, 1988). Therefore, it is expected that the relationship between size and innovation is positive and significant. To control firm size effects, we used the natural logarithm of total revenue to reduce variability, in line with major studies on the subject. Regarding the relationship between profitability and innovation, we can assume that companies with high levels of profitability have more financial resources with which to invest in innovation activities. We measure firm profitability as ROA, equal to the ratio of net income to total assets. In particular, the ratio of assets to liabilities affects a firm’s opportunities to increase innovation activities (Bhagat & Welch, 1995). Starting from this point of view, we consider the relationship between innovation and financial resources. Leverage is the ratio of the book value of debt to the book value of total assets. In addition, R&D expenditures and a firm’s financial resources have positive and significant correlations. It is natural to expect that R&D expenditures will be relatively large due to the influences of firm size and industry, however, and to assume that economies of scale will be operated as R&D expenses. To control this, we use R&D intensity—calculated by dividing R&D expenditures by total assets—thereby accounting for industry-level effects. More detailed explanations of the variables are provided in Table 1.
Definitions of Variables.

Model Design
A logistic regression model is used to analyze whether a firm’s innovation performance is influenced by ESG activities, with the specific model design shown in Formula (7). In the formula, corporation innovation is used to indicate the innovation performance of the company in the t period, and ESG activity indicators are rated for the company at the end of the t period. To maintain consistency across all indicator periods, we used corporate innovation and ESG indicators data from the end-of-year data. We include year-level, and industry-level fixed effects in all specifications with robust standard errors described in a study by White (1980).
The logistic regression model is as follows.

In the second step, we conducted the likelihood-ratio test to verify nested model is superior to full model which results in rejecting the null hypothesis. Furthermore, the
Empirical Results
Descriptive Statistical Analysis
Table 2 reports the descriptive statistics of the key variables used in our empirical tests. Innovation is obtained from MSCI ESG KLD STATS as a dummy variable. The mean (median) value of Innovation is zero (zero). The minimum is 0, and the maximum is 1. Only 327 companies of 14,347 companies have an innovative product or service in their market, and the standard deviation is 0.128. In addition, Table 2 shows that the mean value of environmental positive activities is 0.016, not more outstanding than the mean value of social positive activities (0.031) and the mean value of governance positive activities (0.045). The standard deviation of the mean value of ESG indicators is seen in Table 2 to be between 0.054 and 0.169; the median is 0, the highest mean is 0.107 (GovNeg), and the lowest value is 0.016 (EnvPos). Also, the mean value of governance negative activities is 0.107, which is high in comparison to other ESG indicators. This may be due mainly to the fact that governance activities of a company pertain to the decision-makings issues of management, wherein relevant governance regulatory requirements and information disclosure vary widely. The mean (median) values of size and ROA are 2.786 (2.780) and 0.003 (0.002), respectively. The mean (median) values of leverage and R&D intensity are 0.054 (0.015) and 0.007 (0.000), respectively. Standard deviations of the mean values are 0.751 and 0.014. The mean (median) values of leverage and R&D intensity are 0.054 (0.015) and 0.007 (0.000), respectively. Standard deviations of the mean values are 0.121 and 0.026. All continuous variables are winsorized at the 1% and 99% levels to consider potential outlier problems or data errors. The distribution of other related variables is also within a reasonable range.
Descriptive Statistics.

Note. This table reports mean, median, standard deviation, first quartile, and third quartile values for each variable used in our empirical tests.
Multivariate Analysis
To examine relationships between corporate innovation and ESG activities in Models 1 to 3, we use logistic regression with corporate innovation for each dimension (environmental, social, and governance) with control variables including industry and year fixed effects, as shown in Table 3.
Regression Analysis of Corporation Innovation and ESG Activities.

Note. Standard errors are in parentheses. The GOF
, **, and * indicate significance at the 1%, 5%, and 10% levels, respectively.
In Model 1, the coefficient of “EnvPos” is positive (7.5239) and statistically significant at the 1% level. We find that environmental activity is strongly positively associated with corporate innovation, consistent with our expectation. Improvement in firms’ environmental activities leads to an increase in firm innovation. On the other hand, while “EnvNeg” is negatively associated with corporate innovation, the association is not statistically significant.
In Model 2, the coefficient of “SocPos” is positive (9.5790) and statistically significant at the 1% level. We find that social activities in firms are strongly positively associated with corporate innovation. We find in addition that “SocNeg” is negatively associated with corporate innovation and statistically significant at the 1% level. These results are consistent with our expectations that improvement in firms’ social activities leads to an increase in firm innovation. The findings confirm that companies that promote positive activities related to social factors in ESG can drive more product, process, and organizational innovation. For example, an increase in corporate social participation in positive activities can positively impact the adoption of organizational change—which is an important innovation in and of itself.
Overall, our findings on the relationships between environmental and social factors and innovation in firms are similar to the findings of existing studies and to our expectations. In other words, we confirm that positive environmental and social activities of companies have positive effects on companies’ innovation outputs. On the other hand, even though environmental negative activities are shown to be not significant, they are found to have negative effects on corporate innovation. Social negative activities have significant negative effects.
In contrast, findings in the corporate governance dimension show different results from general common sense. In Model 3, the coefficient of “GovNeg” is positive (2.9391) and statistically significant at the 1% level. However, the coefficient of “GovPos” is negatively associated with corporate innovation but statistically not significant. These results suggest that governance negative indicators, including “governance structure,”“controversial investments,” and “bribery and fraud” are strongly positively associated with corporate innovation.
Looking at the negative indicators of “governance structure” and “controversial investments,” we may revisit the issue of diversity in board composition. Diversity in board membership may mean that considerable effort is required to reach final decisions on risky projects in which the company must inject capital for innovation. For example, internal executives may be more prepared to invest in risky R&D projects because they are less dependent on the opinions and evaluations of outside directors (who tend to be reluctant to accept decisions on high-risk innovation projects without considerable caution). Thus improvements in governance (particularly in terms of board composition) are generally recognized as a positive sign for ESG activities, and the contributions of diverse governance to innovation are likely to be favorable. Nevertheless, the results of this study suggest that more research is needed on the relationship between governance and innovation.
As Table 3 shows, Model 4 conducts logistic regression with corporate innovation on all ESG dimension indicators. The p-values of “EnvPos,”“SocPos,”“SocNeg,” and “GovNeg” are very significant, as seen in earlier analysis in Models 1 to 3. In addition, in terms of control variables, size, ROA and R&D intensity are strongly significantly positively correlated with firm innovation. Likewise, leverage is significantly positively correlated with firm innovation. All findings are consistent with the findings of existing research.
To verify whether nested models are superior to full model, we conducted the likelihood-ratio test, with the assumption that Model 1, 2, and 3 are nested in Model 4. The null hypothesis of the likelihood ratio test states that the full model should be utilized for analysis. As a result, it delivered 163.75, 148.44, and 261.47 test values respectively, which means that the null hypothesis has to be rejected (Pr
In addition, we confirm the variance inflation factor (VIF), which is a widely used multicollinear indicator. All VIF values are less than 7, indicating that there is a low possibility of problems due to multicollinearity in our empirical analysis (Table 4).
Multicollinearity.

This result was performed using R.
Sub-Group Regression by Industry Level
Additionally, samples were analyzed by sub-grouping according to industry. Industries were coded according to Standard Industrial Classification (SIC) criteria, managed by the U.S. Securities and Exchange Commission. Among various major industries, four industries were selected, and each model was analyzed through logistic regression. For logistic analysis, samples were classified into four major categories, including manufacturing, technology, life sciences, and trade and services.
Manufacturing
Table 5 shows the results of discrete analysis of the manufacturing industry. In particular, environmental activities may be more related to innovation in the manufacturing industry than in the service industry. Accordingly, 2,582 samples out of the total 14,347 samples were grouped and analyzed. The results of analysis are as follows.
Regression Analysis for Manufacturing.

Note. Standard errors are in parentheses. The GOF
, **, and * indicate significance at the 1%, 5%, and 10% levels, respectively.
With regard to environmental activity, the coefficient of “EnvPos” is positive (8.4822) and statistically significant at the 1% level. Environmental activity is found to be strongly positively associated with corporate innovation. This result shows higher coefficient values than the coefficient values of the entire sample in Table 3. However, “EnvNeg” shows a completely different direction and value. As shown in Table 3, “EnvNeg” has been found to have negative effects on corporate innovation. In the model herein, however, “EnvNeg” is found to have positive effects that are significant at the 5% level. This result is conjectured to be due to the fact that many of the values of indicator data in environmental dimensions of the manufacturing industry tend to be biased to zero. Further research is needed to understand the meaning of this finding in greater detail.
In social activity, the coefficient of “SocPos” is positive (12.4144) and statistically significant at the 1% level. We also find that social activity is strongly positively associated with corporate innovation in manufacturing. Companies that promote positive activities related to social dimensions are shown to drive more product, process, and organizational innovation in the manufacturing industry.
In governance activity, the coefficient of “GovNeg” is positive (2.7340) and statistically significant at the 1% level. These results are similar to the review of findings depicted in Table 3, and it can be seen that negatively perceived indicators of corporate governance activities in general have a positive effect on product innovation in manufacturing settings.
Technology
Table 6 shows analysis results of a total of 2,250 technology companies. In technology industries, no relationship is found between environmental activities and corporate innovation. In contrast, significant points of association are found between social activities and governance activities and innovation in technology companies.
Regression Analysis for Technology.

Note. Standard errors are in parentheses. The GOF
, **, and * indicate significance at the 1%, 5%, and 10% levels, respectively.
In social activity, the coefficient of “SocPos” is positive (10.7551) and statistically significant at the 1% level, while “SocNeg” is negatively associated with corporate innovation and statistically significant at the 5% level. In governance activity, the coefficient of “GovNeg” is positive (2.6974) and statistically significant at the 1% level.
Overall, social and governance factors are shown to have similar results to the findings outlined in Table 3 and to our expectations. Social positive activities of technology companies are found to have positive effects on innovation, while social negative activities have significant negative effects. Likewise, the results in governance are similar to the results of previous analyses, even though it can be seen that negatively perceived indicators of governance activities in general have positive effects on innovation among companies in technology industries.
Life Sciences
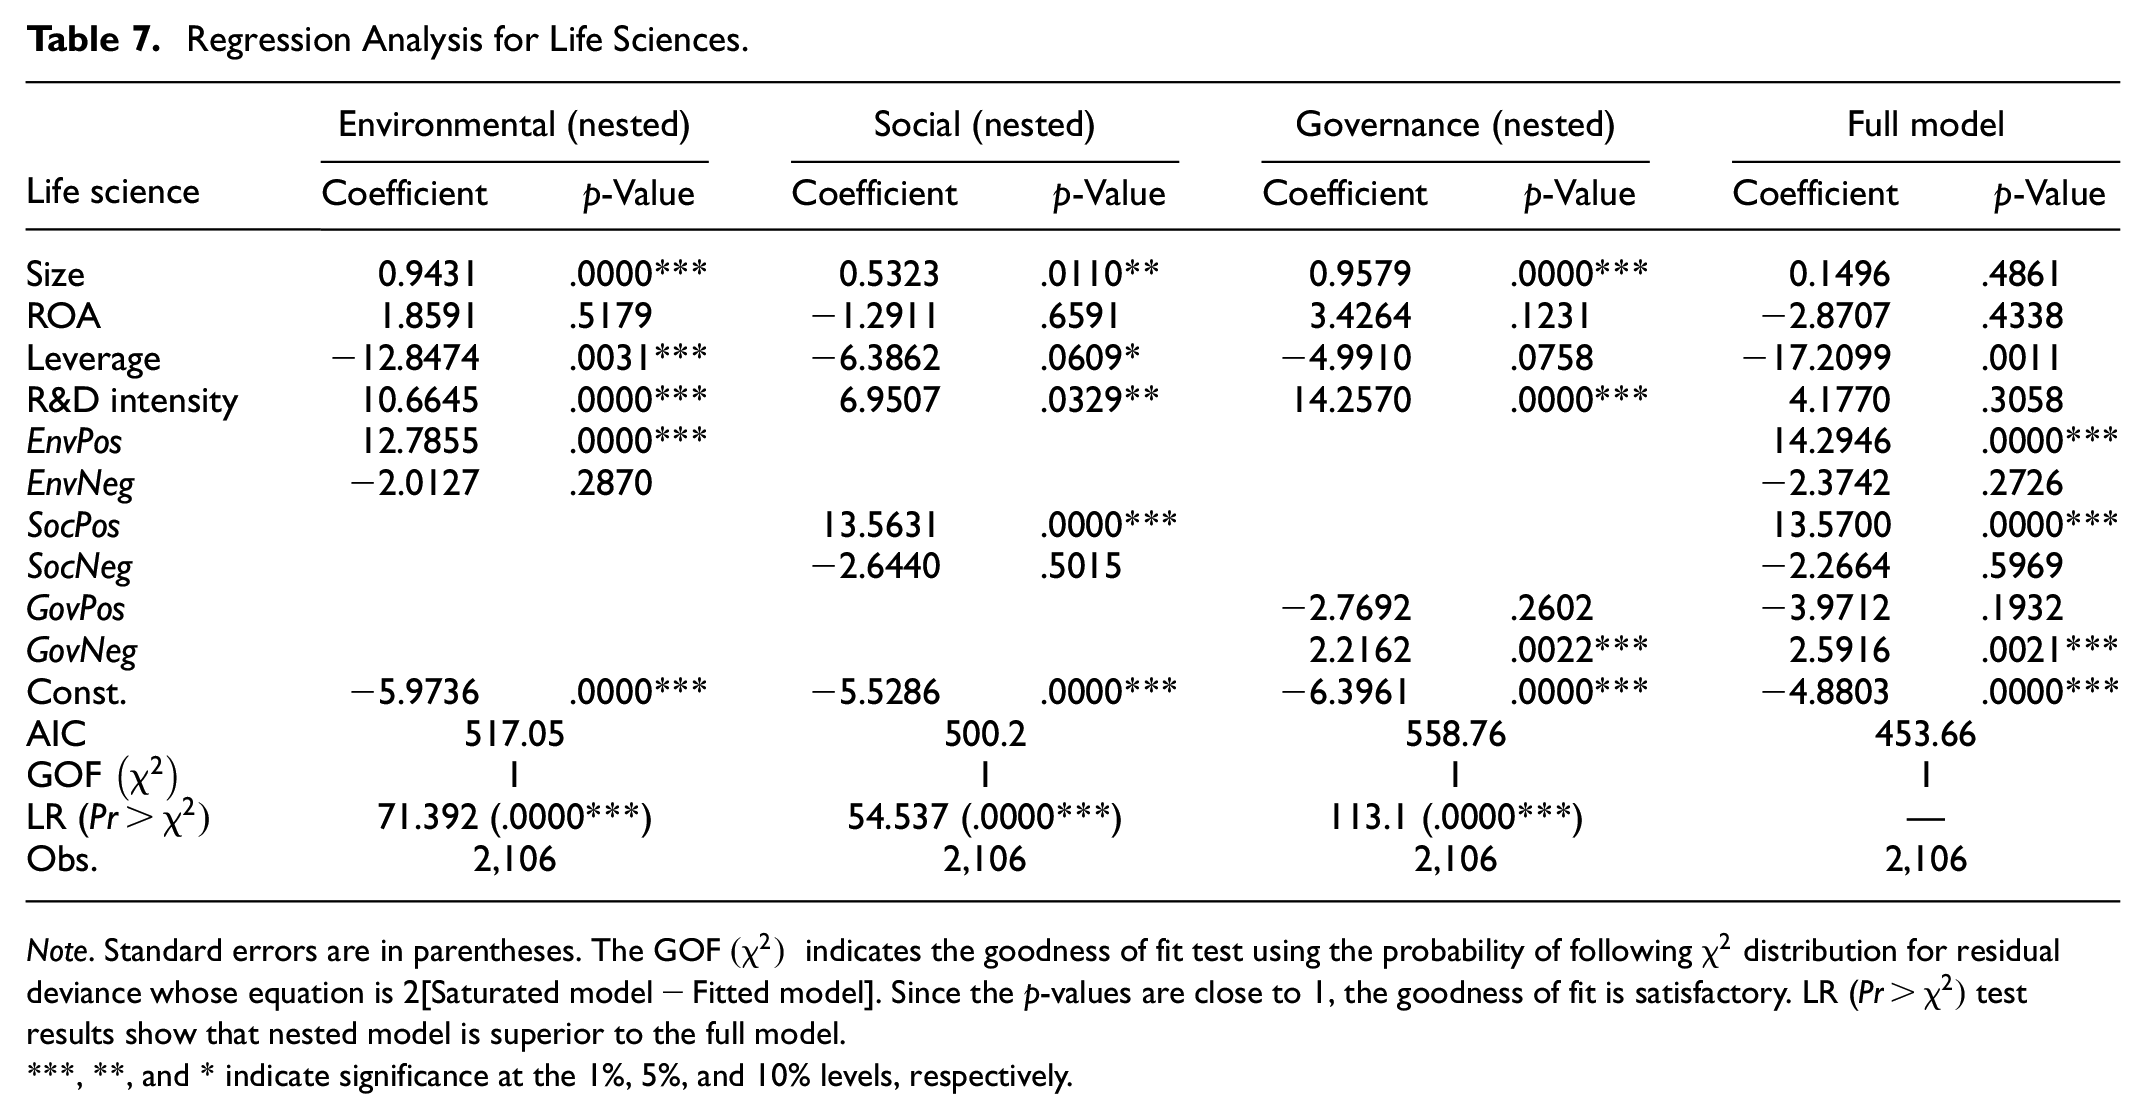
Table 7 shows analysis results for a total of 2,106 life sciences companies. The coefficient of “EnvPos” is positive (12.7855) and statistically significant at the 1% level. We also find that environmental activity is strongly positively associated with corporate innovation in life science industries. The coefficient of “SocPos” is positive (13.5631) and statistically significant at the 1% level. The coefficient of “GovNeg” is positive (2.2162) and statistically significant at the 1% level.
Regression Analysis for Life Sciences.
Note. Standard errors are in parentheses. The GOF
, **, and * indicate significance at the 1%, 5%, and 10% levels, respectively.
These results are similar to results in previous analyses, the meaning of which is generally interpreted to be that increasing biopharmaceutical companies’ environmental and social positive activities will increase the likelihood that innovative products are created. In addition, considering the high levels of R&D investment in the biopharmaceutical industry and its tendencies to invest in R&D projects that are lengthy and likely to fail, findings herein around governance variables can be understood in ways that are similar to before.
Trade and Services
Table 8 depicts findings on 1,875 trade and service companies grouped and analyzed from the total 14,347. Analysis of the service industry highlights aspects that are slightly different from the results of other existing industries. Variables including size, ROA, and R&D intensity demonstrate no influence on innovation, while only leverage shows significant effects.
Regression Analysis for Trade and Services.

Note. Standard errors are in parentheses. The GOF
, **, and * indicate significance at the 1%, 5%, and 10% levels, respectively.
The coefficient of “EnvPos” is positive (10.7673) and statistically significant at the 10% level. The coefficient of “SocPos” is positive (17.6651) and statistically significant at the 1% level. We also find that social activities are strongly positively associated with corporate innovation in the service industry.
In terms of governance activities, the coefficient of “GovNeg” is positive (6.1631) and statistically significant at the 1% level. These results are similar to the results shown in Table 3. However, the coefficient of “GovPos” is positive (6.0192) and statistically significant at the 5% level, which is different from findings in other industries. More specifically, positive governance activities in service companies are found to have positive effects on corporate innovation. Due to the nature of the service industry, companies and goods are directly consumer-facing in all transactions and exchanges. Thus decisions that consider the composition of board directorship, outside directors, and branding in companies that are governance positive will have this effect on innovation.
Logistic Regression Tree
In addition to logistic models, we conducted logistic regression tree analysis. Our results are depicted in Figure 2. As a method of analysis, a logistic regression tree predicts dependent variables (yielding the prediction) by partitioning a model through decision nodes based on machine learning. The “rpart package” of R was used as the Analysis Tool herein.

Logistic regression tree.
In the tree analysis, the variable “EnvPos” was chosen as the root node of the hierarchical structure. The final leaf of the tree had a forecast value prediction of “Final Leaf,” which was the highest value obtained. As the highest predicted value has the greatest impact on the probability value of the dependent variable, which ranges between 0 and 1, it can be inferred that the probability of developing innovative products increases in the following order: (1) Environment Positive (EnvPos < 0.5), (2) R&D intensity (int < 0.0092), (3) R&D intensity (int ≥ 760e−9), (4) R&D intensity (int < 7.8e−6), (5) Social Positive (SocPos ≥ 0.099), (6) ROA (ROA < 0.0044), (7) Social Positive (SocPos < 0.26), (8) ROA (ROA ≥ 0.0026), and (9) Social Positive (SocPos < 0.15), based on the hierarchical order of decision nodes.
Additionally, tree analysis has the potential to provide a ranked list of indicators that priori-tize a company’s focus among various variables related to ESG activities. While logistic regression analysis identifies variables that significantly impact the dependent variable, tree analysis facilitates the identification of top variables by hierarchically distinguishing the factors that influence them. For instance, according to the tree analysis conducted here, to increase the probability of companies developing innovative products, the most important ESG indicators to address are Environment Positive indicators (EnvPos < 0.5) for prediction.
Conclusions
Environmental, social, and governance criteria are important tenets of management that companies must meet because of the enormous significance for corporate innovation, risk-taking, solid performance, and sound development of capital markets. As a result, governments and major financial regulators worldwide have gradually begun to push for the normalization and institutionalization of ESG information disclosure. Likewise, research in ESG is gradually increasing in academic and practical sectors. Existing literature in the relationship between ESG and firm performance to date, however, offers no clearly consistent empirical insight about the relationship between the two variables, and large-scale sample studies based on global companies remain scarce.
This paper selects ESG indicators and financial data of global companies from 1999 to 2009 based on the relationship between ESG activities and corporate innovation. The effects of logistic regression analysis on corporate innovative product development performance are analyzed according to detailed ESG activities.
Using ESG information compiled by MSCI ESG KLD STATS, we find that positive environmental activities appear to enhance innovation outputs by firms in various industries. This indicates that when firms are challenged by environmental issues and respond with positive activities to meet the challenges, these efforts are reflected in the form of increased capabilities to develop innovation competencies and new products. Additional analyses show that both positive and negative social activities have a greater impact on firms’ innovation performance than the impact of other dimensions of ESG on innovation. This also indicates that certain types of social activities can initiate changes in organizational processes and structures to promote a collective work ethic and spirit, further leading significant innovation at the organizational level.
On the other hand, the results of analysis pertaining to the impact of corporate governance activities on innovation are interesting and slightly confounding. Findings on governance negative indicators, including “governance structure issues” and “controversial investments” are shown to be strongly positively associated with corporate innovation. This evidence suggests the need for future studies in the context of governance issues and management. Generally, companies should avoid concentrated ownership in favor of establishing and protecting board diversity. Nevertheless, this study shows that positive governance activities such as board diversity and the existence of an external board of directors may require disciplinary measures for certain strategic decisions made by main shareholders, thus causing leadership to become cautious and unwilling to accept the risks of uncertainty in innovation projects. Diversity in board membership may impede innovation and adoption of new strategies for product development because board members with differing backgrounds and levels of experience may not have parity in their awareness of products and markets across long periods of time.
In comparison to existing research, this study is academically significant because it is one of the rare research endeavors that analyzes direct relationships among ESG activities and corporate innovation in global companies across a long period of time. Our findings are generally in accordance with our expectations derived from the theoretical reasonings we developed in Section “Theoretical Foundation of the Relationship Between ESG and Innovation.” Our findings are in support of the previous empirical evidence that verified the positive relationship between CSR activities and R&D investments (Reverte et al., 2016; Ueki et al., 2016). Due to limitations in data, however, there is a lack of analysis for recent years in global industry after 2009. As data related to corporate ESG activities has been actively accumulated to reflect the growing importance of ESG phenomena, additional innovation variables and further research are needed in the effects of ESG activities on corporate innovation performance. For future research, more diverse quantitative and qualitative measurements of corporate innovation activities need to be introduced, and the role of innovation connecting ESG with financial performance needs to be investigated at a deeper level.
Footnotes
Appendix
MSCI ESG Indicators.

| Column headers | Indicator labels | Column headers | Indicator labels | Column headers | Indicator labels | Column headers | Indicator labels |
|---|---|---|---|---|---|---|---|
| ENV-str-A | Environmental opportunities—Environmental opportunities in clean tech | ENV-con-J | Supply chain management | EMP-con-A | Collective bargaining and unions | PRO-str-K | Product safety—Insuring health and demographic risk |
| ENV-str-B | Pollution and waste—Toxic emissions and waste | ENV-con-K | Water stress | EMP-con-B | Health and safety | PRO-con-A | Product safety and quality |
| ENV-str-C | Pollution and waste—Packaging materials and waste | ENV-con-X | Environment—Other concerns | EMP-con-F | Supply chain labor standards | PRO-con-D | Marketing and advertising |
| ENV-str-D | Climate change—Carbon emissions | COM-str-H | Community engagement | EMP-con-G | Child labor | PRO-con-E | Anticompetitive practices |
| ENV-str-G | Environmental management systems | COM-con-B | Impact on local communities | EMP-con-H | Labor management relations | PRO-con-F | Customer relations |
| ENV-str-H | Natural capital—Water stress | HUM-str-D | Indigenous peoples relations | EMP-con-X | Labor rights and supply chain—Other concerns | PRO-con-G | Privacy and data security |
| ENV-str-I | Natural capital—Biodiversity and land use | HUM-str-X | Human rights policies and initiatives | DIV-str-B | Representation | PRO-con-X | Customers—Other concerns |
| ENV-str-J | Natural capital—Raw material sourcing | HUM-con-J | Civil liberties | DIV-str-C | Board diversity—Gender | CGOV-str-G | Corruption and instability |
| ENV-str-K | Natural capital—Raw material sourcing | HUM-con-K | Human rights concerns | DIV-con-A | Discrimination and workforce diversity | CGOV-str-H | Financial system risk |
| ENV-str-L | Environmental opportunities—Opportunities in green building | EMP-con-X | Human rights—Other concerns | DIV-con-C | Board diversity—Gender | CGOV-con-K | Governance structures |
| ENV-str-M | Environmental opportunities—Opportunities in renewable energy | EMP-str-A | Union relations | PRO-str-A | Product safety and quality | CGOV-con-L | Controversial investments |
| ENV-str-N | Pollution and waste—Electronic waste | EMP-str-C | Cash profit sharing | PRO-str-C | Social opportunities—Access to healthcare | CGOV-con-M | Bribery and fraud |
| ENV-str-O | Climate change—Energy efficiency | EMP-str-D | Involvement | PRO-str-D | Social opportunities—Access to finance | CGOV-con-X | Governance—Other concerns |
| ENV-str-P | Climate change—Product carbon footprint | EMP-str-G | Health and safety | PRO-str-E | Social opportunities—Access to communications | ALC-CON-A | ALCOHOL |
| ENV-str-Q | Climate change—Climate change vulnerability | EMP-str-H | Supply chain labor standards | PRO-str-F | Social opportunities—Access to communications | FIR-CON-A | FIREARMS |
| ENV-con-D | Toxic emissions and waste | EMP-str-L | Human capital development | PRO-str-G | Product safety—Chemical safety | GAM-CON-A | GAMBLING |
| ENV-con-F | Energy and climate change | EMP-str-M | Labor management | PRO-str-H | Product safety—Financial product safety | MIL-CON-A | MILITARY |
| ENV-con-H | Biodiversity and land use | EMP-str-N | Stakeholder opposition—Controversial sourcing | PRO-str-I | Product safety—Privacy and data security | NUC-CON-A | NUCLEAR POWER |
| ENV-con-I | Operational waste (non-hazardous) | EMP-str-X | Human capital—Other strengths | PRO-str-J | Product safety—Responsible investment | TOB-CON-A | TOBACCO |
Note. This table from MSCI Inc. (2019).
Authors Contributions
Conceptualization, Lee, J.; methodology, Cho, J. and Kim, J.; validation, Cho, J. and Kim, J.; formal analysis, Lee, J. and Cho, J.; investigation, Lee, J. and Cho, J.; resources, Kim, J. and Cho, J.; data curation, Kim, J. and Cho, J.; writing—original draft preparation, Lee, J. and Cho. J.; writing—review and editing, Lee, J and Cho, J.; visualization, Kim, J and Cho, J.; supervision, Lee, J. and Cho, J. funding acquisition, Cho, J. All authors have read and agreed to the published version of the manuscript.
Declaration of Conflicting Interests
The author(s) declared no potential conflicts of interest with respect to the research, authorship, and/or publication of this article.
Funding
The author(s) disclosed receipt of the following financial support for the research, authorship, and/or publication of this article: This research was funded by University of Ulsan, grant number 20220381.
Data Availability Statement
The data that support the findings of this study are available the followings; (i) MSCI ESG KLD STATS, which provides an annual dataset of environmental, social, and governance (ESG) performance indicators applied to a universe of publicly traded companies and (ii) Wharton Research Data Services (WRDS), which provides financial statement data.