
Abstract
As an important way to expand financing channels, the listing can significantly improve the enterprises’ comprehensive competitiveness. However, few studies pay attention to the continuous impact of listing years on enterprise innovation. Based on the sample data of Chinese enterprises before and after listing from 2004 to 2017, this paper discusses the relationship between the listing years and dual innovation. And analyzes the moderating effect of slack. The research shows that the listing years are related to the quantity and quality of innovation in the inverted U-shaped, but the inflection point of the innovation quantity is later than the innovation quality. Before listing, the innovation quantity and quality increased; after listing, the innovation quantity first increased and then decreased, while the innovation quality declined. High slack makes the inverted U-shaped relationship between the listing years and innovation quality steeper.
Introduction
Innovation is a high-risk and high-investment activity (Cuevas-Rodríguez et al., 2014; Wright et al., 2001). In the era of the knowledge economy, it is not easy for enterprises to raise the stable capital flow required for innovation through external institutional investment, bank loans, debt financing, and so on. The financing obtained from the listing can solve this problem very well. Listing is an important way for an enterprise to raise funds. It is the mainstream development strategy of modern enterprises to raise funds needed for enterprise development from investors in the stock market through an initial public offering. The company can use the listing’s financing to expand production, research, and development to achieve higher operating performance. All investors, including institutional investors, and small and medium-sized stock market participants, pay close attention to the innovation ability of enterprises. This ability is a very important factor for enterprises to maintain long-term competitiveness, making enterprises more motivated to improve their innovation ability after listing (Luong et al., 2017; Wang & Cheng, 2022). Because the speed and quality of innovation are closely related to organizational learning and affect competitive advantage (Le & Lei, 2018).
Some scholars study the antecedents or conditions affecting innovation capabilities as well as their key roles in fostering important organizational outputs. For instance, Le (2024) studied the impact of knowledge-based human resource management on innovation. Le and Lei (2018) studied how organizational learning affects the speed and quality of innovation, thereby enhancing the competitiveness of enterprises. Bao et al. (2020) found that resource slack increased corporate performance through product and process innovation. Other scholars have explored the factors that affect corporate innovation from the perspective of the capital market. For instance, previous studies have shown that listing will positively impact enterprise innovation performance (Vismara, 2014; Wies & Moorman, 2015). Bernstein (2015) takes American-listed companies as research samples to analyze the changes in enterprise innovation activities and accurately discusses the promotion effect of listing on enterprise innovation. However, the above research is only limited to the differences in innovation quantity indicators between listed companies and non-listed companies, such as the total number of patent applications and the total number of patent authorizations of enterprises. However, there is also no in-depth discussion of the impact of listing years on the innovation quantity and quality. In addition, when these studies explored the impact of listing on enterprise innovation, they did not further explore the role of other factors related to the listing (such as slack) and the impact of these factors on innovation quantity with the change of listing years. It also did not discuss the mechanism of the impact of listing years on innovation quality. According to relevant research, the positive effect of listing will gradually weaken with the increase of years after the listing (Jain & Kini, 1994; Pagano et al., 1998). From this perspective, the effect of listing on enterprise innovation will be affected by the number of years of listing. Therefore, based on the same sample, this paper separates the before and after listing samples and distinguishes the quantity and quality of innovation, respectively exploring the impact of listing years on dual innovation. At the same time, this paper also explores the moderating effect of slackness on the relationship between the listing years and dual innovation.
This paper analyzes the sample data before and after the listing of Chinese enterprises in 2004 to 2017 for empirical analysis to verify these research views. The rest of this paper is structured as follows. In the second part, this paper will discuss the effect of the listing years on the quantity and quality of innovation and put forward our hypothesis. The third part shows the process of data collection and research design. The fourth part will analyze the empirical results. The fifth part will discuss the research results, research contributions, and management implications.
Theory and Hypothesis
The Effect of Listing Years on Innovation Quantity
In the research of listing and enterprise innovation performance, few scholars discuss the changes in the innovation quantity and quality before and after listing from the time dimension. This paper argues that before listing, the enterprise innovations quantity will be higher and higher as the listing date approaches. First of all, enterprises that build their competitive advantage on intangible assets, such as patents and intellectual property rights, will lack information disclosure because they are not publicly listed, so these enterprises have a high disadvantage of information asymmetry. The decision that the enterprise is expected to go public will reduce the information asymmetry of the enterprise and improve the possibility of financing through the stock market (Kao & Chen, 2020). It also sends a signal to enterprise investors, which will reduce the cost of information asymmetry, motivate the enterprises to engage in R&D activities, and increase the enterprise innovation quantity. Secondly, patents are a direct indicator of the innovation quantity. When the enterprise makes the decision that it is expected to go public, R&D-intensive enterprises with a large number of patents are easier to evaluate by external investors, and the effectiveness of their innovation is more certain (Vismara, 2014). This makes the enterprise more popular with future listing investors so as to win a higher share price in the primary market. However going public is related to a significant decline in breakthrough innovation, and the innovation level of enterprises will decline after going public (Wies et al., 2023). Finally, the patent is the embodiment of good enterprise management, which shows that the enterprise has developed to a certain stage and has opened up a niche market (Yin et al., 2022). Therefore, enterprises will increasingly pursue patent applications before listing and obtaining an increase in innovation quantity.
After listing, with the passage of listing years, the effect of listing on the increase in the innovation quantity will gradually weaken. First of all, the stock market pays more attention to the liquidity of capital and the acquisition of short-term profits, while the return cycle of innovation investment is often long, which makes some enterprises unwilling to use the financing obtained from listing for innovation research and development (Lévesque et al., 2012). Secondly, compared with unlisted enterprises, listed enterprises need to publicly disclose data and information related to enterprise operations to investors. The mandatory disclosure of information brought about by listing increases the spillover of sensitive information to competitors, thereby reducing the rent that enterprises obtain from innovation. Therefore, considering these spillover effects, the listing should inhibit enterprise innovation (Wies & Moorman, 2015). At this time, enterprises will tend to adopt conservative innovation strategies, that is, carry out more incremental innovation and reduce breakthrough innovation(Wies & Moorman, 2015). Third, the increase in stock liquidity after listing also makes enterprises vulnerable to hostile acquisitions and speculative trading by institutional investors, which inhibits enterprise R&D and innovation (Fang et al., 2014), thus reducing the innovation quantity. Fourth, the firm may lose its skilled innovators who leave the organization after listing(Bernstein, 2015). Therefore, the innovation quantity will decrease over time after listing. However, the quantity of innovative enterprises does not immediately decrease after listing. Scale preference has brought inappropriate incentives to enterprise innovation, and enterprises may choose to rely on low-quality patents to expand their patent scale for “patent management” (similar to earnings management) in order to obtain listing qualifications and obtain more funds. This phenomenon will not disappear immediately after going public but will continue for a period of time to obtain more financing, and the maintenance cost of this low-quality patent is very low. Therefore, the innovation performance of enterprises after listing will experience a trend of first increasing and then decreasing (Bernstein, 2015).
However, the continuous impact of listing on innovation quality is stronger than innovation quantity. That is, the turning point of innovation quantity after the listing is later than innovation quality. First of all, compared with the innovation quantity, the improvement of innovation quality requires longer term and larger investment, with uncertain innovation benefits and greater risks (S. Y. Liu et al., 2021). It is also difficult for enterprises to risk long-term and huge innovation investments, and unexpected bankruptcy risk may be brought by such high-risk innovation. Therefore, after obtaining a large amount of financing after listing, enterprises may reduce breakthrough innovation (Wies et al., 2023), making the continuous impact on the innovation quality stronger than quantity. Moreover, the cost of high-quality innovation is higher than that of low-quality innovation (Athreye et al., 2021). This makes enterprises more inclined to low-quality innovation even after listing, which makes the gap between innovation quality and innovation quantity bigger and bigger, and the innovation quality declines faster after listing. Second, after listing, enterprises will obtain more financial resources, while enterprises with rich financial resources are less likely to invest in radical high-quality innovation projects but more likely to invest in low-quality innovation projects (Bierly et al., 2009). This makes the change of innovation quantity better than innovation quality after listing. In conclusion, as the years of listing go by, the impact of listing on enterprise innovation performance will also change. Based on the above theoretical analysis, we believe that before listing, the innovation quantity is rising. After listing, the innovation quantity increased first and then decreased. The relationship between the listing years and the innovation quantity is inverted U-shaped. However, the turning point of innovation quantity after the listing is later than innovation quality. In view of this, this paper assumes that:
The Effect of Listing Years on Innovation Quality
This paper believes that the innovation quality of enterprises before the listing has been rising for the following reasons: First, enterprises need to adjust their internal structure to a large extent before going public to meet the basic requirements of listing on the exchange. And hire professional audit institutions to conduct a comprehensive review of their operating conditions. It can improve the management level and operating performance of enterprises, making enterprises pay more attention to high-quality innovation that can form long-term competitiveness, which can significantly improve the innovation ability of enterprises (Bernstein, 2015). This promotes the continuous improvement of enterprise innovation quality. Second, before listing, unlisted enterprises holding non-public shares rarely face the threat of hostile takeover, and the rules of the stock exchange require managers not to immediately cash out, so they must keep their own shares over a long period of time (Gao et al., 2018). This encourages the managers of unlisted enterprises to focus on innovation. In turn, the enterprise can gain more investors’ favor during the initial public offering so as to obtain a relatively high starting price and prepare for its partial cash out. Third, due to the lack of information disclosure before listing, enterprises have the disadvantage of information asymmetry, which makes it easier for enterprises to lose talent (the cost for enterprises to lose talent to competitors is lower). In order to prevent the loss of key talents, enterprises must ensure long-term stable innovation investment (Wei et al., 2020). This kind of long-term investment will improve innovation quality.
After listing, as the listing years go by, the effect of listing on improving the innovation quality will gradually weaken, mainly due to the following. First, although listing will have a positive impact on the operating activities of enterprises, lots of studies show that this effect will weaken over time. The impact of listing on enterprise performance will disappear within 4 to 5 years (Pagano et al., 1998). Under the pressure of business performance, enterprises will reduce exploratory innovation projects with high investment and high risk, and the quality of enterprise innovation will be reduced. Second, executives will be more afraid of failure after listing, which will reduce the efficiency of venture capital investment and even have a negative impact on business performance. This effect is significant within a few years after listing (Chakravarty & Grewal, 2011). This enables enterprises to avoid high-risk exploratory innovation, and the strength of the relationship between the years of listing and innovation quality will also show a decreasing trend year by year (Mizik, 2010). Third, although enterprises can obtain funds needed for innovation quality through a wider range of channels after listing, due to the impact of various factors such as information disclosure and short-term profit pressure, enterprises tend to choose a robust innovation investment plan (Mizik, 2010; Wies & Moorman, 2015). This will reduce the innovation quality of enterprises.
In short, enterprises will change over time when making innovative strategic decisions. However, intensive innovation quality activities have many benefits. But, with the improvement of the innovation quality (such as the improvement of the speed of new product development), it will also bring about the continuous upgrading of the uneconomic effects, such as scope limitation and the increase of innovation complexity. After a period of innovation activities, these costs begin to overdraw the early gains from innovation activities (Jones, 2003). Therefore, there is an inverted U-shaped relationship between the listing years and innovation quality. Moreover, as the years of listing go by, the promotion of financing brought by listing on innovation quality weakens. However, the risk of information disclosure brought about by listing will increase its hindering effect on innovation quality. Under the product of the two effects, the relationship between the years of listing and innovation quality will show the inverted U-shaped. This is consistent with the theoretical judgment of Haans et al. (2016). To sum up, this paper proposes the following assumptions:
Effect of Slack
Slack refers to the degree of resource redundancy generated when the organization’s resource set exceeds the required minimum, including personnel redundancy, financial redundancy, and idle capacity (Lu & Wong, 2019; Nohria & Gulati, 1996). Nohria and Gulati (1996) believe that slack is closely related to enterprise innovation.
High slack will enable enterprises to adapt quickly to environmental changes and internal pressure, so it will have a significant impact on the enterprise’s risk-taking behavior (Miller & Chen, 2004; Posen et al., 2017). Before listing, high slack will encourage enterprises to pursue high-risk innovation projects and protect enterprises from the impact of innovation uncertainty (Aghion et al., 2010). In addition, high slack means that enterprises do not have to worry about survival, enabling them to pay more attention to future competitiveness. Enterprises can carry out more sustainable science-based innovative searches and experiments (Salge, 2012). And then improve the quantity and quality of innovation to maintain a competitive advantage. After listing, enterprises face the pressure of information disclosure (Duan & Lin, 2022). After listing, in order to maximize short-term interests, excessive pursuit of short-term performance and neglect of high-quality innovation can bring long-term competitive advantage to enterprises. High slack will magnify this effect because high slack will make agents slack off and pay more attention to their own interests rather than organizational interests (Nohria & Gulati, 1996). At the same time, when the enterprise has a large number of idle resources, agents often invest idle resources in unrelated acquisitions in pursuit of a stock price rise, ignoring innovation (M. C. Jensen, 1993). This will have a negative impact on innovation. Based on the above analysis, this paper proposes assumptions:
Data and Research Methodology
Data Sources
In this paper, enterprises listed in China are selected as samples to study the impact of listing years on innovation quantity and quality. The data sample enterprises in financial services and business leasing industries are excluded from this paper. Firstly, we selected 1,089 public firms with complete financial data from 2004 to 2017 and 15,246 observations in total. Secondly, we eliminated firms with zero patent applications because it is unreliable to study their innovation performance changes. Finally, we conducted proofreading and supplementation through the database of the China National Intellectual Property. After excluding the samples containing missing values, the total sample contains 3,318-panel data of 237 listed enterprises from 2004 to 2017. Among them, data on enterprise R&D expenses and financial characteristics were obtained from CSMAR (China Stock Market & Accounting Research Database) and Wind databases. The patent information data were obtained from the Derwent World Patents Index database.
Variable Description
Explanatory Variables
The dependent variables are innovation quantity and quality. For the quantity of innovation, existing studies mainly measure it through indicators such as patent applications and granted. Among them, patent applications are the most direct quantity of innovation for enterprises and the most commonly used innovation performance measure in research (Bernstein, 2015). Considering the characteristics of this paper and the availability of data, we also choose patent application data as the measure of innovation quantity of enterprises (since the number of patent applications shows excessive dispersion and has more 0 values, the logarithm of “1 add the sum of patent applications” is taken as the actual measure, which is denoted as IA). Regarding the measurement of innovation quality, it can be analyzed from two perspectives. Based on the knowledge spillover perspective, Jaffe et al. (1993) argue that patent citations are the best tool to document the size and direction of knowledge spillover, while patent citations are determined by the value of knowledge. Many studies have used patent citations to measure the innovation quality (Bernstein, 2015; Lahiri, 2010; Moser et al., 2017), and this paper draws on this idea of using patent citations to measure the quality of enterprise innovation (since the number of patent citations shows overdispersion and has more 0 values, the logarithm of “1 add the sum of patent citations” is taken as the actual measure, which is denoted as IQ). In addition, Dang and Motohashi (2015) propose to use the number of invention patents to measure the innovation quality of enterprises based on the perspective of patent categories. The patent system in China mainly includes invention patents, utility model patents, and design patents, among which invention patents contain the highest quality of innovation (Dang & Motohashi, 2015). The examination and approval of invention patents are the most strict, and the application cycle is the longest. It usually takes about 3 years to pass the examination and get approval. The authorization rate is only 40% to 50%, which is generally considered to be the highest quality patent. Therefore, in this paper, the number of invention patents is used as an alternative indicator to measure the quality of innovation for robustness testing and is recorded as IP.
Explanatory Variables
We introduce the listing years (IPOage) as an explanatory variable. It is measured by the year of observation minus the year of listing, denoted as
Control Variables
In order to exclude the influence of other factors on enterprise innovation, the following control variables are introduced in this paper. First, the maturity of the enterprise is measured by the age of the enterprise (FA), and the size of the enterprise is measured by the total asset size in this paper, but since the data on total asset size is relatively large, the natural logarithm (FS) is taken for the asset size to measure the size of the enterprise. Also, net profit is used to measure return on assets (AOPR) by net profit over total operating income, while to reduce the gap between enterprises, it is processed by de-naturalizing logarithm. And the AOPR is used to measure enterprise profitability. Enterprise redundancy (Slack) is measured as dividing current assets by current liabilities(CA/CL). In China, government policies have an important influence on the development of enterprises. The State Council, in the “Thirteenth Five-Year” National Strategic Emerging Industries Development Plan, has clearly proposed eight new industries as the eight areas identified in the national strategic emerging industries plan and the supporting policies of the central and local governments. These eight fields are energy saving and environmental protection, smart grid, new medicine, electric vehicles, new materials, new energy, biological breeding, and the information industry. So this paper selects whether it is one of the eight strategic emerging industries (Ind) as a dummy variable, where the value is one if it is one of the eight strategic emerging industries and 0 otherwise. Moreover, this paper controls whether the enterprise is a state-owned enterprise (Ownership) as a dummy variable, with a value of 1 if it is a state-owned enterprise and 0 otherwise. Since diversification brings better development opportunities, and the development will be more robust, it is possible to innovate in cross-cutting areas, gain more vision and access to different needs, and thus may be more conducive to innovation. Therefore, whether or not to diversify (Diversity) is used as a dummy variable in this paper, where the value is one if diversification is carried out and 0 otherwise (Table 1).
Variable Descriptions.

Note. The data is sourced from the author’s compilation.
Research Methodology
For the empirical model, this paper researches the effects of listing years on the innovation quantity and quality. The introduction of the number of years in listing allows observing the long-term innovation impact of listing on firms. The regression model is as follows.

Descriptive Statistics
Table 2 shows the descriptive statistics of variables. From Table 2, we can see that the average age of the sample enterprises (FA) is 11.16 years, indicating that most of the enterprises have been in business for more than 10 years. The return on assets of net profit over total assets (AOPR) is 6.77, which is at a high level. Whether they are state-owned enterprises (Ownership) has a mean value of only 0.15, indicating that most of the sample enterprises are non-state-owned enterprises. The average value of diversity (Diversity) is 0.98, which indicates that the selected enterprises are basically diversified and can withstand the systematic market environment risk. The average value of whether the industry is a strategic emerging industry (Ind) is 0.56, which indicates that more than half of the sample enterprises belong to the eight strategic emerging industries. The mean value of redundant resources of current assets over current liabilities (Slack) is 2.55, indicating that the average current assets of an enterprise are 2.53 times of current liabilities, and the redundant resources of enterprises are better. The mean value of patent applications (IA) is 14.33, indicating that the overall innovation level of sample enterprises is stronger. The mean value of patents cited (IQ) is 16.68, indicating that the average quality of patents applied by enterprises is better. Table 2 also shows the average values before and after listing and t-test. Moreover, Table 2 shows the Person correlation coefficients of all variables. As can be seen in Table 2, the absolute values of most of the coefficients are below 0.50, indicating that there is no serious multicollinearity problem in this research methodology (Grewal et al., 2004). Furthermore, the results of variance inflation factors (VIFs) reinforce the initial judgment of the absence of multicollinearity since the VIFs of each variable are under the reference value of 5. Based on previous experience, all explanatory and explanatory variables were normalized to avoid potential multicollinearity in the interaction term in order to address the moderating effect (Aiken et al., 1991).
Table of Descriptive Statistics and Correlation Coefficient Matrix.

Note.*p < .01, R&D expenses, firm size, and financing units in billions of dollars. The sample size is 4,827. Data sourced from the China Stock Market & Accounting Research Database, Wind databases, and the Derwent World Patents Index database.
Research Results
Regression Analysis
In this paper, the sample is distinguished into before and after listing, and the quantity and quality of innovation are analyzed separately. Column (1) shows that before listing, the listing years (IPOage) are significantly positive for the innovation quantity (
Regression Results.

Note.*p < .1; **p < .05; ***p < .01 (two-tailed), standard errors in parentheses. The data is sourced from the regression results of Stata software and compiled by the author.

The listing years and innovation quality and quantity.
Column (9) shows that the interaction term of IPOage and Slack (IPOage2 × Slack) is significantly negative for innovation quality (
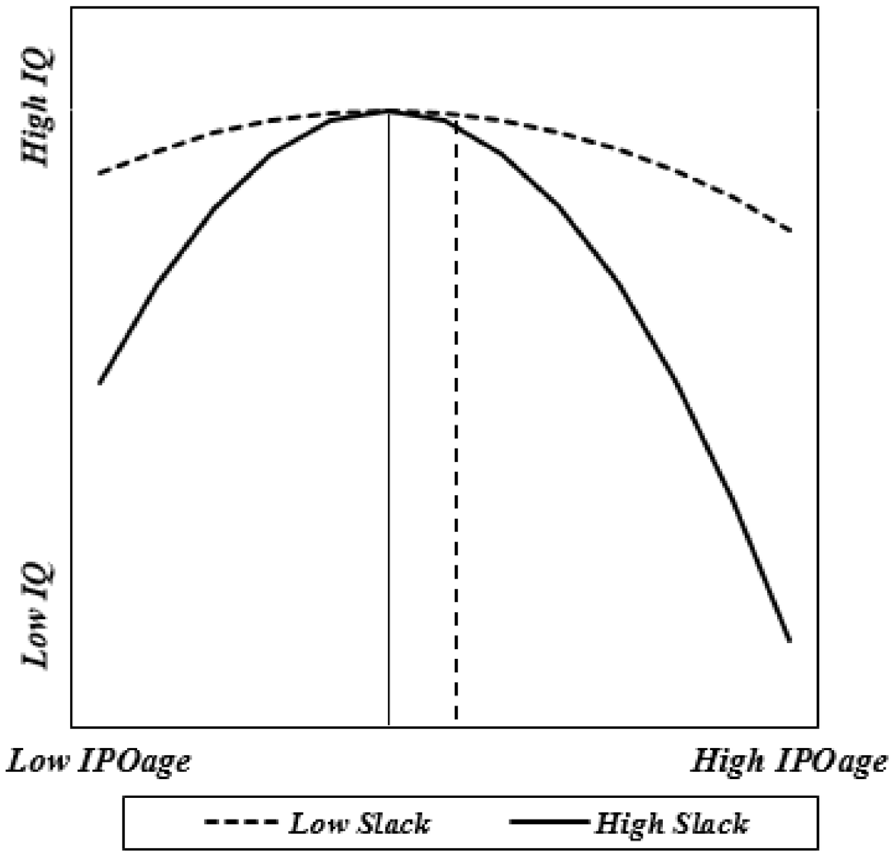
Reconciliation of high slackness on the listing years and innovation quality.
Robustness Test
Regarding the robustness test, this paper uses variable substitution and randomly selected samples for the robustness study. This paper uses patent applications per capita (
Robustness Tests One.

Note.*p < .1; **p < .05; ***p < .01 (two-tailed), standard errors in parentheses. The data is sourced from the regression results of Stata software and compiled by the author.
Meanwhile, this paper uses invention patents (IP) to replace the measure of innovation quality. Since invention patents are generally original and fundamental patents, which represent a higher degree of innovation and innovation quality (Bernstein, 2015), this paper uses them to measure innovation quality. Meanwhile, this paper uses utility model patents granted (PG) to measure the quantity of innovation instead. Utility new patents are application-oriented patents applied by enterprises, and the quality of innovation is not high but can represent the quantity of innovation of enterprises. The robustness results are shown in Table 5, and the significance and the positive and negative signs of the coefficients are basically consistent with the regression results in Table 3. Finally, this paper performs robustness tests by randomly screening the samples for re-regression, and the results are shown in Table 6, and the significance and coefficients of each model with positive and negative signs are consistent with the regression results in Table 3. Combining Tables 4 to 6, it can be seen that the findings are based on robustness.
Robustness Tests Two.
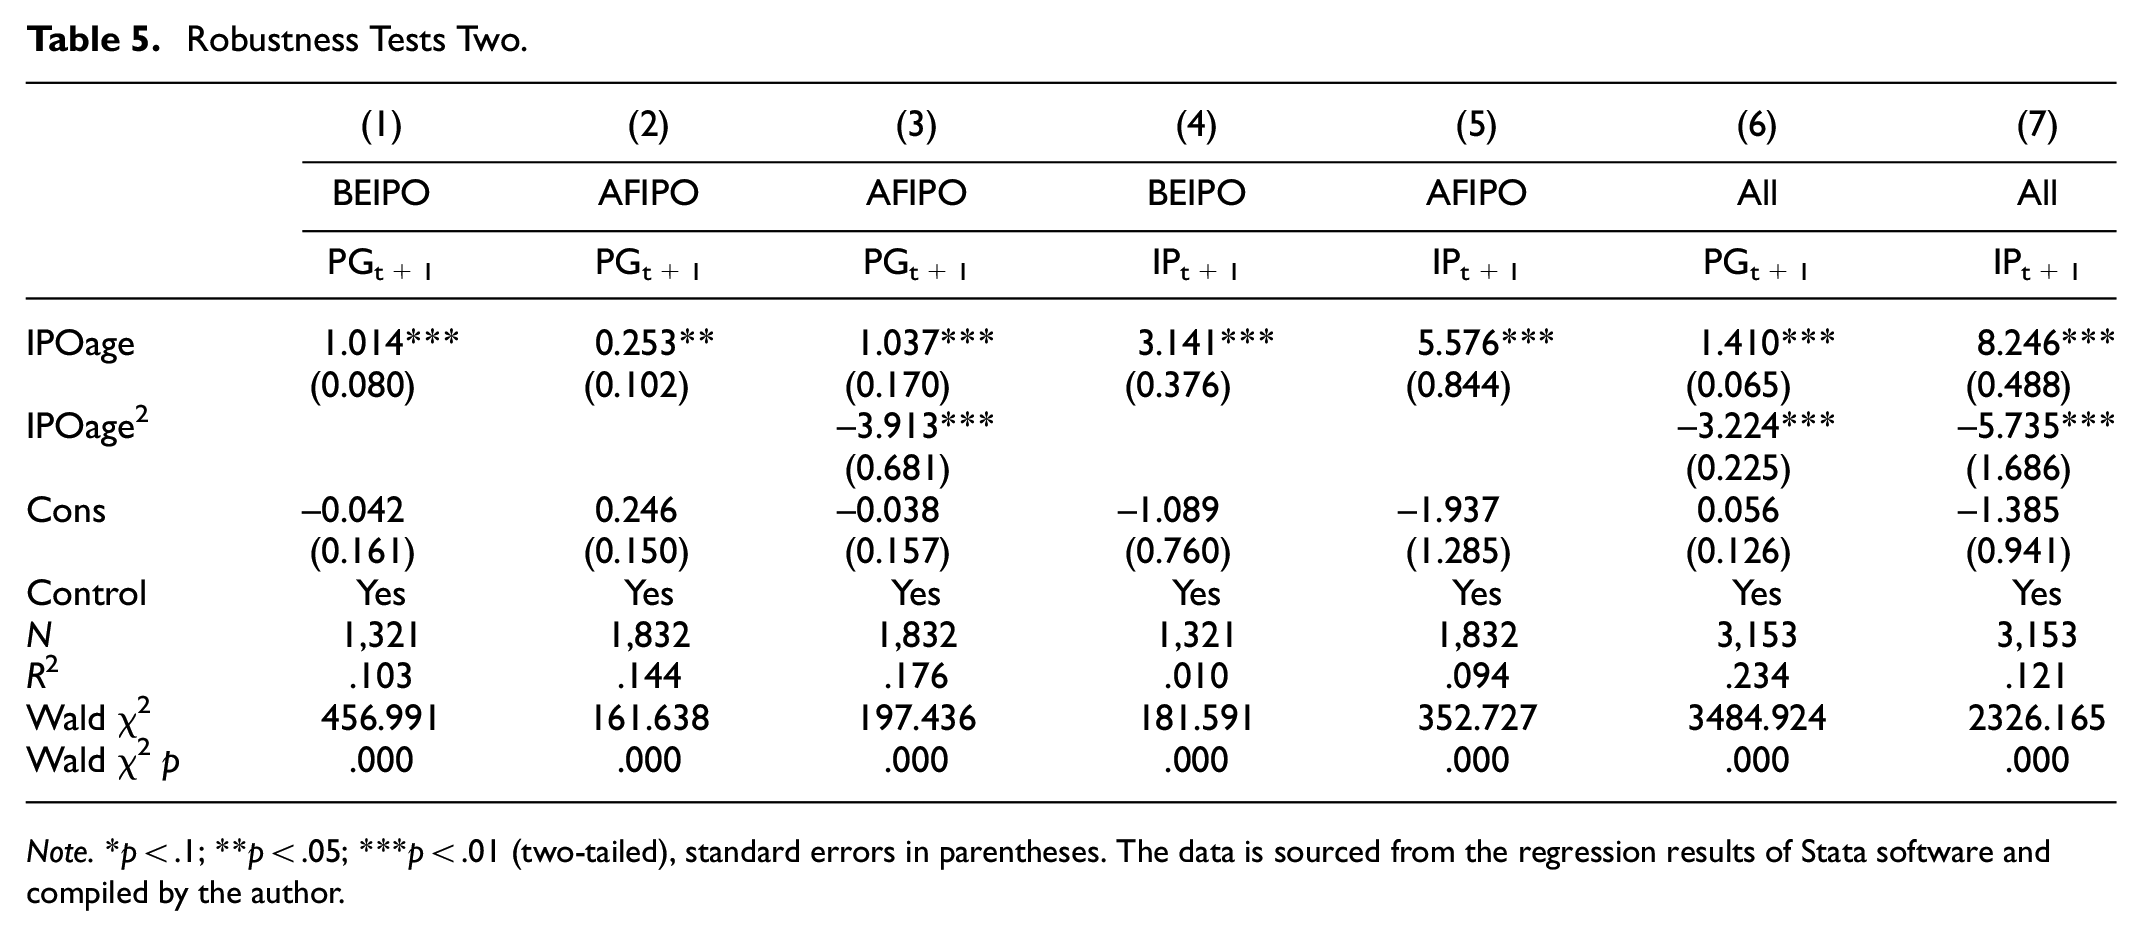
Note.*p < .1; **p < .05; ***p < .01 (two-tailed), standard errors in parentheses. The data is sourced from the regression results of Stata software and compiled by the author.
Robustness Tests Three.

Note.*p < .1; **p < .05; ***p < .01 (two-tailed), standard errors in parentheses. The data is sourced from the regression results of Stata software and compiled by the author.
Endogeneity Test
Drawing on Bernstein (2015), this paper selects the CSI 300 volatility index (HushenIndex), total cash flow from financing activities (CashFlow), and lagged one period of IPOage (L.IPOage) as instrumental variables of IPOage and uses GMM regression models to test for endogeneity. Table 7 shows the results of the CSI 300 volatility index as the instrumental variable, Table 8 shows the results of total cash flow from financing activities as the instrumental variable, and Table 9 shows the results of IPOage lagging by one period as the instrumental variable. The Sargan values for each tabular model are significant, indicating that the instrumental variables pass the tests of whether the exogenous and over-identification constraints are present. The positive and negative coefficient signs and significance of each model in Tables 7 to 9 are consistent with the regression results in Table 3, indicating that the research hypothesis tends to be robust after correcting for endogeneity.
Endogeneity Test One.

Note.*p < .1; **p < .05; ***p < .01 (two-tailed), standard errors in parentheses. The data is sourced from the regression results of Stata software and compiled by the author.
Endogeneity Test Two.

Note.*p < .1; **p < .05; ***p < .01 (two-tailed), standard errors in parentheses. The data is sourced from the regression results of Stata software and compiled by the author.
Endogeneity Test Three.

Note.*p < .1; **p < .05; ***p < .01 (two-tailed), standard errors in parentheses. The data is sourced from the regression results of Stata software and compiled by the author.
Further Analysis
(1) The Moderating effect of strategic emerging industries
Strategic emerging industries is an industrial policy implemented by the State Council of China since 2005. According to the “13th Five-Year Plan” issued by the State Council, strategic emerging industries include energy conservation and environmental protection, new energy, electric vehicles, smart grid, new medicine, new materials, biological breeding, and information industry. The promotion of these strategic emerging industries aims to address the growing social, economic, and environmental pressures in China (L. Liu et al., 2023). The industrial policies pursued by the government can play a significant role in industrial optimization and upgrading and iterative technological innovation (Stiglitz, 2017), thus influencing the relationship between the listing years and innovation. Technological innovation is the main goal of strategic emerging industry cluster development, and the promotion of strategic emerging industry policies will certainly affect the efficiency of technological innovation. The dependent variables of columns (1) and (2) in Table 10 are innovation quantity and quality. Column (1) and column (2) in Table 10 remove the control variable Ind. Column (1) shows that the interaction term of IPOage quadratic with strategic emerging industries (IPOage2
Further Analysis.

Note.*p < .1; **p < .05; ***p < .01 (two-tailed), standard errors in parentheses. The data is sourced from the regression results of Stata software and compiled by the author.
(2) Mechanistic role of financing
Going public allows enterprises to obtain lower-cost equity financing (Maksimovic & Pichler, 2001), and these financings have an impact on enterprise innovation. Wies and Moorman (2015) argue that stock market financing reduces the risk of innovation and thus has an impact on enterprise innovation. Atanassov et al. (2007) argued that independent financings, such as enterprise bonds and stocks, promote innovation inputs significantly more than bank financing and that increased innovation inputs inevitably enhance enterprise innovation performance (Feng et al., 2013). Atanassov et al. (2007) found that equity financing issued in the public market gives more freedom of decision-making to firm decision-makers, which can make enterprises choose their innovation projects freely, and that the innovation quantity by enterprises will increase significantly within 2 years of the initial public offering. Therefore, this paper argues that the quantity of years of listing affects enterprise innovation through the financing effect and thus.
The dependent variables of column (3) in Table 10 are financing levels. And the dependent variables of columns (4) and (5) in Table 10 are innovation quantity and quality. Column (4) in Table 10 shows that the quadratic term of IPOage is significantly positive for financing, indicating that the financing of the enterprise increases with the increase of listing years. Column (5) shows that financing is significantly positive for the innovation quantity, and the innovation quantity increases before and after the listing (
Discussion
This paper studies the impact of listing on the quantity and quality of innovation from the perspective of the listing years. By selecting 3,318 sample data, the regression analysis was conducted on the 13-year panel data before and after IPO. This paper studies the difference between innovation quantity and quality changes before and after the listing, close to the listing time point and far away from the listing time point. The conclusions of this paper are as follows: (1) There is an inverted U-shaped relationship between the innovation quantity and quality and the listing years. By comparing the impact of the number of years before and after listing on the quantity and quality of enterprise innovation, this paper finds that the number of years before the listing has a positive correlation with the quantity and quality of enterprise innovation. After the listing, the listing years have a negative correlation with the innovation quality, while the innovation quantity is promoted first and then suppressed. (2) High slack makes the inverted U-shaped relationship between the listing years and the innovation quantity steeper. (3) For enterprises belonging to strategic emerging industries, the inverted U-shaped relationship between listing years and innovation quality has become steeper. (4) The listing years affect the innovation quantity through the financing mechanism.
The theoretical contribution of this paper: (1) Although previous studies confirmed the positive effect of listing on enterprise innovation, they only focused on the impact of listing on the number of patent applications (Bernstein, 2015). However, the effect of relevant factors such as listing years on subsequent innovation activities of enterprises after listing was not considered. In view of this, this paper introduces the concept of listing years into the model, examines the relationship between listing years and enterprise innovation, and finds that financing changes with listing years can well explain this phenomenon. (2) Previous studies on listing and innovation only measured enterprise innovation from a single dimension. This paper analyzed the impact of listing years on enterprise innovation from the perspective of innovation quantity and quality and more comprehensively measured the long-term, lasting effect of listing years. (3) This paper analyzes the relationship between the listing years and innovation from the perspective of slack and expands the research on the listing years and innovation to the field of organizational resources.
This study takes Chinese enterprises as samples to explore the impact of listing years on corporate innovation. It has important practical implications for emerging economy enterprises to obtain financing through the capital market and enhance their core competitiveness. The research conclusion shows that listing only promotes corporate innovation in the early stage, so emerging market enterprises should not rely too much on the capital market to obtain financing for R&D activities, but should instead start from themselves and choose channels to obtain core competitiveness, such as knowledge-based human resource management (Le, 2024). The specific practical implications of this article are as follows: (1) Enterprises should not only pay attention to the quantity of innovation but also pay attention to the quality of innovation. The improvement of innovation quality can enable enterprises to obtain a sustainable competitive advantage. (2) Before listing, the quantity and quality of enterprise innovation increased, while after listing, the quality of innovation decreased, and the quantity of innovation decreased after rising. Enterprises may carry out innovation management in the process of listing, paying more attention to quantity and ignoring quality. (3) After listing, the innovation quality of enterprises will decline, and listing cannot improve the innovation quality of enterprises. Therefore, for high-tech enterprises with innovation quality as the core competitiveness, managers need to comprehensively consider the negative impact of listing when making listing decisions. This may be one reason why Huawei insists on not listing.
Limitations and prospects of this study: (1) This paper analyzes the impact of listing years from the perspective of dual innovation quantity and quality. In the future, we can analyze the impact of listing years from the perspective of dual exploration and exploitation innovation. (2) The sample of this paper is only limited to emerging economies represented by China. In the future, we can compare and analyze the differences between the listing years and innovation relationships of enterprises in developed economies and emerging economies. (3) This paper only analyzes the mechanism of the impact of the listing years on innovation from the perspective of financing. In the future, we can analyze its role from the perspectives of talent flow, transparency, and patent management.
Footnotes
Declaration of Conflicting Interests
The author(s) declared no potential conflicts of interest with respect to the research, authorship, and/or publication of this article.
Funding
The author(s) disclosed receipt of the following financial support for the research, authorship, and/or publication of this article: This work was supported by National Natural Science Foundation of China (71672133).
Data Availability Statement
Data sharing not applicable to this article as no datasets were generated or analyzed during the current study.