
Abstract
Different combinations of monetary and macroprudential policy instruments have different effects on the liquidity risk of commercial banks. We examine how monetary and macroprudential policy tools separately and jointly affect the liquidity risk of commercial banks. Using quarterly data from listed Chinese commercial banks (2014–2022), we employ a least-squares dummy variable model for analysis. Three key findings emerge. First, specific combinations of monetary and macroprudential instruments mitigate liquidity risk through coordinated action. Second, while tool pairing demonstrates coordination benefits, this does not imply that the intensity of the tool’s implementation is the most logical fit. Third, the panel smooth-transition regression analysis reveals threshold effects in two critical combinations: the deposit reserve ratio with liquidity coverage ratio and the medium-term lending facility with leverage ratio. These results highlight the importance of selecting appropriate instrument combinations and calibrating their implementation levels for effective liquidity risk regulation.
Plain language summary
1) The academic literature lacks a standardized definition and measurement of ‘coordination’ between monetary policy and macroprudential policy. We define ‘coordination’ as the phenomenon whereby the combined effects of these two policies exceed the impact of monetary policy instrument applied in isolation. This definition encompasses both the types of instruments employed and the extent to which they are implemented. 2) We investigate the effectiveness of various arbitrary combinations of monetary and macroprudential policy tools in addressing liquidity risk. The findings indicate that the effectiveness does not automatically ensure coordination. 3) We further analyze the implementation levels, employing a non-linear (threshold effect) framework. Finally, identifying optimal implementation ranges for instrument combinations: Deposit Reserve Ratio (DRR) with Liquidity Coverage Ratio (LCR), and Medium-Term Lending Facility (MLF) with Leverage Ratio (LR). The reasons for the nonlinear impact of these instrument combinations on liquidity risk are then elucidated. In terms of policy implications, policymakers should strategically align both instrument types and implementation scales.
Keywords
Introduction
Liquidity risk acts as both a catalyst and a manifestation of financial crisis (Tirole, 2010). As commercial banks’ liquidity conditions fundamentally shape financial system stability, their risk management is particularly crucial during prolonged global economic recoveries. The 2008 financial crisis exposed monetary policy’s limitations in containing liquidity risks, prompting a growing consensus on macroprudential regulation’s vital role in mitigating systemic risks (Freixas et al., 2015).
Macroprudential policy employs countercyclical measures to curb systemic risk accumulation by reducing pro-cyclicality and limiting financial contagion (Alamsyah, 2015). Many economies—such as Brazil, Australia, South Korea, Japan, and China (Kim et al., 2019)—now combine macroprudential policy with monetary policy to pursue stability (Alejandro, 2019; Nier & Kang, 2016; A. Zhang et al., 2020). However, policy interactions may create compounding or conflicting effects (Beau et al., 2013), with uncertain welfare implications compared with standalone monetary tools (Divino & Haraguchi, 2022). Such ambiguity underscores the importance of studying policy coordination (Y. Jiang et al., 2019).
This study investigates the effectiveness of coordinated monetary–macroprudential policies for managing bank liquidity risk. In particular, we analyze the spillover effects of macroprudential instruments on monetary policy. Accordingly, we help elucidate the issue of coordination between monetary and macroprudential policy instruments. First, we clarify the transmission mechanisms of both policies. Second, we analyze the effect of macroprudential spillovers on the effectiveness of monetary policy and formulate testable hypotheses. Third, using Bai et al.’s (2018) liquidity mismatch index (LMI), we measure liquidity risk in listed Chinese banks and select four representative policy instruments. The least-squares dummy variable (LSDV) model is used to evaluate individual and combined policy effects, controlling for macroeconomic and bank-level factors. While some instrument combinations show effectiveness, their optimal implementation scales remain unclear. We therefore employ panel smooth-transition regression (PSTR) modeling to identify the coordination thresholds.
The contributions of this study are as follows. 1) The existing literature lacks a standardized definition and measurement of “coordination” between monetary and macroprudential policies. We define coordination as the phenomenon in which the combined effects of the two policies exceed the effect of the monetary policy instrument changed in isolation. This definition encompasses both the types of instruments and the extent to which they are implemented. 2) We investigate the effectiveness of various arbitrary combinations of monetary and macroprudential policy tools for addressing liquidity risk. The findings indicate that effectiveness does not automatically ensure coordination. 3) We further analyze implementation levels, employing a nonlinear (threshold effect) framework. Finally, we identify optimal implementation ranges for instrument combinations—deposit reserve ratio (DRR) combined with liquidity coverage ratio (LCR) and medium-term lending facility (MLF) combined with leverage ratio (LR). We then elucidate the reasons for the nonlinear effects of these instrument combinations on liquidity risk. Regarding policy implications, policymakers should aim to strategically align both instrument types and implementation scales.
The rest of this paper is organized as follows. Related Literature reviews the literature. Analysis and Hypotheses details the analysis and hypotheses, while Method describes the methods. Results presents the results, and the discussion is given in Discussion. Limitations and Future Research discusses the limitations and recommendations for future research. Finally, Conclusion provides the conclusions.
Related Literature
Post-crisis, liquidity and capital regulations form dual pillars of macroprudential oversight. Chatterjee and Eyigungor (2009) showed that liquidity rules curb excessive bank leverage and procyclicality. Gambacorta and Marqués-Ibáñez (2011), meanwhile, identified trade-offs, in that while liquidity constraints may temporarily restrict credit supply, they lower long-term crisis risks. Wu et al. (2021) compared macroprudential tools, concluding that liquidity-based instruments (e.g., reserve requirements) coupled with monetary policy offer superior risk management under economic uncertainty.
Recent studies have explored the interactions between monetary policy and liquidity regulation. Brana et al. (2019), Monnet and Vari (2020), and Zhuang and Zhang (2021) found that macroprudential measures moderate monetary policy’s risk effects, revealing policy spillovers. Borio and Zhu (2008) established dual channels, clarifying that monetary policy influences risk-taking while capital regulation shapes its effectiveness. Delis and Kouretas (2011) highlighted buffering effects, in that higher capital ratios help banks withstand monetary shocks. Zuo et al. (2018) noted that regulatory constraints alter financial institutions’ behaviors, thereby affecting policy transmission. However, Agur and Demertzis (2019) cautioned that macroprudential tools cannot fully neutralize monetary policy’s risk channel because of regulatory trade-offs between financial stability and credit provision.
The limited research in this area has identified a threshold effect of monetary policy on the risk profiles of commercial banks. That is, the relationship is nonlinear in relation to the implementation of capital and liquidity regulation measures. Kishan and Opiela (2012) analyzed multiyear US banking sector data and uncovered a critical size-dependent divergence. Smaller banks with lower capital adequacy ratios (CARs) failed to sustain risky asset portfolios during monetary tightening. By contrast, larger institutions, benefiting from superior data infrastructure, demonstrated a stronger capacity to neutralize such policy shocks. Dell’Ariccia et al. (2017) further demonstrated that the influence of monetary policy on bank risk is contingent upon specific capital level thresholds. Keister (2019) observed that LCR may significantly affect a central bank’s short-term monetary policy implementation in the money market. Kapan and Minoiu (2018) found that banks with high net stable funding ratios exhibited greater resilience during financial crises. Nguyen and Dinh (2022) established bank capital as a pivotal determinant of monetary policy transmission efficiency. This influence operates through two mechanisms: (1) capital levels directly shape lending behaviors, and (2) undercapitalized institutions exhibit heightened vulnerability to restrictive monetary policy shocks.
Distinct from the established literature, this study investigates the effectiveness and coordination of monetary and macroprudential policies in terms of managing commercial bank liquidity risks. Specifically, we analyze policy spillovers through two lenses: (1) how macroprudential instruments influence monetary policy outcomes and (2) the nonlinear effects on liquidity risk resulting from their combined implementation. Our approach develops optimized policy instrument combinations and implementation strategies. This approach helps improve the theoretical framework of liquidity risk management and provides clearer strategies for various policy instruments.
Analysis and Hypotheses
In this study, we categorize five primary channels—bank credit transmission (Aikman et al., 2016), balance sheet (Jackson & Pernoud, 2021), asset price (Ding et al., 2017), bank risk-taking (Borio & Zhu, 2008), and monetary policy credibility (Gong & Zou, 2021)—that are identified in the literature through which monetary policy influences bank liquidity risk. These channels affect banks’ market liquidity or funding liquidity by altering their cash assets, selling behaviors, external financing, and susceptibility to runs, thereby shaping the overall level of liquidity risk. Post-crisis macroprudential regulation influences monetary policy through four principal effects: asset price and valuation distortion (Borio & Zhu, 2012), profit-seeking (Fang et al., 2012), central bank reaction, and historical habit (Zuo et al., 2018).
First, when banks face low interest rates and rising asset prices, they may adjust their current risk tolerance based on the expectation of future asset bubble bursts, the requirements of financial regulation, and the spiral of falling asset prices owing to rising interest rates (Brunnermeier & Pedersen, 2009). Second, loose monetary policy functions through the credit mechanism and lowers the likelihood of banks facing regulatory sanctions owing to liquidity deficiencies. Consequently, this encourages banks to create liquidity and engage in risk-taking behaviors (H. Jiang et al., 2023). In other words, low interest rates lead banks to seek riskier assets driven by higher profits. However, these risky assets typically exhibit diminished liquidity, requiring banks to reassess their judgment and decision-making regarding liquidity regulations (Nier & Kang, 2016).
Additionally, if the prevailing market consensus anticipates that central banks will implement accommodative monetary policies in response to adverse economic shocks, banks are likely to lower their risk tolerance. Moreover, during periods of economic expansion characterized by easy monetary policy, banks’ risk tolerance is expected to diminish. In a low-risk environment, banks may also sustain optimistic projections regarding future accommodative monetary policies. Financial regulatory requirements, particularly for liquidity, suggest that ample macroeconomic liquidity in a low-interest-rate environment will boost banks’ optimism. Figure 1 depicts these transmission dynamics.

Effect of macroprudential policy interference with monetary policy on commercial bank liquidity risk.
Figure 1 shows that macroprudential policy changes the operation of monetary policy by altering banks’ expectations and influencing their behavior. In light of this, we propose the following hypothesis.
Hypothesis 1: The spillover effects of macroprudential regulation on the monetary policy control of banks’ liquidity risk are favorable in all cases.
It is important to consider whether the implementation of each type of macroprudential policy instrument yields such spillover effects. Monetary policy tools involve quantitative, price, and structural measures while macroprudential tools include capital, countercyclical, and liquidity regulations (Boeckx et al., 2015). We must also consider whether the effect of any combination of macroprudential and monetary policy tools on commercial banks’ liquidity risk is consistently significant. This raises the following question. What is the best combination of policy instruments for mitigating liquidity risk in commercial banks? Given the scarcity of research examining the effects of various combinations of these two policy instruments on commercial bank liquidity risk, we posit the following hypothesis.
Hypothesis 2: Any combination of macroprudential and monetary policy tools will be effective for managing the liquidity risk of commercial banks.
Zhuang and Zhang (2021) found that the LCR requirement has variable effects on monetary policy transmission efficiency, influenced by macroeconomic conditions and bank characteristics. Therefore, based on Qi and Liu (2021) and considering both macroeconomic factors and bank heterogeneity, we propose the following hypothesis.
Hypothesis 3: Economic cycles and bank heterogeneity affect the coordination of monetary and macroprudential policies, influencing bank liquidity risk mitigation.
Method
LSDV Model Construction
We develop a model to investigate the spillover effects of macroprudential instruments on monetary policy, aimed at mitigating bank liquidity risk; this specifically addresses Hypotheses 1 and 2. Further, we seek to determine whether this spillover effect enhances or diminishes the efficacy of monetary policy tools; that is, can the two policy instruments be implemented in a coordinated manner to amplify their effects? To examine this, we construct a least-squares dummy variable (LSDV) model with individual-fixed effects. Individual-fixed effects can help capture the specific characteristics of each bank, which makes the estimation of policy effects more precise. Additionally, the model is suitable for analyzing short panel data. The benchmarking model is as follows:

where i denotes the sample bank, and t denotes the quarter. LMI is the dependent variable (i.e., the LMI of commercial banks). The independent variables are on the right-hand side of the equation, among which is the lag of LMI, indicating the effect of liquidity risk in the previous quarter on the current quarter’s liquidity risk. MPL and MPP represent monetary policy instruments and macroprudential policy instruments, respectively, with their subscripts k denoting the types of policy instruments adopted (k = 1, 2, 3, 4).
To address Hypothesis 3, we analyze the interaction between the two policy instruments for managing liquidity risk, considering micro-level differences among banks and the broader economic cycle. We incorporate an interaction term that combines the two policy instruments with bank characteristics, extending Equation 1 to derive Equation 2:

where the significance and the positive or negative sign of the coefficient
To assess the economic cycle’s effect on coordinating the two policy instruments for liquidity risk, Equation 1 is expanded into Equation 3 by introducing the interaction term of

The effect of the economic cycle on the effectiveness and coordination of the two policy instruments is tested by examining the coefficient
Variables and Data
Liquidity Mismatch Index
Using methods from Bai et al. (2018) and X. M. Zhang et al. (2021), we examine the asset and liability data of 41 publicly listed commercial banks in China to evaluate LMI from Q1 2009 to Q4 2022. To eliminate bank-size disturbances, LMI is normalized by total assets, providing a dynamic and comparable measure of liquidity management.
Policy Instruments
The four monetary policy instruments we analyze are quantitative, price-based, and structural tools.
1) DRR is a traditional monetary policy tool. Increasing the reserve requirement forces banks to hold more reserves, reducing available funds for lending and tightening market liquidity. Conversely, a decrease has the opposite effect.
2) Rediscount rate (RDR) influences market interest rates. An increase in RDR raises borrowing costs for commercial banks, resulting in higher market interest rates and decreased funding liquidity.
3) Standing lending facility (SLF) addresses the liquidity needs of specific financial institutions for 1 to 3 months, easing market tensions and enhancing the liquidity supply.
4) MLF offers 3-, 6-, and 12-month maturities to support liquidity in commercial and policy banks. It helps the central bank alleviate medium-term liquidity pressures.
Furthermore, we select four macroprudential policy instruments based on data availability and relevance to bank liquidity.
1) LCR measures high-quality liquid assets against net cash outflows over 30 days. It is a key standard in the Basel III framework, ensuring banks can meet obligations during a liquidity crisis.
2) CAR is calculated as (capital − deductions) / risk-weighted assets. This is essential for macroprudential policy, ensuring banks maintain sufficient capital to absorb potential losses.
3) LR is the Tier 1 net capital divided by the adjusted balance of on- and off-balance sheet assets, multiplied by 100%. It regulates overall leverage in the financial system, reducing contagion risk among institutions and minimizing systemic risk.
4) The loan-to-deposit ratio (LDR) measures total bank loans against total deposits. A high LDR suggests excessive reliance on external funding, increasing liquidity risk in the interbank market.
Control Variables
In this study, the following control variables are considered.
1) The GDP growth rate is high in prosperous economies and low during contractions.
2) Return on equity (ROE) measures a company’s profitability and efficiency, calculated as ROE = net income/shareholders’ equity.
3) Nonperforming loan ratio (NPLR) measures a bank’s loan portfolio quality by dividing the outstanding balance of nonperforming loans by the total loan amount and multiplying by 100. A high NPLR indicates declining loan quality.
Table 1 gives details about all of the variables.
Selected Variables.

Note. Data related to monetary policy instruments are obtained from the BankScope and Wind databases. Data on the macroprudential policy instruments of commercial banks are obtained from periodic reports (balance sheets) disclosed on the official websites of listed commercial banks.
The China Banking Regulatory Commission has required commercial banks to disclose their LCR since December 31, 2015. Since 23 of the 41 listed banks were listed in 2016 or later, 18 banks with insufficient disclosure are excluded, resulting in a sample of 22 banks. A short panel dataset covering the fourth quarter of 2014 to the fourth quarter of 2022 is used for testing and estimation. The use of the abbreviated forms of variables, such as DRR and RDR, in the subsequent empirical analyses helps improve the efficiency and concision of the presentation.
Table 2 presents the descriptive statistics of the variables under consideration. To mitigate heteroskedasticity in the model, the variables SLF and MLF are transformed using logarithmic functions.
Descriptive Statistics of the Variables.

Note. This table reports some statistical characteristics of the quarterly data.
PSTR Model Construction
Coordination arises from the spillover effects of macroprudential policy instruments on monetary policy instruments. Leveraging these spillovers can yield more favorable policy outcomes. However, this coordination pertains solely to the appropriate combination of instrument types and does not provide additional insights regarding the degree of implementation, rendering it somewhat unidimensional. As such, if instruments are coordinated by type but the implementation level is unclear, can they still be effective? Conversely, if the instruments of the two policies are arbitrarily combined but each operates within its respective implementation zone, is this configuration still effective? The existence of such a zone warrants investigation. Kapan and Minoiu (2018), Keister (2019), and Nguyen and Dinh (2022) suggested that variations in the effectiveness of combinations may arise from differing levels of implementation. Thus, we aim to analyze the effect of the coordination of these two policy instruments on bank liquidity risk, focusing on the extent of their implementation. This leads us to the following hypothesis.
Hypothesis 4: The effect of monetary policy on commercial banks’ liquidity risk will vary nonlinearly with the adjustment of macroprudential policy instruments.
The PSTR model, introduced by Colletaz and Hurlin (2006), analyzes nonlinear relationships among three variables. Its transition variables can disrupt the relationship between the explanatory and dependent variables. The continuous transition function captures cross-sectional heterogeneity in panel data, enabling a smooth, nonlinear transition of model parameters. This supports the theoretical framework on the spillover effects of macroprudential policy on monetary policy. Therefore, macroprudential instruments are used as transition variables to assess their effect on the liquidity risk of commercial banks.
The fundamental structure of the PSTR model is as follows:

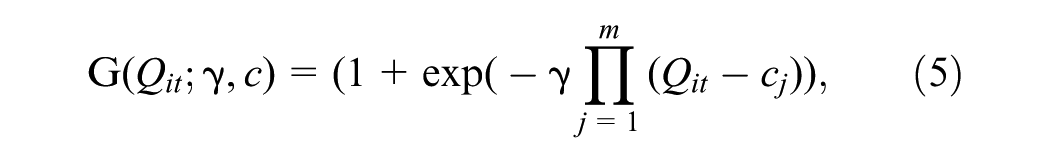
where
We now consider the effect of m on the transition function. When m = 1, the transition function contains a position parameter:

Equation 6 is a smooth-transition model with two regimes. When

where the transition model has three regimes, which are symmetrical about (c1 + c2)/2 and called the intermediate regime, with the minimum value obtained.
Before estimating the parameters, it is essential to determine whether the model exhibits a nonlinear transition mechanism. A common approach is to construct an auxiliary regression through Taylor expansion of the PSTR model at γ = 0:
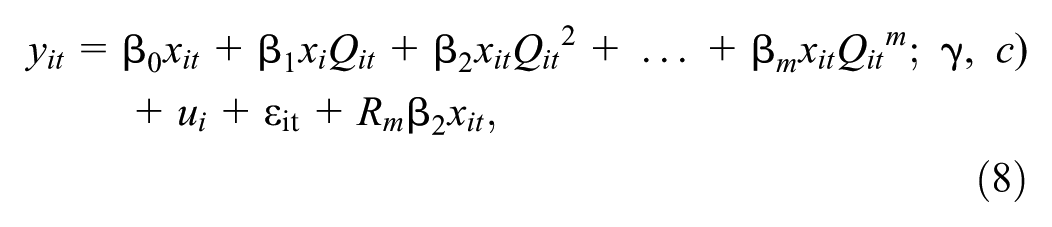
where
Then, taking H0: β1 = … = β m = 0 as the null hypothesis in Equation 8, the linearity test can be carried out by constructing the following three statistics:


where
When the LM, LMF, and LRT tests reject H0, it means the PSTR model may have a nonlinear relationship. Then, the remaining nonlinear test is conducted to determine the optimal number of transition functions (r) in the nonlinear relationship. Generally, only the null hypothesis of H0: r = 1 and the alternative hypothesis of H1: r = 2 are considered. The original PSTR model becomes the following:

Based on the original hypothesis H0:
Results
Effectiveness and Coordination
The results presented in Tables 3 to 6 indicate that the coefficients associated with LMI are consistently positive and statistically significant. This finding suggests that bank liquidity risk exhibits a temporal lag or continuity, thereby supporting the contagious nature of liquidity risk over time.
Test Results of the LSDV Model With DRR as a Monetary Policy Instrument.

Note. p Values in parentheses.
p < .1. **p < .05. ***p < .01.
Test Results of the LSDV Model With RDR as a Monetary Policy Instrument.

Note.p Values in parentheses.
p <1. **p < .05. ***p < 0.01.
Test Results of the LSDV Model With SLF as a Monetary Policy Instrument.

Note. p Values in parentheses.
p < 0.1, **p < 0.05, ***p < 0.01.
Test Results of the LSDV Model With MLF as a Monetary Policy Instrument.
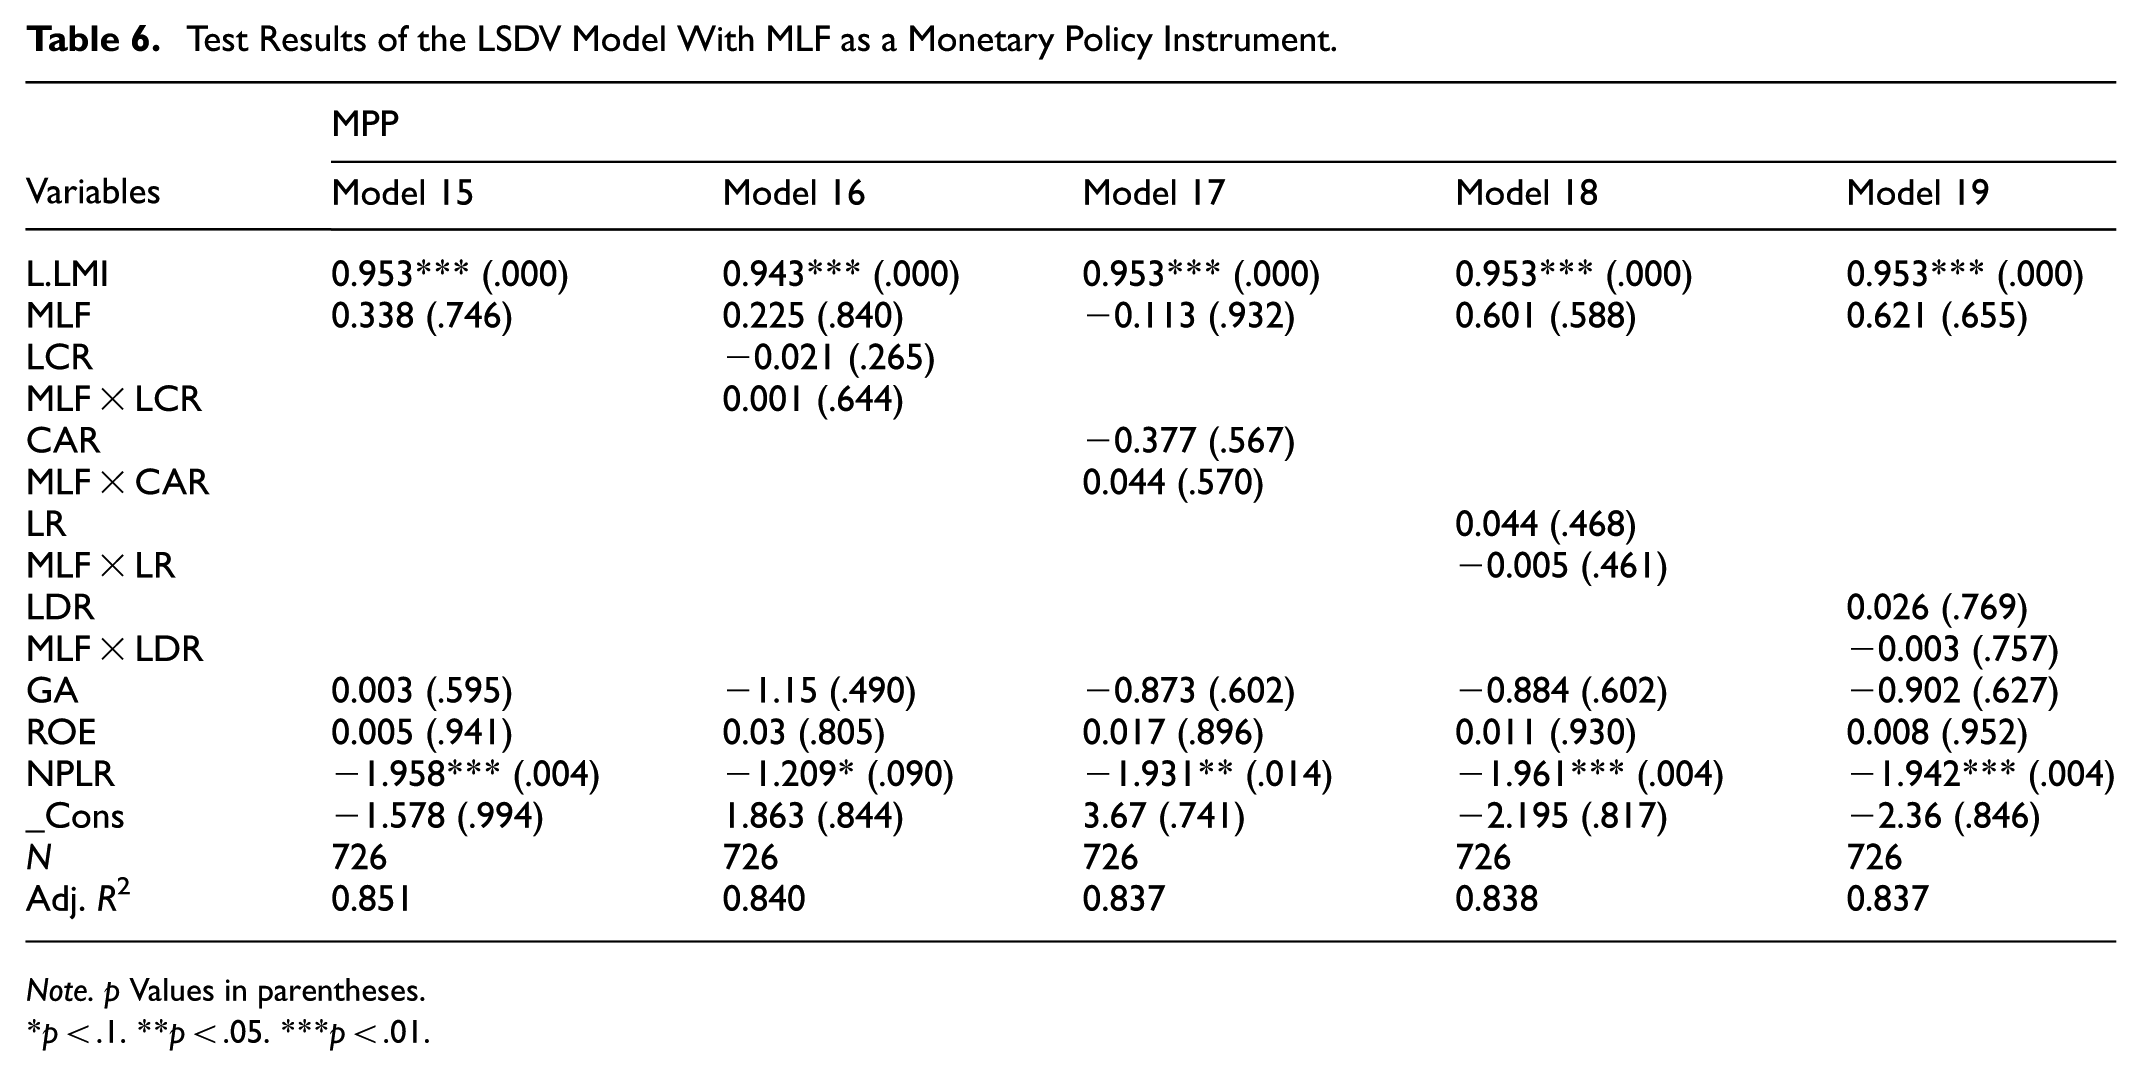
Note. p Values in parentheses.
p < .1. **p < .05. ***p < .01.
Table 3 shows that when the model is restricted to monetary policy instruments without the inclusion of macroprudential tools, the four monetary policy instruments do not all demonstrate statistical significance. Specifically, only the coefficients for DRR and RDR are both significant and positive, indicating that an increase in either DRR or RDR alone can mitigate bank liquidity risk. Furthermore, with the separate addition of the four macroprudential instruments, we can see that the significance of the coefficients of the four monetary policy instruments, whether positive or negative, varies greatly depending on the selected macroprudential variable. Additionally, the cross-term coefficients between different monetary policy instruments and macroprudential instruments exhibit notable differences.
The regression results presented in Table 4 indicate that the coefficient of RDR, a monetary policy instrument, is 12.1574 when adjusted in isolation. This finding suggests that RDR is highly effective for controlling liquidity risk. However, when RDR is used in conjunction with the four macroprudential instruments—LCR, CAR, LR, and LDR—the coefficients of the interaction terms are significantly positive, measuring 0.090, 1.064, 0.402, and 0.743, respectively. These values are substantially lower than the coefficient of 12.1574, indicating that the combined effect of these instruments is considerably less effective than the adjustment of RDR in isolation. Furthermore, the coefficients of LCR, CAR, LR, and LDR are all significantly negative, suggesting that these macroprudential instruments may diminish the effectiveness of RDR to varying degrees.
The regression results presented in Table 5 indicate that when the monetary policy instrument is SLF, the combination of instruments affects LMI only when the macroprudential policy instrument is LCR. An increase in regulatory requirements for either SLF or LCR independently increases banks’ liquidity risk. Since the coefficient of the interaction term between the two instruments is positive, it suggests that the spillover effect of LCR on SLF amplifies the risk-increasing effect of SLF. Conversely, a simultaneous reduction in both instruments mitigates bank liquidity risk.
Table 6 shows that neither MLF on its own nor in combination with any macroprudential instrument has a significant effect on bank liquidity risk.
Effects of Macro and Micro Factors
Next, we examine macroeconomic factors—specifically, the economic cycle as indicated by GDP—alongside microeconomic factors, such as bank characteristics represented by ROE and NPLR. The findings of these tests are not detailed here since the results indicate that neither GDP nor the bank-specific metrics of ROE and NPLR exert a significant influence on the coordination of policy instruments. Consequently, we consider alternative methods to further investigate the underlying causes.
The results presented above are derived from two-by-two implementation based on the type of instrument used. However, questions regarding the adequacy of the implementation level of these instruments are not examined. Thus, the following analysis investigates whether the effectiveness of monetary policy for mitigating liquidity risk varies with the implementation of macroprudential policy instruments.
Nonlinearity Test
Nonlinearity Test Results
Using PSTR requires identifying a nonlinear relationship between the independent and dependent variables. To evaluate nonlinearity, we use several macroprudential instruments as transition variables. This assessment is conducted through the application of LM, F, and pseudo-LRT statistics. The RDR variable is excluded from the nonlinearity test, as the LSDV model results indicate that it performs better in isolation than with the four macroprudential policy instruments. A linearity test is performed first. If rejected, a residual nonlinearity test determines the optimal number of transition functions (r). The Akaike information criterion (AIC) and Bayesian information criterion (BIC) are then used to identify the optimal number of location parameters (m) for the nonlinear model estimates (Brännäs et al., 1994). The results of the assessments for each combination of policy instruments and dependent variables are organized and presented as Models (1) to (24) in Tables 7 to 9.
Nonlinear Test With DRR as the Explanatory Variable.

Note. p Values in parentheses.
, **, and * show significance at the 1%, 5%, and 10% levels, respectively.
Nonlinear Test With SLF as the Explanatory Variable.

Note. p Values in parentheses.
, **, and * show significance at the 1%, 5%, and 10% levels, respectively.
Nonlinear Test With MLF as the Explanatory Variable.

Note. p Values in parentheses.
, **, and * show significance at the 1%, 5%, and 10% levels, respectively.
Table 7 indicates that Models (1), (5), and (6) reject the null hypothesis of a linear relationship at the 10% significance level. Table 8 reveals that Models (9) to (16) consistently reject the null hypothesis of linearity. Finally, Table 9 demonstrates that the null hypothesis of linearity is rejected at the 10% significance level for all models, with the sole exception of Model (24). A comparison of the AIC and BIC values of the two models under the same transformation variable indicates that the optimal number of location parameters, m, is determined to be 1 for all transition functions.
Table 10 shows the findings of the nonlinearity tests. Statistically, the results indicate significance for the majority of the policy instrument combinations we examine. The effect of different combinations of monetary and macroprudential policy instruments on the liquidity risk level of commercial banks varies.
Significance of the Nonlinearity Test Under the Combination of the Two Policy Instruments.

Note.√ indicates that the nonlinear statistic is significant. The enacted monetary policy instrument has a nonlinear effect (threshold effect) on banks’ LMI, with the selected macroprudential instrument as the transition variable. √√ means that nonlinearity is more statistically significant; — means the test result is not statistically significant.
Parameter Estimation
We conduct parameter estimation analysis to gain further insight into the nonlinear effects. In particular, we use the method of “removing the mean” to eliminate the individual-fixed effects. The nonlinear least-squares method is used to estimate model parameters. Subsequently, we use the grid search method to identify the optimal model, defined as the one that minimizes the sum of the squares of model residuals. The parameter estimation value is regarded as the initial parameter of the nonlinear optimization algorithm, and estimation is based on ensuring the convergence of the model parameters. The results are presented in Table 11. With the exception of Models (26) and (28), all other models demonstrate significance at the 5% level in the remaining nonlinearity tests. We can see that only Models (25) and (26) are significant at the 5% level in both the linear and remaining nonlinear tests, thus fully satisfying the nonlinearity of PSTR. This warrants further examination of the results obtained from Models (25) and (36).
Parameter Estimation Results Under Different Combinations of Explanatory and Transition Variables.

Note.
, **, and * indicate significance at the 1%, 5%, and 10% levels, respectively.
Threshold Effect Analysis
Threshold Effects in the Combinations of DRR and LCR
As shown in Table 11, the coefficients of the linear component (low regime) and the nonlinear component (high regime) of DRR are 1.1737 and −0.6067, respectively. The location parameter, designated as c, is equal to 2.3877. The effect of DRR on the liquidity risk of commercial banks is markedly disparate on either side of the LCR threshold (238.77%). As LCR transitions from the low regime to the high regime, the marginal effect of DRR on LMI diminishes. When LCR is less than or equal to 238.77%, an increase of 1% in DRR results in an increase of up to 1.1737% in the liquidity risk of commercial banks. Conversely, when LCR is ≥238.77%, an increase of 1% in DRR will result in a gradual reduction in the liquidity risk of commercial banks to 0.6067%.
It is evident that LCR has the potential to mitigate the detrimental effect of DRR on the liquidity risk faced by commercial banks. In our sample, over 93% of the LCR samples are below the threshold of 238.77%, indicating that they fall within the low zone regime. Consequently, an increase in DRR has a more pronounced adverse effect on the liquidity risk of the entire commercial banking system. Figure 2 depicts the correlation between LCR and the transition function. It suggests that a significant increase in LCR will only lead to a modest enhancement of the detrimental effect of DRR on the liquidity risk of commercial banks. This indicates that the marginal utility of DRR is greater than that of LCR in terms of managing liquidity risk.

Relationship between LCR and the transition function.
Threshold Effects in the Combinations of MLF and LR
As shown in Table 11, the coefficients of the linear and nonlinear parts of MLF are −0.009 and 0.009, respectively, and c is 0.0658. The effect of an increase in MLF on liquidity risk exhibits a markedly disparate effect on either side of the LR threshold (6.58%). As LR transitions from a low to a high regime, the coefficient of MLF on liquidity risk demonstrates an increasing trend. When LR is less than or equal to 6.58%, an increase of 1% in MLF is associated with a maximum decrease of 0.009% in liquidity risk. When LR is equal to or greater than 6.58%, liquidity risk will be reduced to zero with a 1% increase in MLF. These results demonstrate that the LR of commercial banks mitigates the mitigating effect of MLF on liquidity risk. Given that 58.52% of the sample observations have an LR of ≤ 6.58%, we can conclude that an increase in MLF reduces the liquidity risk of commercial banks. More importantly, a minor increase in LR will greatly influence MLF’s effectiveness for mitigating liquidity risk. Figure 3 illustrates the relationship between LR and the transition function.

Relationship between LR and the transition function.
Robustness Test
In the LSDV analysis, various monetary policy instruments are implemented in conjunction with different macroprudential policy instruments; Tables 3 to 6 present the parameter estimates. It is evident that DRR implemented in combination with LCR, CAR, and LDR can mitigate bank liquidity risk to varying degrees. Additionally, the implementation of RDR alongside each of the four macroprudential policy instruments contributes to reducing liquidity risk. However, none of these effects is as pronounced as the effect of adjusting RDR independently. The effect of SLF in conjunction with LCR is also beneficial. This indicates that the results of the tests conducted after substituting certain monetary or macroprudential policy instruments are significant and consistent. Therefore, the test results of the LSDV model demonstrate robustness.
For the PSTR model, we test robustness by substituting the explanatory and transition variables. The nonlinearity test results presented in Table 10 indicate that 87.5% of the combinations of monetary policy instruments and the four macroprudential policy instruments pass the nonlinearity test. The regression coefficients for Models (25) and (35) in Table 10 are statistically significant. This confirms the reliability of the nonlinear effects of various monetary policy instruments on the liquidity risk of commercial banks when employing different macroprudential policy instruments as transition variables.
Discussion
Most research on the coordination of monetary and macroprudential policies emphasizes macro-level objectives such as price and financial stability (Alejandro, 2019; Cozzi et al., 2020; Nier & Kang, 2016). To enrich the related research, we address a more specific objective: curbing commercial bank liquidity risk. Many studies investigate macroprudential policy as a whole rather than by introducing specific individual macroprudential tools (e.g.,Y. Jiang et al., 2019; Stolbov et al., 2021). It is thus difficult to have sufficient data to judge the effectiveness of these macroprudential policies, and it is not precisely known how to plan the optimal sequence or combination of monetary and macroprudential policies (Alamsyah, 2015). Using linear (LSDV) and nonlinear (PSTR) methods, we consider how these two different policy instruments combine in terms of their types and degree of implementation. Optimal combinations of tools and implementation are identified. This helps advance research in related fields.
Our findings confirm those of Laeven et al. (2022), who noted that the presence of spillovers does not in itself imply coordination. This is attributable to the existence of two spillover effects that work in opposite directions—one that strengthens and another that weakens the effects of monetary policy instruments. The effectiveness and coordination of monetary and macroprudential policies for curbing liquidity risk can be achieved by selecting the appropriate types of instruments to be implemented in conjunction with each other. Goldberg et al. (2020) suggested that macroprudential tools play a limited role, and monetary policy therefore needs to be used simultaneously to address financial vulnerabilities. On the contrary, Agénor and da Silva (2022) argued that monetary policy leads to financial imbalances and thus needs to be accompanied by macroprudential policy. We compare these two approaches, that is, standalone monetary policy adjustment versus combined monetary–macroprudential instrument adjustment. We demonstrate that policy effectiveness hinges on two critical factors: the specific challenges addressed and the instrument combinations employed. Our analysis cautions against overgeneralizing policy outcomes across different contexts.
In line with Kurowski and Iwanicz-Drozdowska (2021), some macroprudential policy tools can mitigate the procyclical effects of monetary policy. However, we further argue that playing such a role is conditional on the fact that the combination of macroprudential and monetary policy tools and the degree of implementation must be circumscribed (e.g., DRR and LCR). When the LCR of commercial banks is below 238.77%, an increase in DRR will nonlinearly increase liquidity risk; when it is above 238.77%, an increase in DRR will nonlinearly lower liquidity risk.
We explain these two nonlinear features as follows. (1) LCR regulations require banks to hold a certain amount of liquidity buffer, which improves banks’ risk absorption, risk-taking, and liquidity creation (Allen & Gale, 2004). Increasing LCR also leads to more stable funding sources and reduces the risk of runs (Diamond & Kashyap, 2016). By contrast, an increase in DRR aims to tighten the monetary base and limit the capital expansion of commercial banks. Its liquidity pressure on commercial banks can be balanced by consuming a part of LCR. However, the marginal utility of DRR is greater than that of LCR. Therefore, only when LCR reaches or exceeds a certain threshold can it offset the liquidity shock brought about by a rise in DRR while ensuring that regulatory requirements are met. Figure 4 illustrates this logic.

Threshold effect of DRR in combination with LCR.
Some studies suggest that increased liquidity risk can lead to adverse selection problems for commercial banks; that is, when banks hold a higher proportion of risky assets to compensate for earnings shortfalls, it entails higher market liquidity risk (Aymanns & Farmer, 2015). Sacrificing liquidity for earnings indirectly reduces the market liquidity of commercial banks. At the same time, an increase in LR directly limits banks’ ability to originate debt when there are funding constraints, exposing them to higher funding liquidity risk (Drechsler et al., 2014). MLF is one source of funding that commercial banks use to alleviate liquidity pressures. An increase in MLF boosts funding liquidity while a higher LR reduces market and funding liquidity, together affecting commercial banks’ liquidity risk. In addition, the marginal effect of LR is larger than that of MLF. This partly explains the nonlinear effect of combined MLF and LR on the liquidity risk of commercial banks. Figure 5 illustrates this logic.

Nonlinear effects of LR in combination with MLF.
Specific individual monetary policies are effective for regulating bank liquidity risk, such as the RDR instrument. Some combinations of monetary and macroprudential policy instruments are also effective. Random tool combinations may be ineffective, but proper implementation can enhance effectiveness and coordination, as demonstrated by the MLF and LR combination. This further supports Goldberg et al.’s (2020) argument that the use of monetary and macroprudential policy instruments and strategies should be restricted. This could broaden the conclusions in the area of policy coordination. At the same time, the effectiveness of the combination of monetary policy tools and macroprudential tools is not affected by economic cycle and banking differences. This could be because macroprudential measures put banks on sound financial footing and tame the financial cycle (Cozzi et al., 2020).
Our findings align with A. Zhang et al. (2020), showing that macroprudential and monetary policies differ significantly in their effectiveness for mitigating systemic risk in terms of intensity and duration. Moreover, their transmission channels for risk regulation demonstrate temporal heterogeneity. These disparities may engender differential marginal utility effects on liquidity risk management between the two policy frameworks. Such variance accounts for the observed nonlinear interaction effects.
Limitations and Future Research
First, we select four monetary policy instruments and macroprudential policy tools. This limited variety of instruments fails to encompass a broad range of tools and their combinations. It is possible that more effective instruments and combinations exist beyond those identified in this study. Future researchers may employ different methods or samples to validate and expand upon our findings. Second, our analysis is primarily static and does not consider the timing of the implementation of policy tool combinations. This issue is similarly overlooked in the vast majority of related studies. In the context of a liquidity crisis, the timing of the introduction of policy instruments may significantly influence the effectiveness of regulation. This matter warrants further investigation. Third, the proposed combination of instruments is independent of the economic cycle, but its effectiveness in extreme crises needs further testing.
Conclusion
This study analyzes the effect of a combined monetary and macroprudential policy approach on mitigating liquidity risk in commercial banks. We evaluate the effectiveness and coordination of 16 monetary–macroprudential policy combinations. The analysis is based on quarterly data from 41 publicly listed Chinese commercial banks spanning 2014 to 2022, employing two econometric approaches: LSDV and PSTR.
The LSDV analysis shows that, first, the effectiveness of the implementation of monetary and macroprudential policies for regulating bank liquidity risk depends on a reasonable combination of tools (i.e., DRR with LCR, CAR, LR, and LDR). The combination of SLF and LCR can mitigate bank liquidity risk. This policy synergy reveals a dynamic interplay between regulatory instruments during implementation. Such interaction demonstrates that macroprudential frameworks, when introduced, create measurable spillovers affecting the operational effectiveness of monetary policy mechanisms. Moreover, this effectiveness does not change significantly with changes in the economic cycle or individual bank differences. Second, effectiveness does not mean coordination since some macroprudential policy tools can weaken or undermine the effectiveness of monetary policy tools. An increase in LR will slightly reduce the effect of DRR on banks’ liquidity risk, even though the combined effect of the two is effective for curbing liquidity risk. Additionally, the positive effect of RDR on bank liquidity risk becomes negative when combined with LDR. A special case also exists, that is, the RDR instrument is not suitable for adjustment alongside any macroprudential policy instrument.
Such effectiveness and coordination only reflect what can be achieved by a mix of tool types, not accounting for the degree of tool implementation. The findings of the nonlinear PSTR test indicate a significant threshold effect in the interactions between DRR and LCR, as well as between MLF and LR. Banks with an LCR below 238.77% are more susceptible to liquidity risk when the central bank raises the DRR. For commercial banks with an LR above the threshold (6.58%), an increase in MLF increases liquidity risk. The economic intuition behind the threshold effects is that the LCR threshold of 238.77% represents dynamic equilibrium between commercial banks’ liquidity buffers and policy constraints. An LR threshold of 6.58%, meanwhile, signifies the critical point of interaction between banks’ risk-taking behavior and policy instrument effectiveness. This highlights the marginal utility game and asymmetric interaction between monetary and macroprudential policy tools.
Our findings have the following implications for policy. First, the coordination of instrument types does not equate to the coordination of implementation levels. Regulating liquidity risk in commercial banks requires a rational combination of monetary and macroprudential policy instruments and their implementation (e.g., DRR with LCR, CAR, LR, and LDR; SLF is associated with LCR). Second, to optimize the effect, an increase in DRR could be accompanied by an increase in the requirement for LCR to 238.77%. Increasing disbursements from MLF while reducing LR to below 6.58% also contributes to mitigating liquidity risks. Third, the effectiveness of these strategies is not affected by normal fluctuations in economic cycles.
Footnotes
Acknowledgements
First and foremost, I would like to express my sincere gratitude to my supervisor, Prof. Huang Yingjun, for his careful guidance and valuable suggestions throughout the study. I also thank doctoral student Zhang Gencheng for his help in analyzing the empirical data. I would also like to express our sincere gratitude to the reviewers for their insightful comments, which helped us to continuously improve the paper.
Ethical Considerations
This study did not involve animal or human research and therefore no ethical statement was required.
Funding
The authors received no financial support for the research, authorship, and/or publication of this article.
Declaration of Conflicting Interests
The authors declared no potential conflicts of interest with respect to the research, authorship, and/or publication of this article.
Data Availability Statement
Data available on request from the authors.