
Abstract
We examine the relationship between market performance of leading cryptocurrencies (Bitcoin and Ethereum), meme-stocks (AMC, GameStop), and subjects of corporate boycotts (Bud Light) using weekly market price and volume data along with social media data of weekly mentions (which total 337 million in this dataset) and net sentiment. Using vector autoregression (VAR) time series analysis along with Granger causality testing and structural breaks, we successfully predict trade volume of these various assets using social media data and price data. We also find that closing price data and trade volume are reliable predictors of net sentiment about crypto in online and social media. However, we struggle to predict the closing price for the group of assets studied. We also employ impulse response functions, finding evidence of a dynamic relationship occurring between online and social media net sentiment and online media volume with closing price and trade volume. These functions show that investor sentiment operates with a short memory lasting around 3 weeks, additionally these functions show that price generates a shock on trade volume but that crypto and meme-stock markets experience this differently. Our findings reinforce the notion that meme-stock traders and herd investors do not trade on market fundamentals but are instead sensitive to herding (or sentiment) movements. Our findings also suggest that compared to these meme-stock investors, crypto markets have more traditional motivations of loss aversion.
Plain language summary
This paper analyzes relationships between market performance and online and social media data on a group of assets consisting of cryptocurrencies and stocks. By collecting social and news media posts about these assets, we examine the amount of mentions and tone (or sentiment) of the posts and compare this with trade volume and prices of the assets. In doing so, we examine relationships between the assets and discussions about them occuring online. We find that online media, combined with prices, can successfully predict trade volume, a finding that risk managers and portfolio analysts will find useful. We also find that online discussion reacts to events impacting the assets. We struggle to predict the closing price for the group of assets studied. We also find evidence of a dynamic relationship occurring between online and social media net sentiment and online media volume with closing price and trade volume. This suggests that investor sentiment operates with a short memory lasting around 3 weeks, additionally this show that price generates a shock on trade volume but that crypto and meme-stock markets experience this differently. Our findings reinforce the notion that meme-stock traders and herd investors do not trade on market fundamentals but are instead sensitive to herding (or sentiment) movements. Our findings also suggest that compared to these meme-stock investors, crypto markets have more traditional motivations of loss aversion.
Introduction
Recently, online communities with a focus on investing have emerged, some growing rapidly (Andersson, 2020; Vasquez & Cross, 2024). Online investor communities have emerged; some of these are largely devoted to passive conversation about markets, while others operate as platforms to facilitate investment actions (Vaughan et al., 2023). Concurrently, increasing numbers of people are using social media to collect key information to their investment decisions (Duré, 2024).
Leveraging the relationship between social media and the stock market, previous research offers a variety of techniques that use social media data to predict and or explain stock performance, namely trade price and volume (Cahine & Malhotra, 2018; Piñeiro-Chousa, et al., 2016). Expanding upon this prior research, we study the temporal relationship between social media activity pertaining to specific assets and the trade volume and price of these assets. We also seek to determine major changes in the time series by testing for structural breaks (Bai & Perron, 1998). Use of structural break testing builds upon previous studies, allowing us to determine if the breaks coincide with notable events germane to the assets we study, which occur during data collection (Malik, 2011; Ndako, 2012).
We chose our investments to determine the degree to which we can observe how these online communities operate and forecast what happens next to the stock over time using Granger hypothesis testing. Specifically, we examined two leading cryptocurrencies (herein cryptos): Bitcoin (BTC) and Ethereum (ETH), in addition to the stocks for retail brands American Multi-Cinema, Inc (AMC), GameStop (GME), and Bud Light (BUD).
Cryptos have increased in prevalence and popularity, riding a decade-long rise in value for leading coins like BTC and ETH (Siripurapu & Berman, 2024). Social media serves an important information exchange platform for these cryptos (Xie et al., 2020). The increase in popularity and value has been accompanied by the proliferation of cryptos and tokens (De Best, 2024). Crypto markets, including bitcoin, have been volatile, having experienced plummeting prices in 2022 (Siripurapu & Berman, 2024). By early 2024, bitcoin had returned to its pre-2022 peak. It was suspected in 2022 that the slowing economy and rising interest rates reduced the demand for cryptos (Winters, 2022). This price decline corresponded to mounting financial troubles for crypto trading platforms including FTX, causing their collapse (Napolitano & Cheung, 2022). Widespread levels of fraudulent financial management were found by law enforcement by the US Securities and Exchange Commission (SEC) and the US Federal Bureau of Investigation (FBI) (US Department of Justice, 2024; US Securities and Exchange Commission, 2023).
The stocks of AMC, GME, and BUD were cast into the spotlight in the last several years due to the consequences of herd investing facilitated by online communities devoted to investment. These circumstances make them ideal candidates for structural break testing. Online communities devoted to investment have enabled individuals to access herd investing strategies (Di Muzio, 2023). In the past few years, investor herds have generated investment crowds, resulting in allegations of market manipulation (Gale, 2022; Steiner, 2021). Perhaps the most prominent herd investor movement of recent years was the Reddit community r/wallstreetbets mania over the stock of GameStop (Goldin, 2021). GameStop is a brick-and-mortar video game retailer. Like many in the brick-and-mortar retail industry, it had fallen on hard times (Stewart, 2024). Institutional investors (large funds, insurance groups, or endowment managers) on Wall Street took notice and increasingly bet on the continued decline of the stock price through a financial option known as a short (Li, 2024; Charles Schwab, 2024). As opposed to a “long position” in which investors buy a security, a “short position” involved making these bets on a security you do not own (investor.gov, 2025).
Individual retail investors who congregate in communities like r/wallstreetbets took notice and sought to exploit the positions taken by Wall Street institutions. Some of these retail investors claim to be doing it not for financial gain, but to fight injustice (Bernard et al., 2022). By conspiring to buy mass amounts of GameStop stock, they could increase the price, ruining the shorts placed by large investor groups which would cause the institutional investors to incur heavy financial losses (Stewart, 2024). This sort of investor mania has drawn attention from news sources, lawmakers, and law enforcement (Goldin, 2021). While investor mania is not new, our ability to observe it through social media listening is novel.
GameStop (GME) is perhaps the most well-known investor mania event that played out in the social media space, but AMC experienced a similar situation (Lynch, 2021; McCabe, 2021). The SARS2/COVID-19 pandemic came at the end of a decade in which the movie theater industry saw declining consumer demand (Elder, 2016). The emergence of the COVID-19 pandemic saw nearly a total collapse of demand for movie theaters in the short run, while streaming platforms saw a growth in subscriptions (Korsh, 2020). News agencies began to report and debate whether this was the death knell for theaters (Heer, 2020; Vannatta, 2020; Zacharek, 2020). Institutional investors placed short options on the GME stock, only to be thwarted by the r/wallstreetbets community. A top beer brand, Bud Light (BUD) offers another case study. BUD suffered a boycott from the American right wing political movement in response to an ad campaign featuring an individual who is trans as a spokesperson (Selyukh, 2023). Calls for the Bud Light boycott spread through social media (Selyukh, 2023).
Understanding herding behavior and how to spot it is crucial for retail investors, institutional investors, and regulators (Arsi et al., 2021). Investor herds are perhaps a natural result of the technical and overwhelming nature of information in financial markets. Research has found that herds expedite information dissemination (Chen et al., 2024). However, some have found that herds decrease information efficiency among retail investors (Yang et al., 2023). Investor herds can be problematic; previous studies have shown that herds lead to inefficiencies in pricing and high levels of volatility in markets (Choi et al., 2022). However, the nature of herding (and its causes) is not always straightforward. We know from previous studies that herding is present in crypto markets (Arsi et al., 2021) and in meme stocks (Aloosh et al., 2021). Previous research on herding in investor communities finds that in the case of cryptos, herds respond to fundamental information and shocks to an investment such as cyber-attacks but that events causing global uncertainty, such as COVID-19, do not induce herding (Yousaf, et al., 2021).
Understanding the relationship between investor sentiment and herding behavior is crucial, as the sentiment can be a signal of speculative activities in markets (Sibande et al., 2023). Herding is not to be considered the norm, as some markets and specific conditions may trigger herding or anti-herding behavior (in which contrarian investors seek to act against the prevailing sentiment) (Sharma et al., 2024; Sibande et al., 2023). Herding behavior, while not limited to using social media for information exchange, is commonly studied on social media platforms. Social media is not only a signal of investor herding, it can also serve as the primary platform of informaiton dissemination. Sentiment on social media posts has been found to have a positive relationship with retail investor herding (Li et al., 2023; Yoon & Oh, 2022; Yang et al., 2023). A study in China found the volume of posting has been found to have a negative relationship with herding behavior, while herding behavior generally shows a positive relationship with volume of posts (Zhou & Liu, 2022). This paper builds upon previous studies that identified herding by employing dynamic models to examine how agents react to it. We do not examine more traditional investments such as “blue-chip” stocks or mutual funds for two reasons. A blue-chip stock is generally considered reliable because it is associated with a brand that can generate income in most business environments (Chen, et al., 2024). First, these stocks are market leaders, popular investments, and generally assumed to be more stable (Corporate Finance Institute, 2024). Secondly, these are well researched in previous studies (Cahine & Malhotra, 2018; Smith & O’Hare, 2022). We employ vector autoregression (VAR) to build a Granger causality test to determine if one time series provides useful information in predicting another (Wei, 2013). The VAR is a dynamic model which enables researchers to predict the current value of a variable using its own previous (or lagged) values (Sims C. A., 1980; Stock & Watson, 2001). One of the attractive features of the VAR framework is that we do not need to have a comprehensive knowledge of market forces that would be required for structural estimation, and we can accommodate auto- and cross-correlation in the time series, making VAR models useful to study risky assets (Mai, et al., 2018). The VAR approach is complementary to Granger Causality testing, which indicates to us how well a certain time series can predict another time series (Granger, 1969).
Contributions of this study help broaden understanding of relationships between social media activity and asset performance data in cryptocurrencies and meme stocks. Furthermore, this paper builds upon previous literature investigating econometric relationships between social trends and buying behavior, similar applications include social media and cruise liners (Lai, Bir, & Widmar, 2023) as well as research into social media as a performance measure (Widmar, et al., 2020).
Methods and Data
With the rapid growth in online and social media data and the tools to collect and analyze that data, researchers have begun to investigate how ‘listening’ to social media conversations can advance our understanding of market phenomena (Jung, et al., 2021; Jung, et al., 2022; Ortez, et al., 2022; Widmar, et al., 2022; Jung et al., 2023). Published research has analyzed online and social media to study stock price movements for major entertainment companies, including for cruise companies during the COVID-era (Lai, et al., 2023). Social media data can be useful to examine markets due to the temporally varying nature of observations; to that effect, this paper builds upon work studying US dairy market outcomes using social media insights (Ortez, et al., 2022). Similar studies have documented the stocks of leading tech blue-chip stocks (Awan, et al., 2021; Coelho, et al., 2019; Nguyena, et al., 2015). This analysis employs data collected from the Quid Monitor Platform (formerly known as Netbase). This platform enables researcher-specified searches of online and social media data, as well as providing Natural Language Processing (NLP) capabilities for the analysis of the sentiment of search results.
Data collection for this analysis was completed in two stages. First, two separate data collections returned search results consisting of online and social media posts regarding two distinct topics: cryptocurrencies (Bitcoin and Ethereum) and stocks (AMC, GameStop, and Bud Light). A mention is a soundbite related to the subject matter being studied and typically constitutes a part or whole of a post, both of which are collected by the Quid platform (Quid, 2024). For the purposes of this analysis, we focus primarily on volume of mentions.
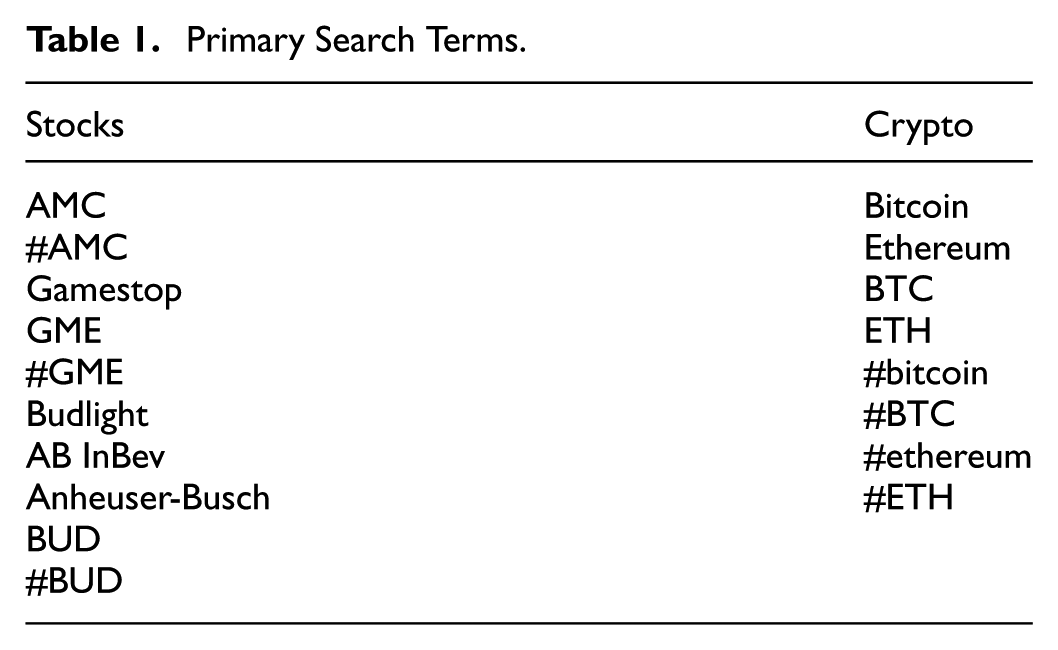
To identify a mention that fits within one of our two topics, we first need to specify keywords for a list of primary inclusive search terms as well as exclusionary terms. Primary search terms for each of the two topics are detailed in Table 1. Mentions of each asset are isolated in the secondary sub-search, which was parameterized by search terms presented in Table 2. Given the informal and fast-moving nature of social media, some results stemming from the included terms can be outside of the connotation we seek to study, use jargon, use puns, and potentially use cultural references that are difficult to interpret. As such, search tuning is employed on each of the topics and thematic sub-searches to exclude terms and phrases that return search results that are irrelevant to the study. These researcher-identified exclusionary terms are detailed in Appendix 1. Many of these excluded references were unrelated to crypto and the specific assets we study. Use of the stock ticker for Bud Light (BUD) as an inclusionary search term created a few challenges, and the need for exclusionary criteria, as “bud” is a common expression for a friend. Other exclusions pertain to internet users who use large and varied hashtags to improve the visibility of their posts, but did not post content related to the subject matter of this research.
Primary Search Terms.
Thematic Secondary Search Terms.

In addition to capturing mentions, Quid assigns sentiment to each post, which reflects the tone of expression and the context of use (Quid, 2024). Quid classifies posts as either positive, negative, or neutral and offers a metric called net sentiment, which reflects the ratio of positive to negative posts in each period (Quid, 2023). Because the net sentiment score is a ratio, its range of values is necessarily bound [−100, 100].
We collected weekly data for mentions and sentiments related to our stocks (AMC, GME, BUD) and cryptos (BTC, ETH). Our data included posts originating between January 1, 2020, at 12:00 AM EST, until December 31, 2023 11:59 EST. Data collection occurred in early February 2024. Beyond defining specific terms to be included and excluded in our search, we also limited our search to posts in English originating in the US and US minor outlying islands. In total we collect 268,631,641 posts about the cryptos and 42,268,682 posts about the meme stocks we study.
Time Series Analysis of Social Media and Market Data
A secondary dataset was obtained from Yahoo finance, containing weekly closing prices and trade volumes of our assets (Yahoo Finance, 2024). The decentralized nature of crypto currency markets makes crypto asset information trickier to work with than stocks which are listed on specific exchanges. In this case, it is ideal to rely on Yahoo finance due to their transparency. The data can be collected by any party, and they keep a comprehensive list of exchanges and markets covered in their data (Yahoo, 2025). By integrating this secondary dataset, we were able to study online and social media activity alongside financial market outcomes. Descriptive statistics on the variables in our stock set are in Table 3. Figures 1 and 2 show market data (stock market prices and trade volume) and online media data (mentions and net sentiment), respectively for the stocks and cryptos studied.
Descriptive Statistics on Our Variable Set.


Market data on each of the five assets. (a) AMC market data. (b) BUD market data. (c) GME market data. (d) BTC market data. (e) ETH market data.

Media data on each of the five assets: (a) AMC in online media. (b)BUD in online media. (c) GME in online media. (d) BTC in online media. (e) ETH in online media.
First, all variables were subject to the Augmented Dickey-Fuller test to determine if they are stationary (Dickey & Fuller, 1979). Stationarity in a time series is an important qualifying assumption for analysis because we assume that our data are statistically constant over time (Yuan et al., 2021). A stationary time series exhibits behavior such that its properties do not change over time; effectively, a stationary time series should have the same average and standard deviation regardless of the period sampled from it (Nau, 2020). The null hypothesis of a Dickey-Fuller test is that the time series is not stationary; in this case, the time series would exhibit what is called a unit root or a stochastic trend (Rajbhandari, 2016). The alternative hypothesis is that the time series is general or trend stationary. In the case that a time series is not stationary, first differencing is employed on all series (all variables on all stocks, not just the one that is not stationary), and the combined series are retested (Dickey & Fuller, 1979). First differencing is a technique to isolate the changes of a time series from its initial period to its next period, and so on (Nau, 2020).
Then, a Bai-Perron test is conducted to determine the existence of structural breaks within the data, using all variables (Bai & Perron, 1998). The Bai-Perron test signals when an abrupt change in the time series occurs (Stata, 2024). The null hypothesis of the structural break test is that there are no structural breaks in the time series, alternatively the test would determine the existence of structural breaks. In the results, we compare structural break events to the content of social media posts occurring contemporaneously in an attempt to provide context to the break event.
We construct a VAR for each asset (GME, AMC, BUD, BTC, and ETH) and then apply a Granger Causality test to determine the relationship between sentiment, mentions, closing price, and trade volume. Granger causality is perhaps the most useful technique to explain and understand a time series dataset (Tabari, et al., 2018). For example, Xia et al. (2023) showed Granger causality from news sentiment on stock returns (Xia et al, 2023). When examining the relationship between two or more variables, it may be useful to ascertain the direction of causality. The Granger causality test helps determine this direction and if feedback exists (Granger, 1969). Granger causality detects if a given variable is useful to forecast another variable related to the same stock or commodity (Granger, 1969). Note that Granger causality is limited to using one time series to predict another, and that results of the Granger test cannot establish true causality (Shojaie & Fox, 2021). Granger causality tests incorporate the null hypothesis states that two variables can’t be used to predict one another. The alternative hypothesis in the Granger causality test says that one variable can be used to predict another, to this effect we would state that they are Granger-causal.
To better understand relationships in the VAR equations, impulse response functions (IRF) are constructed and plotted to examine the response of one variable to a shock in another (Sims, 1980). IRFs have more recently proven useful in examining relationships between social media activity and exogenous (but related) activities in various applications, including tourism and investor sentiment (Behrendt & Schmidt, 2018; Polyzos et al., 2024). This study builds in part upon Behrendt and Schmidt (2018) by examining a more specific subset of assets and by investigating more closely the relationship between our variables (mentions, sentiment, closing price, and volume), instead of trying to predict volatility.
Our methodology, employing structural break testing, VAR, Granger causality testing, and impulse response functions builds on a host of literature in our context where we study sentiment in online media against stock and crypto returns. Previous research in the Indian stock market has shown that investor sentiment has a positive effect on market returns both at present and considering sentiment from one month prior (Yadav et al., 2022). Similar research on Bitcoin has found that causality only appears during periods where the market is volatile (Hang & Zhang, 2021). Similar research specific to investments and online media sentiment finds that structural breaks in online sentiment do not generate changes in the price of the assets and that sentiment is a poor predictor of asset performance (Xie & Wang, 2017).
Results and Discussion
Market and media data are shown in Figures 1(a–e) and 2(a–e), respectively. The events which we study in meme-stocks (AMC, GME) are readily apparent in Figures 1a (AMC) and 1c(GME), where we observe spikes in trade volume and price during speculative periods. Corresponding to these periods, we see spikes in count of weekly mentions in online media in Figures 2a and 2c. While the Budlight boycott does not generate such obvious spikes in market data (Figure 1b), we see the initial shock and the subsequent decline in intensity quite clearly in Figure 2b, both in the mention count and net sentiment.
Many of the time series initially contained a unit root (per Table 4), but first differencing was successful at stabilizing the time series, as shown in Table 5. Results of the VAR are detailed in Appendix 2 and Appendix 3. Granger causality tests (shown in Table 6) on cryptos show that closing price and volume are reliable predictors of net sentiment. In other words, we show that we can observe market events and predict sentiment reactions on social media. However, we are not able to predict the number of mentions using price and volume data. This confirms the findings of Behrendt and Schmidt (2018), which shows that information exchanged on twitter (X) proved useless for investors, and sentiment from twitter did not help explain or forecast market outcomes on the Dow Jones Industrial Average. Closing price is difficult to forecast using social media mentions and sentiment, regardless of whether it is combined with data on trade volume, consistent with previous studies (Ciganovic & D’Amario, 2023).
Results from the Augmented Dickey-Fuller Test on Initial Data.

Note that p-value >.05 indicates a unit root (or non-stationary time series).
Results from augmented Dickey-Fuller test on data after first-differencing.

Note. p-value >.05 indicates a unit root (or non-stationary time series). We can see that first differencing successfully delivered a stationary time series.
Results from Granger Causality Tests on variable sets.
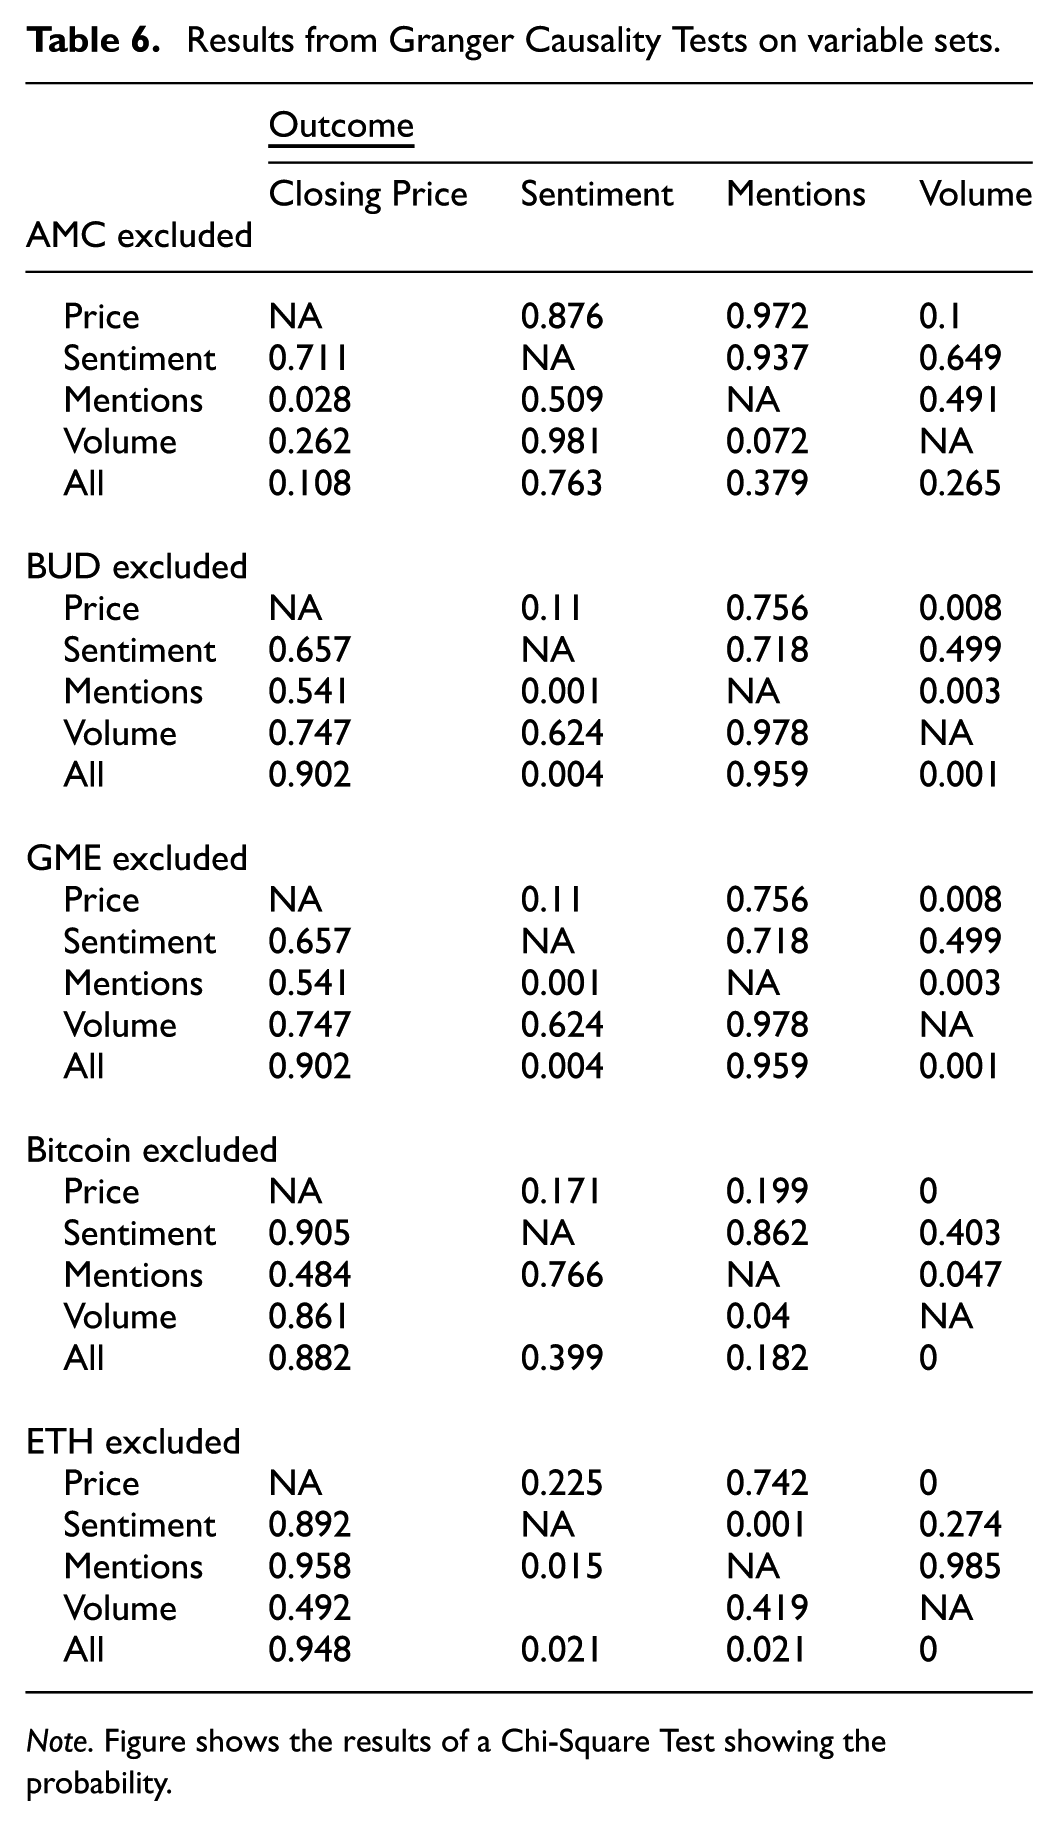
Note. Figure shows the results of a Chi-Square Test showing the probability.
Some studies have found significant bi-directional relationships when examining stock market and investors’ web search activity and between news and microblogs and stock market activity (Jichang et al., 2020), but our analysis did not find significant bi-directional relationships. As one might expect, we find that when stock prices rise, so does investor sentiment, and when stock prices fall, as does investor sentiment, which tends to be forward looking (Liu et al., 2023). This is intuitive to the extent that investors would be attracted to assets signaling momentum (in returns) and averse to losses. Indeed, previous and similar research has similar findings (Cookson et al., 2025; Mounira & Henchiri, 2023).
Structural Breaks
With stationary series, the Bai-Perron test finds structural breaks (which are detailed in Table 7) by testing the highest number of breaks for which the null hypothesis (no structural breaks) is rejected (Bai & Perron, 1998). These breaks are not determined by any one variable alone but by examining the time series associated with each of the variables, which cluster around a stock or cryptocurrency. These break dates reflect an instance of abrupt change in patterns exhibited by our variables. Upon determining the dates of the structural breaks, we searched within the social media and market data to determine and verify events, including headlines in search results related to the structural break events.
Results of Structural Break Tests on Our Variable Sets Provided by Date in Chronological Order.

In the case of each stock (AMC, BUD, GME), there is a single event registering a jump in mentions of significantly larger magnitude than any other single event. These notable surges in volumes of mentions clearly coincide with either short squeeze events (AMC, GME) or boycotts (BUD). Each brand also has a series of other, more minor structural break events where the observed variables register a large deviation from their normal patterns. These minor events are usually related to structural features of brand management, instead of social media mania. This suggests that brands are having success driving publicity on social media, but they remain vulnerable to exogenous events (like a short squeeze or boycott) that may overshadow the effects of their own marketing or branding efforts.
AMC structural breaks are detailed in Table 7. In the week of October 13, 2020, AMC’s financial disclosures led to fears of insolvency as early as the end of the calendar year 2020 (Pallota, 2020). This event is not the major event of the year for AMC on volume of mentions about AMC on social media, instead, there is far more discussion in spring and summer of 2020 about the closure and reopening of AMC theatres (Lang, 2020). AMC share prices began to rise in early 2021 in a short squeeze event around the same time as the initial GameStop short squeeze (McDowell, 2022). As the first half of 2021 wore on, individual investors noted that short bets were being placed on AMC again, setting the stage for a much larger short squeeze in May and June 2021 (McDowell, 2022). The short squeeze is observed in our market and media data; a structural break is identified in our time series occurring in May of 2021. In late February 2023, investors sued AMC over their decision to initiate a preferred shares program called APE, and to hold a vote on increasing the common stock count (Reuters, 2023). On March 14th, 2023, that vote was held and passed (Business Wire, 2023).
Bud light structural breaks are shown in Table 7. Bud light gained some notoriety online on August 17, 2020 (the first of our structural breaks) for announcing their bid to become the official state beer of the US state of Utah (Stephenson, 2020). This first structural break is not clearly found in our social media data. In September of 2022, bud light came within the crosshairs of Forbes who noted the stock price fell for the month leading up to September 6th of that year, but they suggested it was undervalued (Trefis Team Forbes, 2022). However, this article does not rise to the top of collected social media mentions.
Another structural break event occurs in April of 2023 and clearly registered in our social media dataset. Bud light launched an advertising partnership featuring a spokesperson who is a transgender influencer, Dylan Mulvaney (Liaukonyte et al., 2024). Conservative groups on social media were quick to call for a boycott. In our data of weekly net sentiment, this event/occurrence is easily visible/discernible. In the first 13 weeks of 2023, we see an average weekly net sentiment (which ranges −100, 100) of 59. In the ensuing 13 weeks following the start of April, we see an average of −26.5. By the end of July 2023, Bud light weekly sentiment scores return to their pre-boycott levels. This indicates a quick recovery in the sense of online and social media net sentiment from the boycott for the brand, but reports in media suggest sales have yet to recover as of mid-2024 (Snider, 2024).
GameStop structural breaks are also detailed in Table 7. GameStop’s stock prices first rapidly accelerated to its all-time high on January 29th 2021, before quickly crashing. It rebounds again to a second peak on March 12th, which was the same week US congress passed a second round of COVID stimulus checks (Denham, 2021). As 2022 waned, so did the GameStop hysteria, although the retailer was not forgotten. In summer of 2022, GameStop launched an NFT trading platform, a leadership transition, and a stock split (cutting each share into 4); market speculators began wondering about the next short squeeze opportunity (Arrieche, 2022). In early August, GameStop was sued by former consultants for roughly $30 million in unpaid fees (Zambonin, 2022). While we identified the structural break event in our data, there was not much movement in online media data, such as a spike or drop in mentions and/or net sentiment. Instead, we saw large swings in trading volume in August of 2022; roughly 40% increase in trades the week of 8/8 and 8/15, followed by a 55% drop in trades the week of 8/22/22. This could reinforce the notion that discussion of GME is related to anticipating decisions on buying and selling, and less focused on the fundamentals of corporate valuation. Lastly, a structural break is observed in early March 2023, which was likely caused by reports of cheap and low levels of debt, along with an unexpected profit, reports that were met favorably by investors and on social media (Zambonin, 2023).
Structural breaks in the Bitcoin time series are detailed in Table 7. In October of 2020 a slew of news stories emerged regarding bitcoin. PayPal enabled trading of bitcoin on October 21, 2020, and JP Morgan Chase & Co. announced bitcoin use for commercial transactions on October 27th (Russell, 2020). That same week, Coinbase launches a US debit card offering cash back rewards in the form of Bitcoin (Roberts, 2020). Additionally, LibertyX, which offers in-person bitcoin sale, announced they would begin selling the product in ATMs around the US (PR Newswire, 2020). Top social media posts on Bitcoin in 2020 do not invoke these events, instead they largely focus on reports of energy usage related to crypto or scams. Bitcoin had another structural break identified in March of 2022. Issues of energy intensity and the environmental footprint of bitcoin again emerge as dominant news stories as industry advocates looked to improve their brand image (Yaffe-Bellany, 2022). Additionally, bitcoin began to play a role in the Ukrainian War, helping the Ukrainian government raise funds to fight the Russian invasion (Al Jazeera, 2022). Curiously, the structural break test did not suggest dates related to the collapse of FTX or milestones in criminal cases against the leadership of FTX which began in November 2022 and continued through the high-profile conviction of FTX founder Sam Bankman-Fried on March 28, 2024 (US Department of Justice, 2024).
Ethereum structural breaks are detailed in Table 7, although the real-world events or causes of Ethereum structural breaks were difficult to identify. Ethereum did not enjoy the volumes of mentions in the online and social media search results that bitcoin did until passing it in mention count in 2023, but Ethereum always maintained a higher annual average sentiment score through the study period. In August of 2022, Ethereum announced a revamping or “merge” to ‘proof of stake’ format, which some claim will be more environmentally friendly, but others disagree (Ackermann, 2022; Ho, 2023). This event was notable in our social media data collection, triggering a one-week spike in mentions (+34%) compared to the week prior.
Impulse Response Functions
Figure 3 shows that the impulse response functions are consistent across the assets studied, indicating a similar relationship for cryptos and meme-stocks. In every single case investigated, when plotting IRFs for each asset, meaningful dynamics are only found on impulses of sentiment on trade volume and closing price on trade volume as the response variable. Otherwise, IRFs were flat, indicating no significant response between impulse variables and response variables.
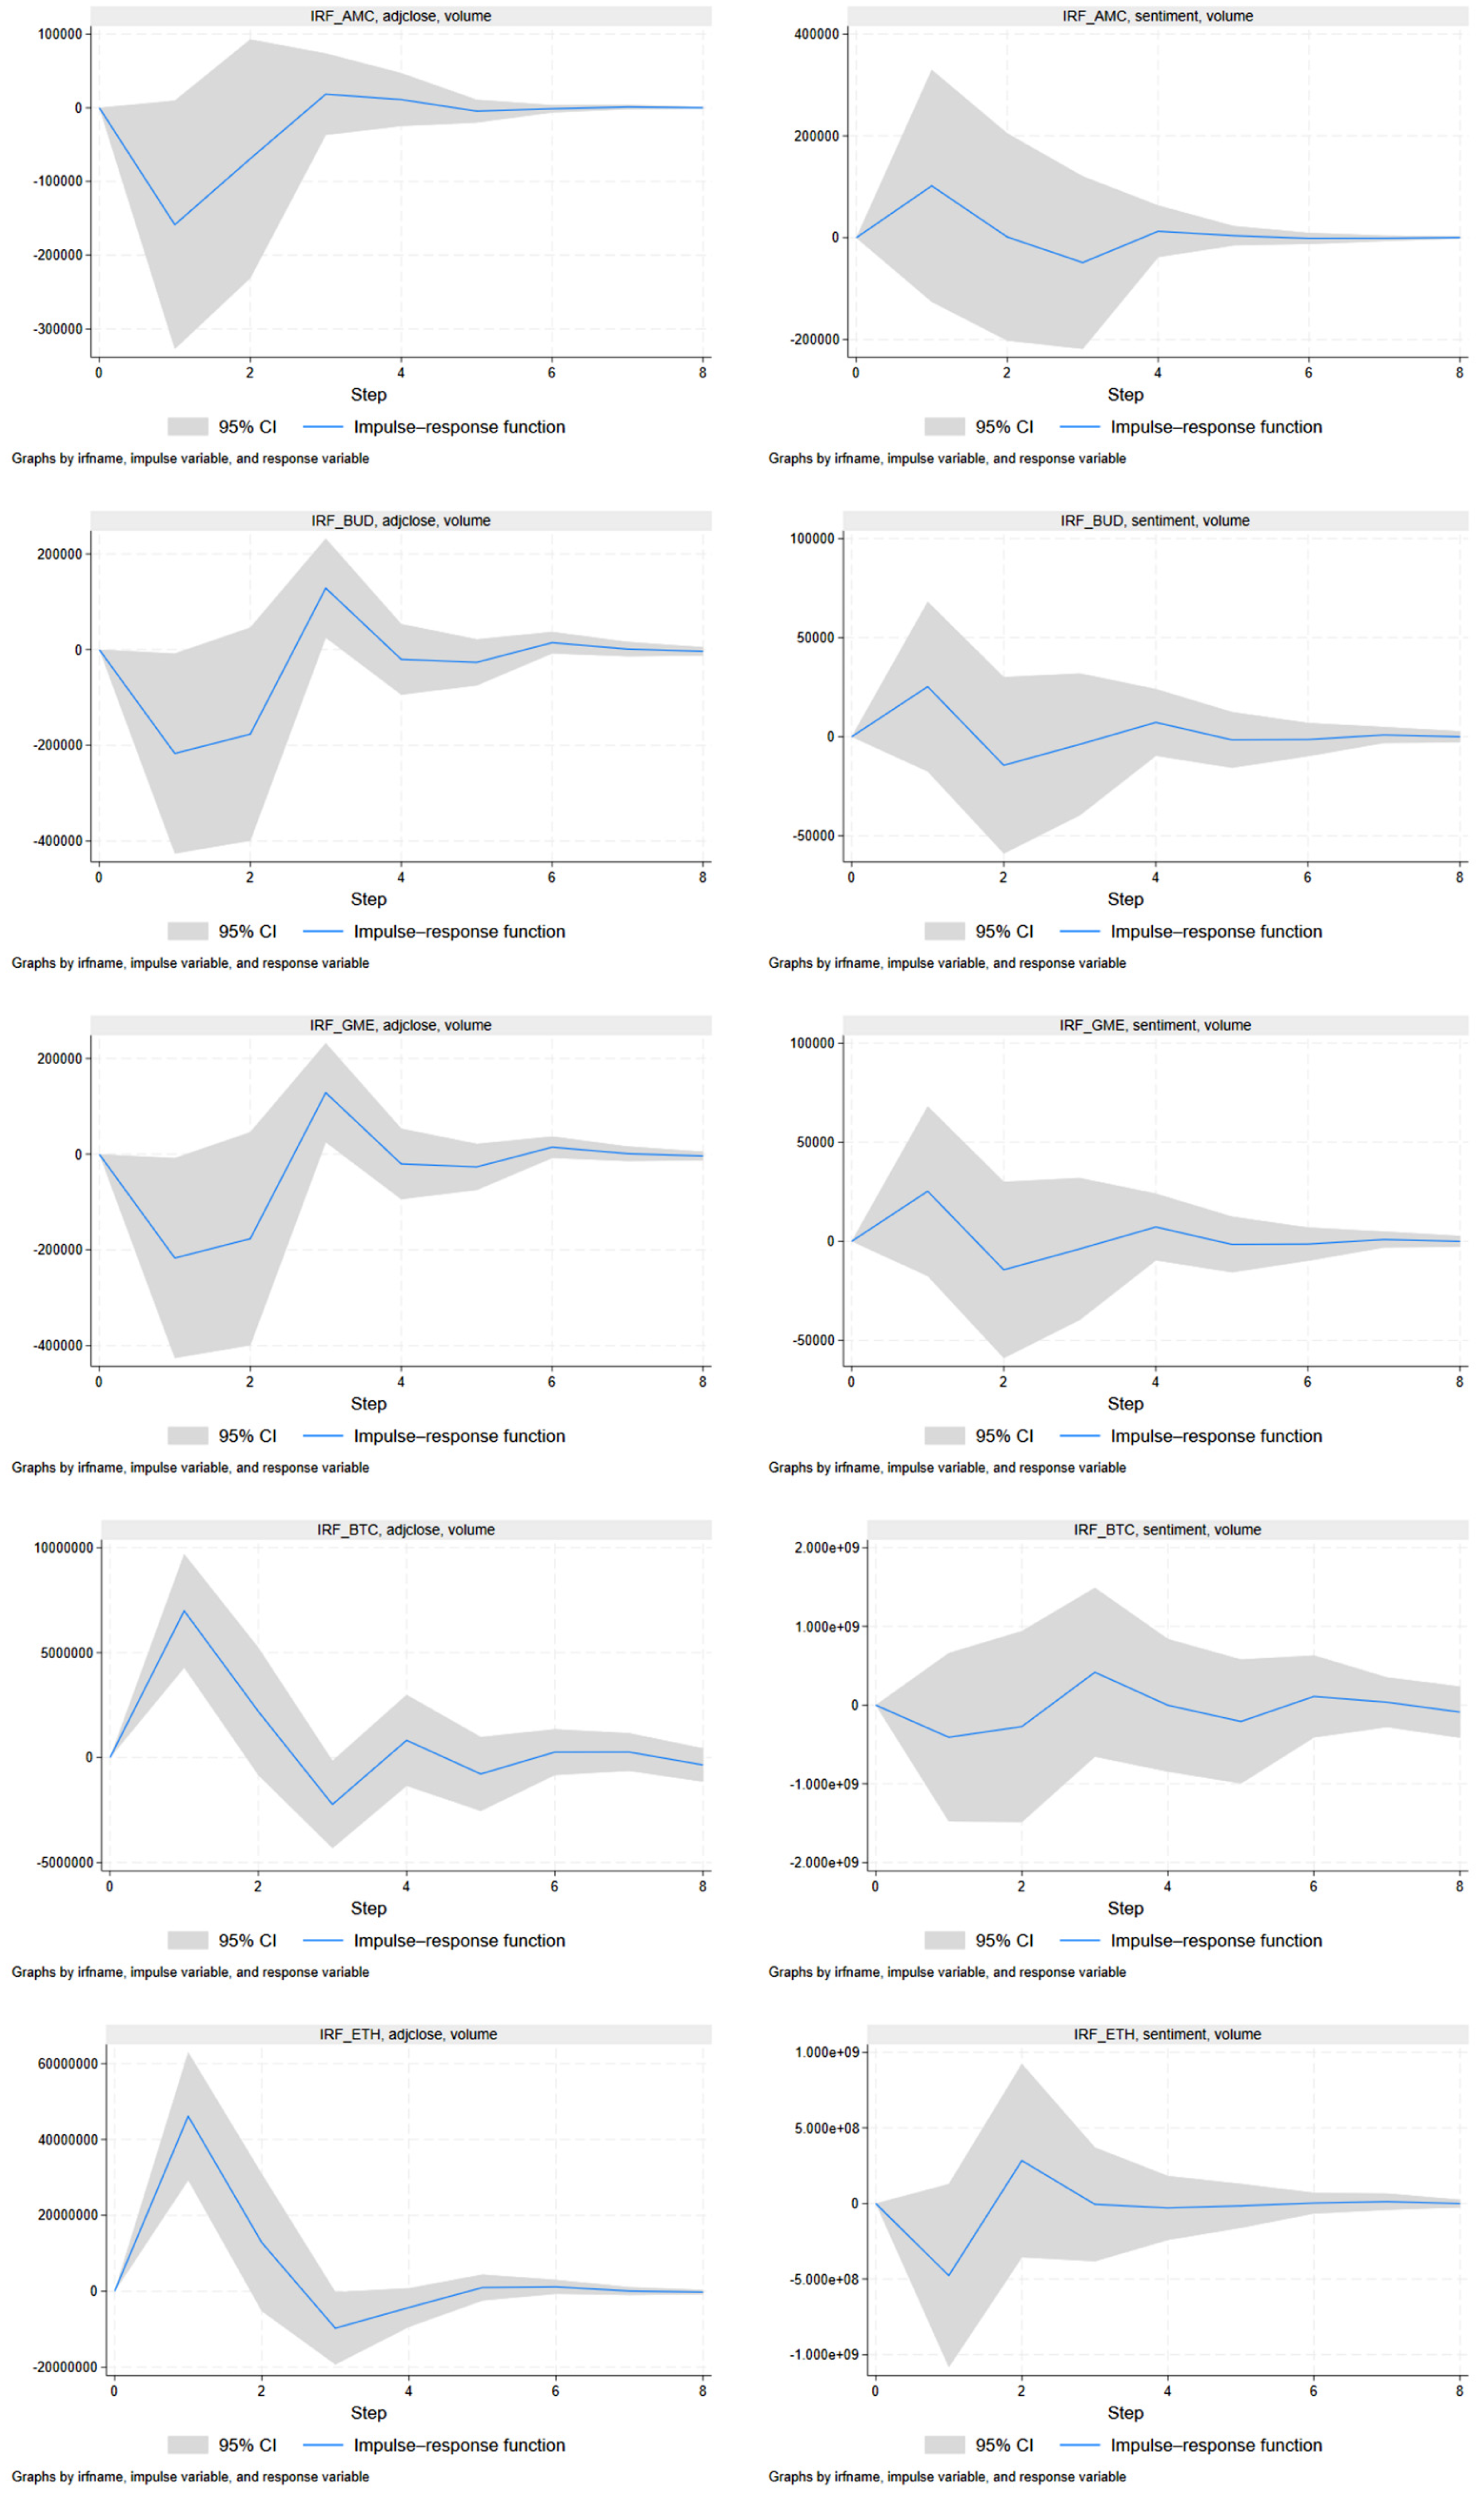
Impulse response functions for selected variables.
Trends in the initial shock may be worth examining as they are not always consistent across assets. In the left column of Figure 3, we see cases where we shock closing price and see the response on trade volume. The blue line shows the impulse response function and the shaded part of the graph indicates the confidence intervals. The effect of the price shock is different between asset classes (stocks versus cryptos) but similar within asset classes. With the stocks, the initial shock to the trade volume is negative, indicating that an increase in the closing price will be followed by a drop in the trade volume that rebounds in weeks 2 to 4. In cryptos, we see the opposite behavior. An increase in the closing price is followed by an increase in trade volume the following week, which is attenuated early in the second week. Note that the confidence interval is much tighter for the cryptos than the stocks, indicating a higher degree of certainty for our IRFs on cryptos.
Economically, we find that this initial shock of price on volume in cryptos is intuitive for much of the same reasons discussed previously; investors should be responding to market momentum and simultaneously seeking to shun losses. Our findings confirm those of similar research, which found crypto markets to engage in highly speculative behavior (Grobys & Junttila, 2021) and studies that have found that Bitcoin and Ethereum share a positive contemporaneous relationship between trade volumes and prices (Ghabri & Gana, 2023). Note that in the IRFs (Figure 3) on cryptos, the initial price shock generates a positive effect on trade volume which then reverts to the mean and continues slightly below 0 before settling at the baseline around week (step) 4. This trend is found in similar studies detailing feedback trading behavior (King & Koutmos, 2021; Arsi et al., 2021). While it may seem counterintuitive not to find the same relationship for meme stocks, this conforms to the widespread allegation that meme-stock traders are not working according to market fundamentals.
When shocking sentiment on trade volume, we generally see a positive shock to trade volume from a positive shock to net sentiment for the stocks, and a negative relationship on cryptos. However, the confidence intervals are wide in each case here indicating relatively lower certainty. Around week (step) 5, each of the stocks are cryptos IRF returns to their baseline, indicating relatively short-term attention spans. In this latter case, the initial shock seems to be negative for cryptos but positive for meme-stocks. The effect dissipating by the third or fourth step (week) suggests that the sentiment related to the market has a relatively short memory. This short-term attention effect is similar to findings in (Cookson et al., 2025). Further, the relationship we observe between sentiment and trade volume in cryptos shows a stronger week (step) 1 shock to trade volume for ETH than BTC. BTC has a considerably higher trade volume, suggesting a higher level of liquidity in the market. Our findings suggest that in the more liquid market (BTC) we observe that the effect sentiment has on trade volume is more muted. It is possible that in these markets with higher liquidity, the traders are more patient or reluctant to act.
The fact that cryptos and meme-stocks have different reactions in trade volume to a positive shock in sentiment reinforces a familiar point. Seeing that meme-stock investors trade more in response to a move in sentiment suggests they are engaged in herding behavior, possibly motivated by the ‘fear of missing out’ that they commonly refer to. Contrasting this, the crypto investors may be far more sensitive and risk-averse than the meme-stock traders, causing their trade activity to run counter to sentiment online. Further, we see in Figure 3 a relatively larger initial shock to trade volume from online media on stocks than we do for cryptos. This confirms the role that online media (and specifically narratives) had in driving retail investor herds to trade stocks like AMC, GME, and BUD, compared to cryptos.
Conclusion
This paper uses time series of social media mentions and sentiment, along with market closing price and trade volume to study how social media interacts with market forces for cryptocurrencies and meme stocks. Results indicate a clear relationship between social media data collected on volume and sentiment of mentions and market price and volume data for the group of assets studied. However, these relationships are not consistent across assets studied.
Cryptocurrencies and meme-stocks represent unique classes of market offerings due to their volatility over the past few years. Results from the Granger causality test demonstrate that with meme-stocks (AMC, GME, BUD) and with cryptos (BTC, ETH) it is difficult to use time series of trade volume and social media mentions, and sentiment to predict closing price. However, market conditions can be used to predict volumes of mentions (for BUD, GME, and ETH), and generally, market conditions and mentions can be used to predict trade volume. The time series associated with AMC proves challenging to predict, which makes sense given the fact that the stock was subject to a herd of contrarian retail investors. Furthermore, we see that for nearly every asset that social media mentions are difficult to predict with statistical significance, but social media sentiment and trade volume are generally able to be predicted (with statistical significance) using social media mentions and closing prices.
Using impulse response functions, we find asymmetries in the effects that online media sentiment and price shocks have on trade volume. We see that shocks to price generate immediate impacts on trade volume, but that the relationship is generally negative for stocks and positive for cryptos. In every case, trade volume returns to its baseline by the fourth week following the shock. When shocking online media sentiment on trade volume, the effect is more specific to the asset. Crypto markets with relatively lower liquidity (ETH) see a stronger negative relationship than the market for BTC. These trade volume responses are modest for cryptos. In meme-stocks, the response is more pronounced. This suggests that online media had a larger role in driving trade activity on the stocks we studied than it does on the cryptos (despite a large volume of chatter online about the cryptos). These findings suggest that price and sentiment in online media play an important role impacting trade volume in the assets studied.
These findings are notable both for research colleagues but also for risk supervisors and portfolio managers. Institutional investors incurred heavy losses due to the actions of herd investors trading GME, AMC, and boycotting BUD. Institutions that are quick to notice movements in online media sentiment, specifically when a stock becomes the subject of meme-craft and herd investor interest, will be better suited to position themselves to avoid loss and potentially court gains by these rapidly changing market conditions. Further, retail and institutional investors may find it useful to learn of the contrast in behavior between crypto markets and these meme stocks. To the extent that these crypto assets have more typical (or less sensitive) relationships to online media, it will be easier to navigate changing market conditions.
Findings from this research have a few limitations. We chose a specific group of assets (two cryptocurrencies and three meme-stocks) and other related assets might draw different findings. Furthermore, studying these same assets (or alternatives) during a different period might lead to different findings. This paper seeks to understand casual relationships between data, and to identify unexpected changes in the data and determine their relationship to certain events that occurred during the period of data collection. Future research with time varying social media data and market data could attempt to use the variables to predict or forecast outcomes.
Another limitation (which is in part a result of a key strength: sample size) is the temporal spacing of our samples of online media. We carefully consider these while using this opportunity to illuminate potential avenues for future research while providing careful consideration for our use of weekly data. Firstly, our use of weekly observations has the potential to smooth out variance that might otherwise be of interest. Ultimately, this analysis seeks to probe the relationship between online media activity (which includes a metric for sentiment that is similar to, but not the same as, investor sentiment) and stock activity (including performance). Behavioral finance research is replete with surveys of investor sentiment (Chang et al., 2015). A leading survey, the AAII, surveys its members on a weekly basis, yielding roughly 100-350 responses on each weekly survey (AAII, 2025). Our decision to collect weekly data is rooted in a few considerations. Institutions on Wall Street often maintain their own investor sentiment reports, such as the annual Nasdaq Retail Investor Survey (2024) of 2,000 investors (Nasdaq, 2024). Similar to the Nasdaq report is the Schwab Retail Client Sentiment report (2025), conducted quarterly on ~1,000 retail clients. (Charles Schwab, 2025). Each of these is well designed and generates useful insights, but with relatively small samples. Our sampling technique is quite different, yielding a very high sample size of posts, observed over the period of 4 years’ worth of weekly observations.
Our decision to observe weekly data is also rooted in technical considerations, we had concerns about the viability of our methods in the case where data collection has mixed frequencies. That the stock markets generally close on weekends and national holidays complicates our analysis when social media data is generated without pause (including during periods where the market is closed). This mixed frequency sampling would be incompatible with the standard time series approaches (such as our standard Vector autoregressive technique) without transformation, because our methods assume uniform sampling frequencies. While there are techniques that can accommodate this issue (such as the MIDAS regression, which has applications to construct a VAR and perform Granger tests (Ghysels, 2016), these methods remain incompatible with the identification of structural breaks. Because we analyze investor herding driven by social media activity, we are reluctant to give up the Bai-Perron test for structural breaks. More plainly, we consider the use of the Bai-Perron test to be a key comparative advantage of our study, which follows a well-established methodological pipeline grounded in the VAR and Granger methods. Furthermore, our use of weekly data observations follows research by Jiang and Zhou (2018) who find investor sentiment’s predictive power for stock returns exhibits temporal variance based on a range of characteristics specfic to the stock, finding that the time horizons of predictability can be beyond a single day or even a single month.
There are, of course, other methods researchers have employed to circumvent the tricky case of mixed sampling frequencies with stocks and online media observations. A common technique is to simply drop observations from online media that occur on weekends and holidays. This was employed in the study of online media data as a performance indicator of cruise line operations (Widmar, et al., 2020). Another example of dropping observations is the case of online media and dairy futures (Ortez, et al., 2022). In this latter case, the decision to drop weekend and holiday observations in online media is understandable to the extent that much of the trading activity in dairy futures markets is driven by professional organizations in the agricultural commodity industry (e-futures, 2024). In this case, we did not feel comfortable dropping these mentions and corresponding net sentiments due to the nature of retail herd investors, who we infer will continue to digest key information over the weekends. Our inference is partially grounded in previous research findings that investor sentiment exhibits a reduced (but nonetheless potent) weekend and holiday effect (Liu, Wang, & Du, 2022). Future research seeking to use our time series methods could employ daily observation with careful consideration of how to transform data to accommodate the requirements of the MIDAS-VAR.
Footnotes
Appendix 1
Funding
The authors disclosed receipt of the following financial support for the research, authorship, and/or publication of this article: This research was funded by discretionary faculty funds belonging to Dr. Nicole Olynk Widmar.
Declaration of Conflicting Interests
The authors declared no potential conflicts of interest with respect to the research, authorship, and/or publication of this article.
Data Availability Statement
The data used in this study were collected from publicly available social media sources and did not include any personally identifiable information. Data were analyzed in an aggregated manner which anonymized any social media account associated with the research. Data is available upon request.