
Abstract
Past research has suggested an associative relationship between social media use and alcohol consumption, especially among the younger generations. The current study takes a generalizable approach to examining the prevalence of posting about alcohol on a popular social media platform, Twitter, as well as examining the predictors of a tweet’s virality. We content-analyzed more than 47.5 million tweets that were posted in March 2015 to explore the prevalence of alcohol-related references, and how alcohol-related references, tweet features (e.g., inclusion of hashtags, pictures, etc.), and user characteristics (e.g., number of followers) contribute to the tweet’s virality. Our findings showed that during March 2015, about two of every 100 tweets in the United States were alcohol-related; whereas the majority of those referenced intoxication. In addition to tweet features and user characteristics, the prevalence of alcohol-related references in a tweet positively predicted the number of likes it received, yet negatively predicted the number of retweets. Given prior evidence supporting the association between social media use and alcohol consumption, the prevalence of alcohol references in tweets and how that contributes to their virality offers insights into the widespread phenomenon of glorifying alcohol use and excessive drinking via social media, pointing to potential negative health consequences.
In the United States, six in 10 adults reported they drank in the past month, a quarter reported engaging in excessive drinking, and seven in 100 have an alcohol use disorder (AUD; National Institute on Alcohol Abuse and Alcoholism [NIAAA], 2016). With 88,000 annual deaths, alcohol use and abuse is considered the “fourth leading preventable cause of death in the United States” with US$249 billion in annual health costs (NIAAA, 2016). Alcohol use and abuse is not endemic to the United States; NIAAA references it as a “global burden” in relation to negative health consequences as well as global cost of health care. Alcohol consumption, in the United States and worldwide, is a reflection of social and cultural norms (e.g., Bjarnason et al., 2003; Dean, 1990; Wada, Price, & Fukui, 1998).
Prior to the proliferation of social media, social and cultural drinking norms were mostly expressed in small-group settings, and, at times, displayed through media and advertising, yet with a regulatory body governance. Social media changed the rules of the game. Three quarters of U.S. Internet users and 65% of all U.S. adults reported using social networking sites (SNS) such as Facebook, Twitter, and Instagram; with the highest adoption and usage rates among young adults (Perrin, 2015). In addition to alcohol marketers reaching both legal-age drinkers and underage youth via SNSs (e.g., Barry et al., 2015; Nicholls, 2012; Winpenny, Marteau, & Nolte, 2014), research has shown that SNS users—including underage youth—engage in displays of alcohol and other drug use (AODU) on SNSs; where the exposure to and interacting with other friends’ alcohol-related posts, as well as posting alcohol-related content, significantly predict alcohol consumption (e.g., Morgan, Snelson, & Elison-Bowers, 2010; Moreno & Whitehill, 2014; Viken, Alhabash, Figueira, Kanver, & Smith, 2016).
Cavazos-Rehg, Krauss, Sowles, and Bierut (2015) analyzed the sentiments, themes, and sources of a random sample of 5,000 alcohol-related tweets in March and April 2014. They found that pro-alcohol tweets, by far, outnumbered anti-alcohol tweets, where the former tended to be of positive sentiment and heavily referenced extreme drinking. The current study builds on Cavazos-Rehg et al.’s (2015) findings to examine the prevalence of alcohol-related references in tweets using a larger sample and a more comprehensive coding scheme. We explore how alcohol references, tweet features, and user characteristics predict a tweet’s virality (i.e., likes and retweets).
Twitter: The 140 Characters to Get You Drunk
Twitter is one the world’s leading SNSs. With 320 million active users, it has become a major component of users’ newsgathering and media diet (DeSilver, 2016). Twitter has been renowned for fast-paced, broadcast-like, interactive social media use. Twitter users have been confined to 140 characters, thus, popularizing Twitter’s use among mobile and smartphone users. This distinctive feature of confined character length has defined the platform’s sociotechnical functionality. Twitter is distinctive in how and why people use it. A recent study showed that college students who used both Facebook and Twitter had different levels of loneliness than those who only used Facebook (Petrocchi, Asnaani, Martinez, Nadkarni, & Hofmann, 2015). Ma, Alhabash, Artis, Bakle, and Uwimbabazi (2016) showed that Twitter had a distinctive order of use motivations compared with other social media platforms (i.e., Facebook, Instagram, and Snapchat). Holton, Baek, Coddington, and Yaschur (2014) showed that Twitter users’ inclusion of hyperlinks in their tweets was mainly driven by social and reciprocal information-seeking and sharing. Given the specific characteristics and features surrounding Twitter use, it is important to examine how such peculiarities relate to alcohol use and abuse.
In general, social media use, specifically among adolescents and young adults, correlates with risky behaviors (The National Center on Addiction and Substance Abuse [CASA], 2011). Teens who use social media are five times more likely than nonusers to use tobacco, three times more likely to use alcohol, and twice as likely to use marijuana (CASA, 2011). The uniqueness of social media lies in its interactive nature, therefore, social media users are not only perceivers of drinking social norms, but also norm generators. Studies exploring the relationship between social media use and alcohol consumption can be grouped into two main areas dealing with (a) exposure to, and interaction with, other users’ alcohol-related posts; and (b) posting (user-generated content) alcohol-related content on SNSs.
Huang and colleagues (2014) showed that adolescents’ exposure to their friends’ online pictures of drinking alcohol was associated with both smoking and alcohol use, where adolescents with friends who drink alcohol were more intensely affected by seeing alcohol displays on Facebook and MySpace. Boyle, LaBrie, Froidevaux, and Witkovic (2016) found that mere exposure to alcohol-related content on Facebook, Instagram, and Snapchat correlated with self-reported alcohol consumption among first-year college students. Alhabash et al. (2016) exposed participants to posts featuring beer or water brands and found that exposure to beer brands resulted in greater intentions to consume alcohol and higher likelihood to perform alcohol-related behaviors. Hoffman, Austin, Pinkleton, and Austin (2017) found that alcohol-related social media use (i.e., using Twitter to receive updates on an alcohol product, clicking on beer ads on SNSs, and receiving alcohol-related giveaways from SNSs) predicted excessive drinking.
Posting about alcohol further increases the likelihood of alcohol use and risky drinking. Westgate, Neighbors, Heppner, Jahn, and Lindgren (2014) argue that users’ actual posting behavior has stronger correlations with alcohol consumption and problematic drinking than mere exposure to marketing messages and even interaction with friends’ alcohol-related posts. Similarly, Moreno et al. (2014) tracked Facebook posts of 338 high school seniors as they transitioned into college. They found that, compared with nondisplayers and alcohol displayers (who posted about alcohol but not about getting drunk), those who displayed intoxication or problematic drinking on their Facebook scored higher on the AUD identification test (AUDIT), and their average AUDIT level was considered risky according to the national standard; a finding confirmed by Ridout, Campbell, and Ellis (2012). Twitter is also used to display alcohol references; about one third of college students who tweet frequently were found to share alcohol-related content (Moreno, Arseniev-Koehler, Litt, & Christakis, 2016).
There is enough evidence to support an associative relationship between social media use, specifically within the context of alcohol-related displays (passive or active), and self-reported drinking behavior. The current study aims to document the prevalence and means of virality related to alcohol-related and non-alcohol-related tweets. To date, few studies have examined the prevalence of alcohol-related references in tweets.
Das and Kim (2015) argued that patterns of tweeting about alcohol could be used as indicators of alcohol use and abuse, where they showed an increase in the prevalence of alcohol-related tweets on weekends and during a major celebration in a particular geographic area. Whitehill, Pumper, and Moreno (2015) surveyed attendees of a street festival, where they measured their SNS use and alcohol use. Their results showed that about a third of alcohol users attending the street festival reported using either Facebook or Twitter during the event, of whom, heavy episodic drinkers reported a higher frequency of using Facebook, yet equal likelihood of using Facebook and Twitter in comparison with nonheavy episodic drinkers. Burton, Dadich, and Soboleva (2013) used quantitative and qualitative approaches to content analyze a purposive sample of alcohol-promoting and anti-alcohol Twitter accounts and concluded that alcohol marketers were far more successful in garnering interactivity and engagement among users than those advocating against the use of alcohol. Earlier studies showed that tweeting about alcohol intensified in the evening, on weekends, and during major celebrations such as New Year’s Eve and St. Patrick’s Day (Cavazos-Rehg et al., 2015; West et al., 2012).
Analyzing Twitter content has also been extended to other risky behaviors. Hanson, Burton, Giraud-Carrier West, Barnes, and Hansen (2013) showed that the prevalence of tweeting about Adderall geographically coincided with major university locations. Cavazos-Rehg, Krauss, Grucza, and Bierut (2014) conducted a mixed-method content analysis of a popular pro-marijuana Twitter account, where they showed the different appeals (e.g., humor) used in pro-marijuana tweets, as well as highlighted the demographic characteristic of the account’s followers and the nature of their interactions with the different types of tweets.
Most relevant to this study is Cavazos-Rehg et al.’s (2015) study on the inclusion of alcohol references in Tweets posted from March to April 2014. The researchers analyzed a random sample of 5,000 tweets dealing with alcohol, and showed a far greater prevalence of pro-alcohol than anti-alcohol tweets. In addition, the study showed that the highest peak of tweeting about alcohol coincided with St. Patrick’s Day, with smaller peaks for weekends. Finally, the study showed that pro-alcohol tweets had a higher frequency of positive sentiments; with prevalence in the frequency of references to heavy and problematic drinking. While the findings of Cavazos-Rehg et al.’s (2015) are valuable, their study was limited in terms of the sample size and coding scheme (a limited set of keywords). Our study builds on Cavazos-Rehg et al.’s (2015) study by (a) expanding the sample size to the entire sample afforded to researchers by the Twitter Application Programming Interface (API; reaching more than 47.5 million tweets during our sampling period); (b) enhancing the coding scheme; and (c) including non-alcohol-related tweets to showcase the predictive power of alcohol references on virality. Based upon this sample, we asked,
Cavazos-Rehg et al. (2015) also conducted a sentiment analysis of a small sample of pro- and anti-alcohol tweets. In their study, they found that pro-alcohol tweets are often associated with positive sentiments, and pro-alcohol tweets by far outnumbered anti-alcohol tweets. To this end, the study aims to explore the defining features of alcohol-related tweets by contrasting them with those that did not include references to alcohol (termed as non-alcohol-related tweets). We explored four major aspects of the tweets: (a) tweet features, (b) user characteristics, (c) tweet emotionality, and (d) signals of descriptive norms. Per the limited capacity model of mediated motivated message processing (LC4MP), human’s limited capacity to process information dictates that engaging in different subprocesses (i.e., encoding, storage, and retrieval) is pertinent to motivational activation of the appetitive (approach) and/or aversive (avoidance or withdrawal) systems (Lang, 2000, 2006). Message and user characteristics influence the ways in which media users attend to, process, and remember mediated messages. Lang (2000, 2006) argues that media messages are complex as they vary in structural and functional features. Structural features refer to the specific elements that differentiate one media message from another. For example, the modality of message (audio, visual, or audiovisual), the complexity of the information, and the technical features of the message (e.g., number of cuts, camera angles) are all examples of structural message features that could influence psychological and behavioral outcomes. With regard to tweets, structural message features refer to elements afforded by the sociotechnical system (Twitter), including, but not limited to, the inclusion of a picture in the tweet, the number of characters, hashtags, mentions, and posting date and time.
Another element that is prominent on Twitter is the characteristics of the user. Communication and persuasion research has long examined the nature and effects of sources on different message outcomes, including processing and effects (e.g., Maddux & Rogers, 1980; Oreg & Sverdlik, 2014; Petty & Cacioppo, 1989; Wilson & Sherrell, 1993). Sundar and Nass (2001) provide a comprehensive review as they conceptualize who or what a source is, beyond the classical definition of a source as message originator. Sundar and Nass posit that a source can be “a person, a group, an institution, an organization, or even a label” (p. 53). They proposed a typology of communication sources to include three major areas: “visible gatekeeper-presenter of content,” “media technology that delivers the content,” and “receiver or audience choosing content for consumption” (p. 58). In the current study, we explore the characteristics of Twitter users as sources of alcohol-related and alcohol-unrelated tweets.
Per LC4MP (Lang, 2000, 2006), message function features can also influence how messages are processed and perceived by media users. Emotional content is thought to evoke appetitive and/or aversive motivation system activation, thus, resulting in cognitive, affective, and behavioral outcomes of message exposure. To this end, it is critical to examine the emotionality of alcohol-related tweets in comparison with non-alcoholic tweets. For the purposes of the current study, we use the dimensional approach to defining emotions (Bolls, 2010), arguing that emotions can be best understood as a function of valence (direction of emotion) and arousal (intensity of emotion). Given the difficulty of quantifying emotional intensity or arousal, the current study focused on the valence of the tweets. Therefore, we asked,
Finally, an important aspect in alcohol-related research has been the notion that perceptions of subjective and social norms among people greatly influence their own alcohol consumption (e.g., Schlegel, D’Avernas, Zanna, DeCourville, & Manske, 1992). Broadly, social norms are defined as perceived rules and standards that have been found to motivate human behavior (Cialdini, 2001). Perceived norms have been categorized into descriptive norms (what people think others actually do) and injunctive norms (what people think others should do), which have been shown, in a health context, to be a strong social influence that can impact a variety of health behaviors (Cialdini, Reno, & Kallgren, 1990; Neighbors, Oster-Aaland, Bergstrom, & Lewis, 2006; Neighbors et al., 2007). We, therefore, asked,
Virality
Virality refers to the metrics used to assess the reach and engagement with social media content (e.g., tweets). Alhabash and McAlister (2014) argued for a tripartite approach to defining virality that relies on interactivity and exposure social media metrics: (a) affective evaluation refers to the explicit emotional responses indicated by the number of likes and dislikes, (b) viral reach deals with the spread of content and is indicated by the number of shares (and retweets), and (c) message deliberation refers to other users’ engagement in discussing and responding to social media content and is indicated by the number and tone of comments and replies.
Understanding virality is critical to understanding how SNSs work. The unique affordances of SNSs lie in the intersection of user-generated content and the ability to share and interact with content among a network of friends and followers (Carr & Hayes, 2015). The virality of a tweet indicates the popularity of the content and the magnitude of its reach to other users in the network. To this end, it is important to look at virality of alcohol-related tweets as a means of understanding the impact such tweets have on users, especially because past research has illustrated that passive exposure to, interacting with, and generating alcohol-related tweets are associated with alcohol consumption (Alhabash et al., 2016; Boyle et al., 2016; Ma et al., 2016; Moreno et al., 2014; Westgate & Holliday, 2016; Westgate et al., 2014). To establish unique predictive power for the prevalence of alcohol-related references as a predictor of a tweet’s virality, tweet features and Twitter user characteristics were added to the list of potential predictors. Therefore, the following research questions are posed:
Method
Sampling and Data Extraction
We queried tweets that were geotagged in the continental United States during the period from March 3, 2015 to March 31, 2015 by listening to Twitter’s Streaming API. We intentionally selected the month of March due to the occurrence of St. Patrick’s Day (March 17, 2015; a Tuesday) as our primary interest was to study patterns of tweeting about alcohol surrounding a U.S. celebration. The initial sample included 59,928,298 million geotagged tweets, with an average of more than two million tweets per day. Although the Twitter Streaming API imposes a rate limit on data collection, the number of tweets in the initial sample is below the 1% rate limit (five million tweets per day), which suggests that the majority of the geotagged tweets that match our filter criteria of an Internet Protocol (IP) address from within the continental United States are in the collected sample. Identification of the tweet and account locations are provided by the Twitter streaming API, where we have applied a geotagging filter to only include tweets from within the United States. Following our codebook, we attempted to collect additional information about the virality of each tweet (i.e., the number of likes and retweets), so we queried the Twitter REST API during April 9 to May 16, 2016, which returned a total of 47,669,606 tweets (79.6% of the initial sample). Per past research, it is common that 20% of tweets are no longer accessible (Liu, Kilman-Silver, & Mislove, 2014). We attempted to recollect 10,000 missing tweets individually and found 9,673 tweets were not available. Among these tweets, 7,000 tweets were deleted, 2,425 tweets were protected (they still existed, but the user changed their privacy settings to only show the tweet to their Twitter friends), 140 tweets were by suspended users as they violated Twitter’s Terms of Service, and 107 tweets returned a server error, which is consistent with past research findings (Zhou, Wang, & Chen, 2016). While deleted tweets could introduce bias in the results depending on the reason they were deleted, we relied on previous work demonstrating that alcohol and illegal drug use are mentioned as often in deleted tweets as undeleted tweets (Almuhimedi, Wilson, Liu, Sadeh, & Acquisti, 2013), thus, we have reason to believe that our sample is not biased due to missing tweets.
For each tweet that matched the codebook, we retrieved the number of retweets and likes it received using Twitter’s GET statuses/lookup method provided by the API. Given the large number tweets queried, we split them into five groups, so we could retrieve them on five machines in parallel.
Coding Scheme
To construct our coding scheme, we came up with a list of keywords used in each of the categories of interest through brainstorming and consulting popular websites and social media platforms. We relied on Siegel et al. (2013) for a list of 951 alcohol brands consumed by underage drinkers. We then validated our coding scheme with open-ended responses from a pretest of 97 college students at a large, Midwestern university, where we asked participants to recall any specific words and/or hashtags they have previously used or have seen their peers use to reference alcohol in tweets. This allowed us to add more keywords as well as different ways of spelling (and misspelling) known keywords that resulted in a more inclusive coding scheme. The final codebook included 1,220 keywords that included both keyword phrases and hashtags. We also added 16 additional keywords and hashtags due to alternative spelling and popular misspellings. With regard to the machine-learning aspect of data acquisition and analysis, we used five different servers. For classifying each tweet, the accuracy rate was 100% given that we had a set list of keywords to help with the process of classification. In addition, to establish areas of comparison between alcohol-related and unrelated tweets, we conducted an automatic linguistic analysis of all alcohol-related and unrelated tweets using the linguistic inquiry and word count (LIWC) software (Pennebaker, Booth, Boyd, & Francis, 2015). Through the combination of our own machine learning technique and the LIWC analysis, we arrived at five main coding categories that we applied to each tweet as a unit of analysis. We fit features from the five coding categories with a multivariate linear regression to predict the logarithm of the number of likes and number of retweets of each tweet. We quantify the influence of these features on like and retweet prediction, shown in Table 4. We rescale the number of tweets, followers, friends, and likes of each user by taking the log. Following are the major coding categories (complete keyword list available upon request from authors).
Alcohol references
We included keywords that relate to the following subcategories: (a) alcohol use references (e.g., shots, booze, liquor, alcohol, etc.); (b) alcohol type (e.g., vodka, rum, beer, wine, etc.); (c) intoxication references as they relate to alcohol overuse (e.g., wasted, tipsy, drunk, turnt, etc.) and intoxication outcomes (e.g., hangover, blackout); (d) socializing references associated with alcohol use (e.g., party, Thursday, Tequila Tuesday, Wine Wednesday, bar crawl, etc.); (e) cocktail types (e.g., Cosmopolitan, Tequila Sunrise, Moscow Mule, etc.); and (f) alcohol brands, where we adopted Siegel et al.’s (2013) list of alcohol brands consumed by underage drinkers. We added two additional subcategories that could be related to alcohol, specifically, within the context of celebration drinking. Given that the data set was limited to March 2015, we added keywords related to St. Patrick’s Day and the National Collegiate Athletic Association (NCAA) Basketball Tournament (March Madness).
Tweet features
In this category, we included information specific to the tweet (e.g., tweet date, tweet time, number of likes, retweets, and replies, the number of hashtags, and whether or not the tweet was promoted).
User (source) characteristics
This refers to information specific to the user (e.g., username, Twitter handle, location, date joined, number of followers, etc.).
Content emotionality
We relied on the LIWC dictionary to extract three relevant coding categories. First, the tweet clout score refers to the confidence of the author in what they wrote (LIWC 2015 Operator’s Manual). Second, we used the two emotional valence categories of positive and negative emotions.
Descriptive and injunctive norms
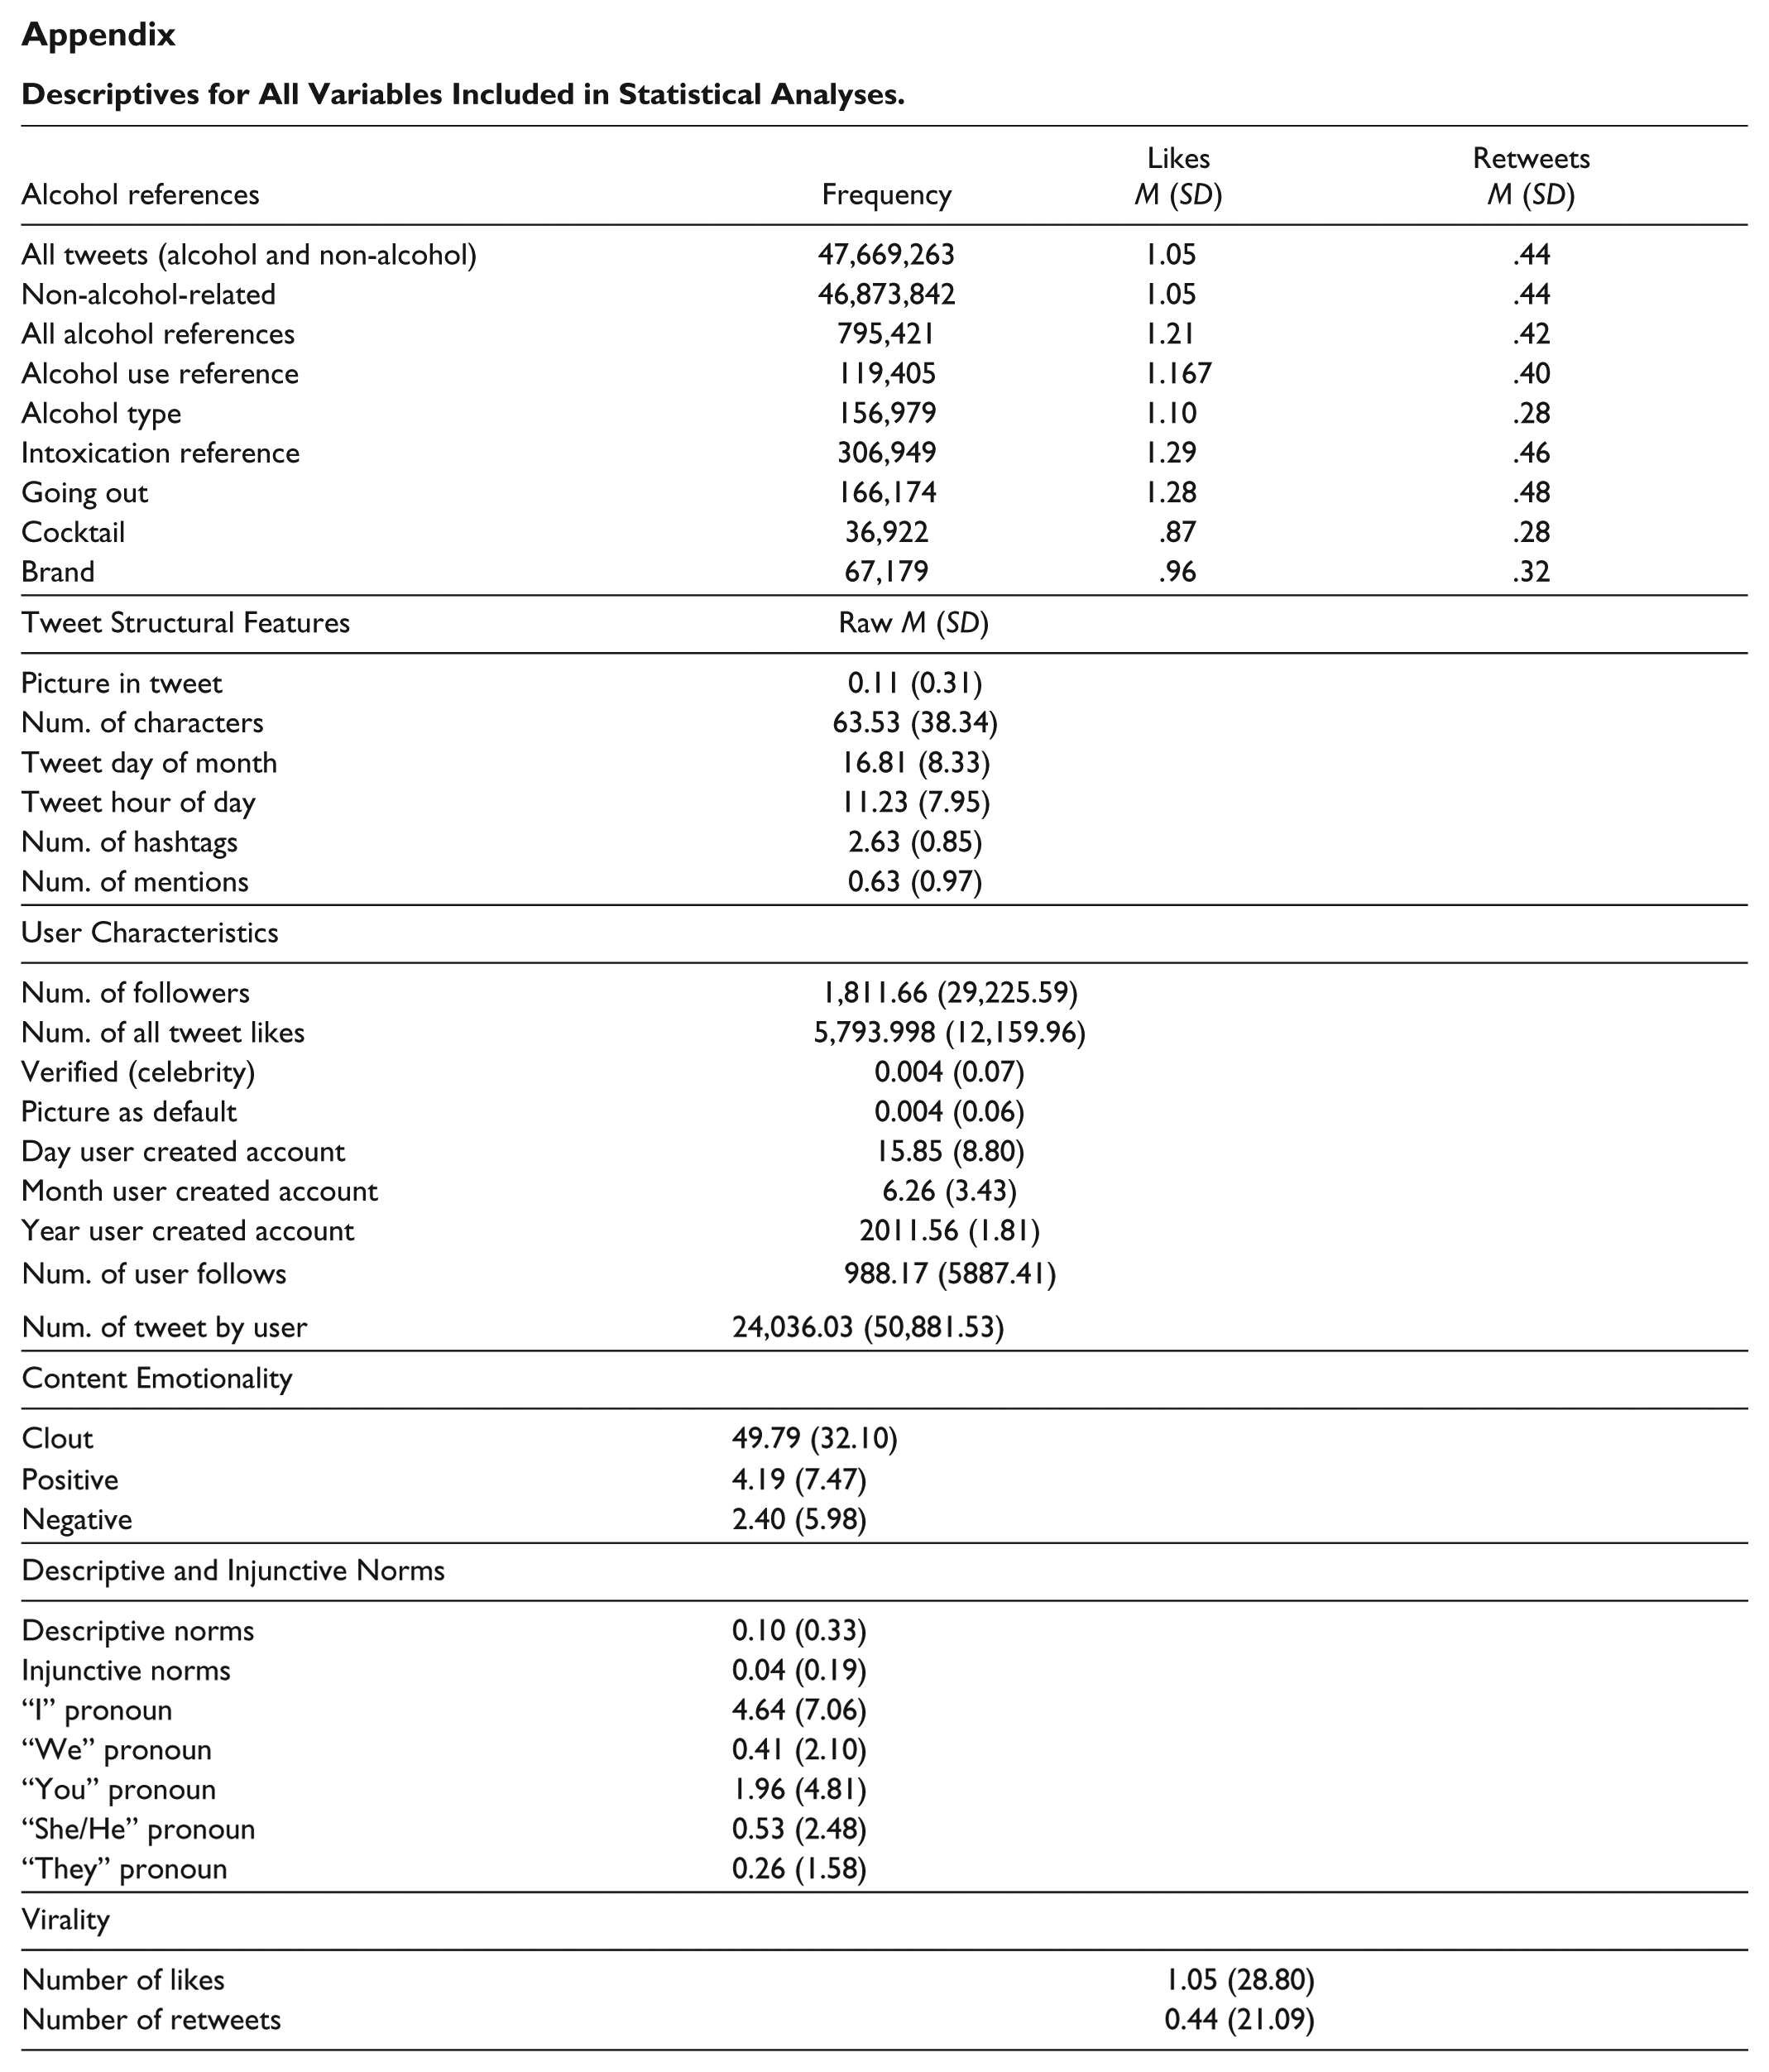
To code for descriptive and injunctive norms, we used our own keywords as well as particular keywords through the LIWC analysis. For our machine learning portion, we used keywords referencing behavior prevalence among a social group to indicate descriptive norms (e.g., we, group, friends, everyone, all, etc.). We also relied on the LIWC software to code for pronouns (I, we, you, she/he, they), with emphasis on the difference in tweets containing “we” and “I” as a means of signaling descriptive norms. For injunctive norms, we selected phrases used to indicate acceptance of the behavior (e.g., cool, hip, awesome, neat, rad, super, etc.). Descriptive statistics for all variables included in the statistical analyses is included in the Appendix.
Results
Alcohol Tweets Prevalence
The first research questions dealt with exploring the prevalence of tweeting about alcohol during March 2015. Among the 47.5 million tweets for which we were able to collect likes and retweet information, 795,421 were alcohol-related (i.e., contained an alcohol reference, alcohol type, intoxication reference, reference to going out, a cocktail, or an alcohol brand); roughly two of every 100 tweets. Likes ranged from 0 to 74,308 (M = 1.21, SD = 84.85). The range of retweets was from 0 to 55,872 (M = 0.42, SD = 62.93). Among alcohol-related tweets, 38.59% included intoxication references, followed by 20.89% that referenced going out, 19.74% that referenced alcohol types, 15.01% included alcohol use references, 8.45% included an alcohol brand name, and 4.64% mentioned cocktails. As shown in Figure 1, the number of alcohol tweets, including different coding categories, exponentially grows throughout the week to a Saturday peak, followed by a minor dip on Sunday, and a steep de-escalation during Monday to Thursday. We can also observe a peak on, and the day after, St. Patrick’s Day.
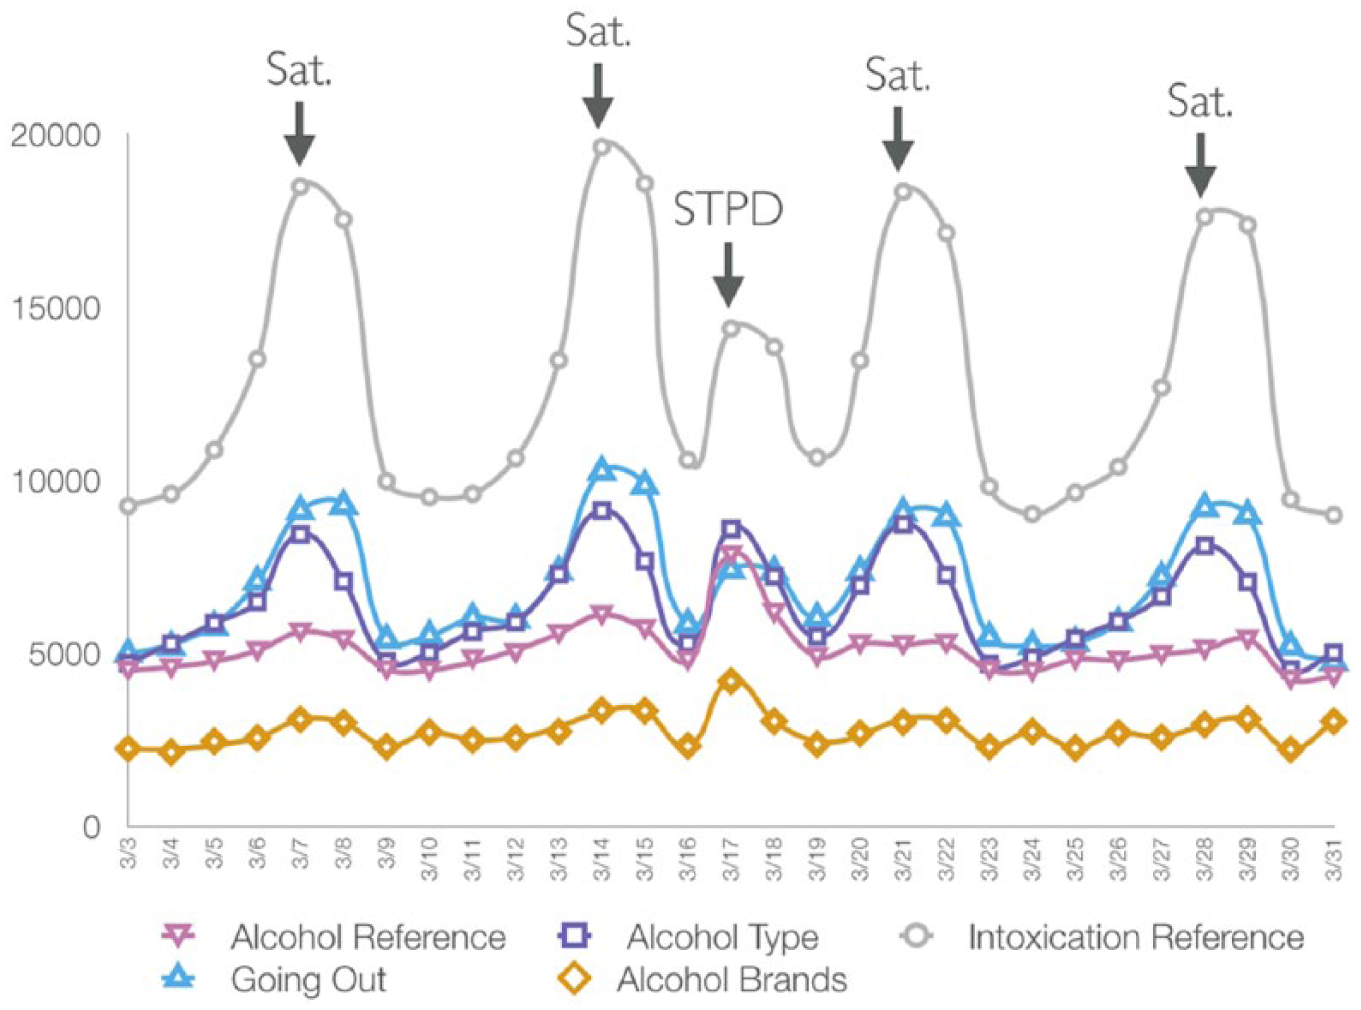
Frequency of alcohol-related references in tweets during March 2015.
Comparing Alcohol-Related and Alcohol-Unrelated Tweets
Our second research questions explored the differences between alcohol-related and alcohol-unrelated tweets in terms of tweet structural features (RQ2a), user (source) characteristics (RQ2b), content emotionality (RQ2c), and prevalence of social norms (RQ2d). We conducted Welch’s t tests to compare alcohol-unrelated tweets with all alcohol-related tweets with combined subcategories, as well as the six subcategories of alcohol references: (a) alcohol use reference, (b) alcohol type, (c) intoxication reference, (d) socializing, (e) cocktail type, and (f) alcohol brand. All results are summarized in Table 1.
Means and Welch’s t-Test Results for Alcohol-Related and Alcohol-Unrelated Tweets in Reference to Tweet Structural Features, User (Source Characteristics), Content Emotionality, and Descriptive and Injunctive Norms.

Note. Num. = Number.
p < .05.
Tweet structural features
Across the board, our results showed that alcohol-related and alcohol-unrelated tweets were significantly different in terms of structural features. In terms of the inclusion of a picture in the tweet, the average alcohol-related tweet was less likely to have a picture compared with the alcohol-unrelated tweet. However, when looking at the alcohol references subcategories, we can see that tweets with references to socializing, a specific cocktail type, and an alcohol brand were more likely to have a picture than alcohol-unrelated tweets. In terms of the number of characters in a tweet, alcohol-related tweets (including all subcategories) had a significantly higher number of characters than alcohol-unrelated tweets. Alcohol-related tweets were more frequent on March 17 (given it was St. Patrick’s Day) than alcohol-unrelated tweets, and they were tweeted at a slightly later hour of the day. Alcohol-related tweets also included a higher number of hashtags, yet, for the most part (except for those with intoxication references and brand mentions), included a lower number of mentions (see Table 1).
User (source) characteristics
Overall, Twitter users of alcohol-related tweets were not significantly different from those posting alcohol-unrelated tweets in terms of the number of followers. However, when looking at the alcohol references subcategories, we see that users of tweets with references to socializing, a cocktail type, and a brand had higher followers than alcohol-unrelated tweets, whereas those with tweets referencing alcohol use, alcohol type, and intoxication had a lower number of followers than those posting alcohol-unrelated tweets. User posting alcohol-related tweets had a significantly lower overall number of likes recorded on their account than those posting alcohol-unrelated tweets. Tweets referencing socializing, a cocktail type, and a brand were more likely than those without alcohol references to be posted by a verified account (e.g., celebrity). Except for tweets referencing socialization, users posting alcohol-related tweets followed a lower number of other Twitter users than users posting alcohol-unrelated tweets. User posting about alcohol had a lower number of overall tweets compared with those that did not post about alcohol (see Table 1).
Content emotionality
Overall, alcohol-related tweets had a higher clout score than those without any reference to alcohol. In looking at the subcategories of alcohol references, we see that alcohol tweets with a socialization reference, a mention of an alcohol brand, a specific mention of an alcohol type, and a mention of a cocktail type had higher clout scores, respectively, than those without any alcohol references. However, alcohol-related tweets that included keywords referencing alcohol use and intoxication had a lower clout score than those without any reference to alcohol. As for positive emotions, alcohol-related tweets were more positive than alcohol-unrelated tweets. However, for all subcategories, except for ones with a socialization reference, alcohol-unrelated tweets included more positive emotions than alcohol-related tweets. In contrast, overall and per subcategory, alcohol-related tweets were less negative than alcohol-unrelated tweets (see Table 1).
Social norms
Except for tweets with a specific cocktail type or an alcoholic brand, alcohol-related tweets included a larger number of references to descriptive norms than alcohol-unrelated tweets. In addition, except for tweets referencing intoxication, alcohol-related tweets were more likely to include references of injunctive norms than alcohol-unrelated tweets. When inspecting the use of pronouns in alcohol-related and alcohol-unrelated tweets, our findings showed that the two types of tweets were significantly different in most cases. Alcohol-related tweets and the relevant subcategories of alcohol references (except for intoxication and brand references) had a higher number of “we” pronouns than alcohol-unrelated tweets. With regard to the use of “I” pronouns, overall references and subcategories (except references to alcohol use) had a lower number of “I” pronouns than alcohol-unrelated tweets. Overall and all subcategories of alcohol-related tweets were lower than alcohol-unrelated tweets in terms of the use of “you” pronouns. Overall and all subcategories of alcohol references (except for alcohol use) were lower than alcohol-unrelated tweets in relation to the use of “he/she” and “they” pronouns (see Table 1).
Virality of Alcohol-Related Tweets
Our second research question asked about how the number of likes and retweets vary as a function of whether or not they include an alcohol reference. Given that data for the number of likes and retweets are highly skewed, we performed logarithmic transformations on these two variables. We applied Welch’s t test to the log-transformed likes and retweets to test the equality of means between alcohol and non-alcohol tweets. As shown in Table 2, tweets with any type of alcohol reference, a specification of alcohol type, a reference to intoxication, and alcohol-related going-out activity received a greater number of likes than tweets without any alcohol-related reference (all t values were significant). One other significant difference in the number of likes was found; tweets with a reference to an alcoholic cocktail received a lower number of likes than tweets without an alcohol-related reference. In contrast, when it came to the number of retweets, our findings, summarized in Table 3, showed that tweets with any alcohol-related reference, those with a reference to a specific alcohol type, intoxication, an alcoholic cocktail, and an alcoholic brand received a lower number of retweets compared with tweets that did not have any alcohol-related references. In addition, alcohol-related tweets that referenced going out received more retweets than alcohol-unrelated tweets.
Welch’s t Tests for Differences in the Log Number of Likes Between Alcohol-Related and Non-Alcohol-Related Tweets.
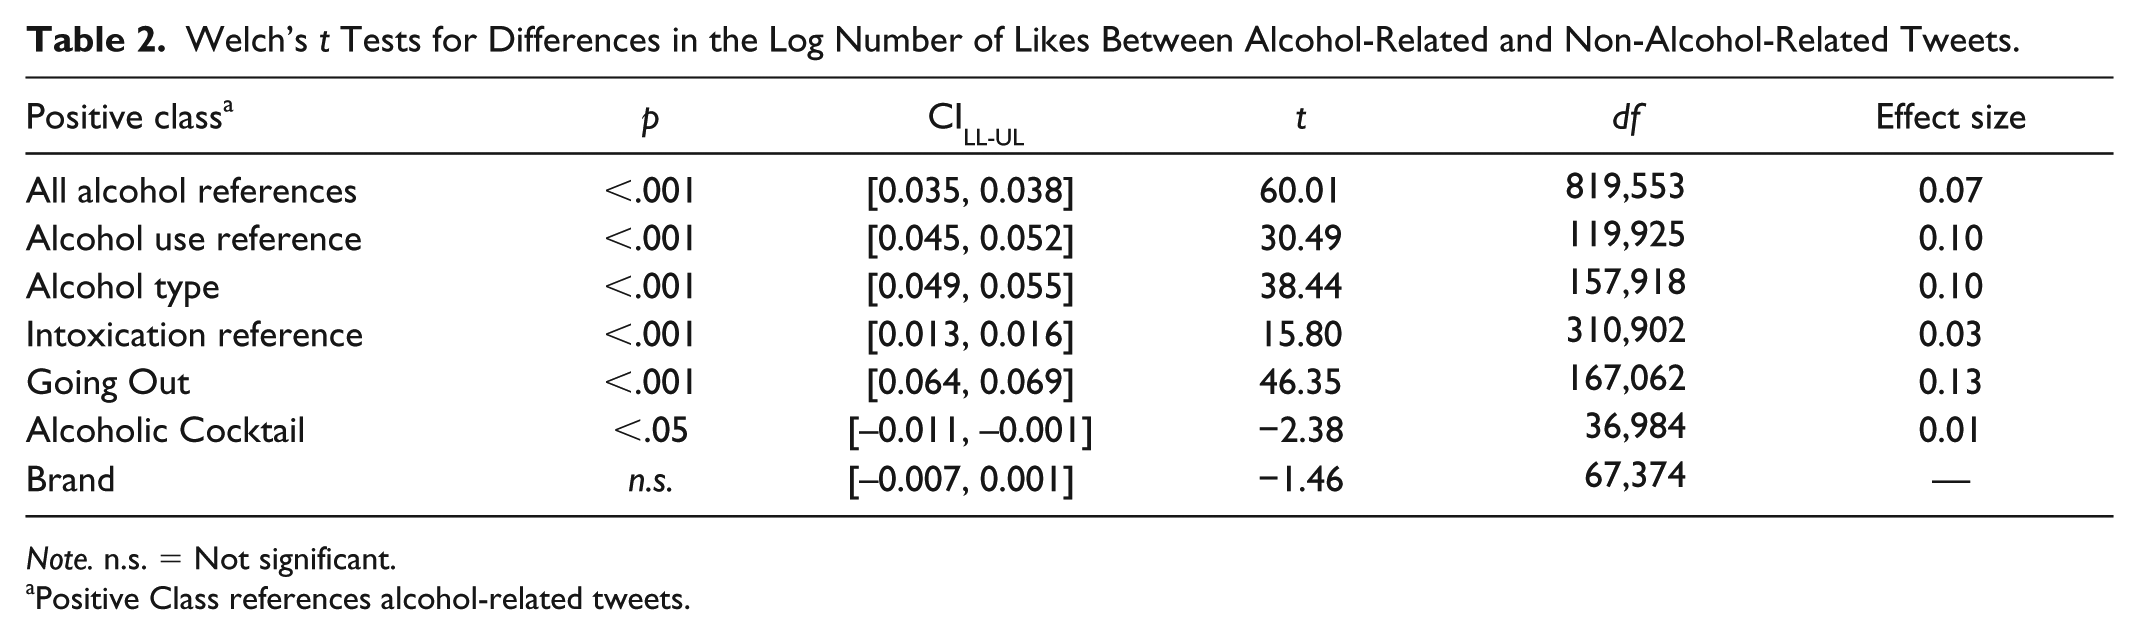
Note. n.s. = Not significant.
Positive Class references alcohol-related tweets.
Welch’s t Tests for Differences in the Log Number of Retweets Between Alcohol-Related and Non-Alcohol-Related Tweets.

Note. n.s. = Not significant.
Positive Class references alcohol-related tweets.
Predicting Tweet Virality
The fourth research question asked about how tweet features, user features, and alcohol references predict the number of likes and retweets. To answer this research question, we applied hierarchical linear regressions to predict the number of likes and retweets. We also performed logarithmic transformations to the number of tweets, followers, follows, and likes of a user.
As shown in Table 4, the model for predicting the number of likes explained 13% of the variance, while that for predicting the number of retweets explained 7% of the variance. Alcohol-related references significantly predicted the number of likes but not the number of retweets.
Regression Analysis Results for Predictors of the Log of the Number of Likes and Retweets.

Note. Gray highlighting indicates positive relationships. Beta coefficients are standardized.
Likes
For the model predicting the number of likes, among the alcohol-related predictors, the presence of an intoxication reference was the strongest positive predictor, followed by a going-out reference, alcohol-type mention, and alcohol-use reference, and March Madness, respectively. Brands, cocktail mentions, and St. Patrick’s Day were negative predictors. Of the tweet features, the inclusion of a picture in the tweet was the strongest positive predictor of likes and was associated with an increase of .30 units in the number of likes, followed by the number of characters in a tweet (incremental increase of .001 units in the number of likes) and the day of the month the tweet was posted, indicating that posting on later days in the month was associated with a slightly greater number of likes. However, the number of mentions, hashtags, and tweet hour of the day were negative predictors. For example, the inclusion of a mention in the tweet decreased the number of likes by .03 units (see Table 4). With regard to user features, a tweet coming from a verified account (e.g., celebrity) was significantly associated with a .36 unit increase in the number of likes, followed by the number of Twitter followers a user has (increase of .13 units in the number of likes), the inclusion of a profile picture in the account (increase of .08 units in the number of likes), the overall number of likes the user received (increase of .05 units in the number of likes), and the day and month the user account was created (both below .001 units of increase in the number of likes), respectively. The number of other users the tweeter followed (.08 units decrease in likes), overall number of tweets by the user (.08 units decrease in likes), and the year the account was created (.01 units decrease in likes), respectively, were negative predictors. Among emotion characteristics, the clout score and negative emotion positively predicted the number of likes with slight increases (less than .001 units) in the number of likes, whereas positive emotion was a negative predictor, decreasing the number of likes by .001 units. Among indicators of social norms, the presence of descriptive norms, injunctive norms, and inclusion of “I” as a pronoun in the tweet were significantly associated with increases of .02, .02, and less than .001 units in the number of likes, respectively. Other pronouns (we, you, they, she/he) were negative predictors, and were associated with slight decreases (between .003 and .002 units) in the number of likes.
Retweets
For the model predicting the number of retweets, none of the alcohol-related features were positive predictors. Instead, St. Patrick’s Day was the strongest negative predictor, followed by cocktails, March Madness, alcohol types, brand names, alcohol use references, going out, and intoxication, respectively. These predictors were associated with slight decreases (between .002 and .04 units) in the number of retweets. Regarding tweet features, the inclusion of a picture in the tweet was associated with an increase of .11 units in the number of retweets. In addition, the number of hashtags in the tweet (increase of .01 units) and the number of characters in the tweet (increase of .001 units), and the tweet day of the month as well as hour of the day (both associated with less than .001 units increase) were significantly associated with a greater number of retweets. In contrast, number of mentions was associated with a .01 decrease in the number of retweets. As for user features, account verification (e.g., celebrity status) was the strongest positive predictor, where a tweet posted by a verified account was associated with a .31 unit increase in the number of retweets. The number of followers and inclusion of a profile picture were each associated with an increase of .07 units in the number of retweets. The year account was created (.01 units of increase), overall number of likes (.002 units of increase), month and day the account was created (<.001 units of increase), respectively, predicted retweets. The number of other users followed by the tweeter and the number of overall tweets were negative predictors in that they each were associated with a .02 units of decrease in the number of retweets. For emotional characteristics of the tweet, negative emotion (.001 units of increase), clout score (<.001 units of increase), and positive emotions (<.001 units of increase), respectively, positively predicted the number of retweets. Of the social norms cues, descriptive norms was associated with an increase of .01 units of retweets, the inclusion of “they” and “I” pronouns in the tweets were associated with roughly .001 increase in the number of retweets. Finally, injunctive norms was the strongest negative predictor of retweets, as it was associated with a .004 decrease in the number of retweets, whereas other pronouns (she/he, we, and you) were each associated with a .001 decrease in the number of retweets.
Discussion
Summary of Findings
The current study conducted a large-sample content analysis of tweets to examine the prevalence of tweeting about alcohol and whether that, along with user features and tweet features, can predict a tweet’s virality.
First, our findings showed that two of every 100 tweets analyzed included at least one alcohol-related reference, where the largest group of these tweets included intoxication references. Given Twitter’s topical diversity (e.g., Quercia, Capra, & Crowcroft, 2012), our findings related to the prevalence of alcohol-related tweets signifies an important phenomenon, yet what is more alarming is the prevalence of intoxication-related tweets among those alcohol tweets. With the lack of age-gating on Twitter, underage youth as well as individuals of legal drinking age are able to see tweets that not only promote alcohol use but its overuse, with potential health-related outcomes. In other words, seeing messages on Twitter that promote intoxication might not only encourage users to consume alcohol and imbibe due to the shear exposure effect (e.g., Alhabash et al., 2016), but can also alter one’s normative beliefs related to alcohol use (Viken et al., 2016).
Second, our findings showed that alcohol-related tweets were significantly different from alcohol-unrelated tweets in terms of tweet features, user characteristics, the inclusion of emotional language, and cues referencing social norms (including the use of certain pronouns). Most noteworthy is that the inclusion of overall references to descriptive and injunctive norms was more prevalent in alcohol-related tweets compared with those without any alcohol references. It is also interesting to see that alcohol-related tweets had fewer instances of using the “I” pronouns and greater instances of including the “we” pronoun, thus, confirming a greater emphasis on social norms in the context of discussing alcohol on Twitter. It is also important to look at specific tweet features and user characteristics across alcohol-related and alcohol-unrelated tweets. Of all alcohol-related tweets, those referencing the use of alcohol in a socialization context (e.g., party) not only have a higher chance of including a picture, but, also, the users posting such tweets have a wider social network (greater number of followers and other users they follow). This is important in terms of contextualizing celebration drinking and references to alcohol on social media in ways that better reflect the cultural, social, and group contexts in which alcohol is discussed, as well as the reach of such discussions as evidenced by greater network size.
Third, our t test and regression analyses showed that the inclusion of an alcohol reference is associated with an increase in the number of likes a tweet received, in comparison with those without any alcohol references, while these features negatively predicted the number of retweets. Past studies showed an association between interacting with alcohol-related Facebook posts and a higher prevalence not only in self-reported drinking, but also in regard to estimation of drinking norms among different social groups (e.g., peer college students, close friends, and acquaintances; Viken et al., 2016). Our findings also showed that tweets with an alcohol reference had a smaller number of retweets than those without a reference to alcohol. This contrast in the findings has two plausible explanations. First, per Alhabash and McAlister (2014), there is considerable variability in cognitive effort associated with different online activities. Twitter has redefined its engagement scheme by switching the “favorite” button with a “like” button. Our findings could signal this adaptive experience with online engagement activities in that participants perceived pressing the “like” button could be cognitively less effortful than retweeting something. Second, liking something on social media could be a form of affective evaluation as well as endorsement of attention by the user, whereas sharing (or retweeting) something could signal message acceptance and endorsement. It is possible that there is a considerable social desirability associated with sharing alcohol-related tweets as opposed to liking them, which could largely influence a user’s impression formation online.
Finally, with regard to the association between tweet features, user characteristics, tweet emotionality, and norms keywords, on one hand, and likes and retweets, on the other, our findings illustrated similar patterns, to a certain extent. Most noteworthy trends include the predictive power of having a picture in a tweet and having a verified account, which proxy to a celebrity or influencer status on Twitter when it comes to the number of likes and retweets. It is also important to note that descriptive norms, which refers to keywords associated with the prevalence of a particular behavior, positively predicted the number of likes and retweets. Injunctive norms, however, positively predicted likes and was a negative predictor of retweets. Injunctive norms reflect an acceptance of a particular behavior, and therefore, retweeting such a message would signal endorsing that normative belief, which could explain the negative trend with retweets. Our findings also suggest that first-person tweets, or ones that have a higher prevalence of the “I” pronoun, were more likely to get liked and retweeted, whereas the prevalence of the “they” pronoun decreased likes and increased retweets, in comparison with other pronouns that were negative predictors.
Study Implications
Taken together, our findings point to the significance of understanding the extent of influence that social media platforms and SNSs have in terms of displaying and glorifying risky behaviors, such as alcohol use and excessive drinking. Past research showed that exposure to, and interaction with, alcohol-related social media posts is associated with greater alcohol use and heavy episodic drinking. In addition, as indicated by the virality findings, alcohol-related tweets potentially have greater reach than those without any alcohol reference, thus, elevating the influence of exposure to and interacting with alcohol displays on social media.
The display of normative behavior also adds to the potential power of social media that glorifies alcohol consumption. Descriptive norms reflect the extent to which a behavior is perceived to be performed, and people try to live up to these perceived descriptive norms (Cialdini et al., 1990; Neighbors et al., 2006; Neighbors et al., 2007). Out of all possible topics that could be the focus of a tweet, the findings here show that alcohol is a frequent topic as it was featured in 2% of the sample. Even more powerful is the fact that intoxication was the most frequent subtopic within alcohol tweets. People are likely to perceive that the norm for consumption of alcohol that leads to intoxication is even more frequent than it is in reality, and this is likely to make them believe that they must drink more to live up to this perceived norm. In addition, the reflection of injunctive norms, or approval of a behavior, is likely to exaggerate this effect. Here, alcohol-related tweets received significantly more likes than those that did not contain alcohol references. Likes connote approval of a behavior. These misperceptions about normative beliefs regarding health behaviors lead people to overestimate others’ negative health behaviors, and in turn increase the likelihood of their own negative health behaviors as they try to “live up to” incorrectly perceived norms (Park, Smith, Klein, & Martell, 2011).
From a policy perspective, our findings shed light on the need to regulate posting and interacting with alcohol-related content on social media. While previous studies have focused on the commercialization of alcohol posting on social media (e.g., advertising and marketing; cf. Alhabash et al., 2016), this study’s findings point to a greater need of a generalized policy discussion about alcohol displays on social media. This discussion is certainly in vain if system designers are not part of it.
Limitations and Future Research
There are a few limitations worth noting. First, despite the comprehensiveness of our coding scheme, our list of keywords was in no way exhaustive to capture every mention of alcohol. One of the challenges of automatic coding (i.e., machine learning techniques) is the inability to capture implicit language, metaphors, and misspellings. Therefore, it is plausible that our codebook might have restricted the inclusion of certain keywords to more comprehensively capture alcohol-related mentions in tweets. Second, our regression models, specifically the one predicting the number of likes, showed low explanatory power. Despite its significance, future research should attempt to include other features and use alternative data analytic methods (e.g., subsampling) to increase the potential for predictive power. Third, per the restrictions of Twitter API use, we could only randomly sample 1% of the Twitter universe during our specified time period. Despite the fact that we have acquired a random sample of tweets, this sample is only 1% of the entire tweet universe, and certainly does not warrant generalizability to the entire population of tweets. Finally, we collected data during the month of March, which includes a major celebration in the United States (St. Patrick’s Day) that is associated with alcohol use and overuse. Future research should conduct a time-series trend of the prevalence of alcohol-related tweets throughout an extended period of time.
Conclusion
The current study reported results of a large-scale data analysis of tweets and showed that 2% of the Twitter universe included mentions of alcohol, with the majority of those tweets referencing intoxication. Our findings also showed that in addition to tweet and Twitter user characteristics, the inclusion of alcohol-related references in tweets predicted the number of likes they received.
Footnotes
Appendix
Descriptives for All Variables Included in Statistical Analyses.
| Alcohol references | Frequency | Likes M (SD) |
Retweets M (SD) |
| All tweets (alcohol and non-alcohol) | 47,669,263 | 1.05 | .44 |
| Non-alcohol-related | 46,873,842 | 1.05 | .44 |
| All alcohol references | 795,421 | 1.21 | .42 |
| Alcohol use reference | 119,405 | 1.167 | .40 |
| Alcohol type | 156,979 | 1.10 | .28 |
| Intoxication reference | 306,949 | 1.29 | .46 |
| Going out | 166,174 | 1.28 | .48 |
| Cocktail | 36,922 | .87 | .28 |
| Brand | 67,179 | .96 | .32 |
| Tweet Structural Features | Raw M (SD) | ||
| Picture in tweet | 0.11 (0.31) | ||
| Num. of characters | 63.53 (38.34) | ||
| Tweet day of month | 16.81 (8.33) | ||
| Tweet hour of day | 11.23 (7.95) | ||
| Num. of hashtags | 2.63 (0.85) | ||
| Num. of mentions | 0.63 (0.97) | ||
| User Characteristics | |||
| Num. of followers | 1,811.66 (29,225.59) | ||
| Num. of all tweet likes | 5,793.998 (12,159.96) | ||
| Verified (celebrity) | 0.004 (0.07) | ||
| Picture as default | 0.004 (0.06) | ||
| Day user created account | 15.85 (8.80) | ||
| Month user created account | 6.26 (3.43) | ||
| Year user created account | 2011.56 (1.81) | ||
| Num. of user follows | 988.17 (5887.41) | ||
| Num. of tweet by user | 24,036.03 (50,881.53) | ||
| Content Emotionality | |||
| Clout | 49.79 (32.10) | ||
| Positive | 4.19 (7.47) | ||
| Negative | 2.40 (5.98) | ||
| Descriptive and Injunctive Norms | |||
| Descriptive norms | 0.10 (0.33) | ||
| Injunctive norms | 0.04 (0.19) | ||
| “I” pronoun | 4.64 (7.06) | ||
| “We” pronoun | 0.41 (2.10) | ||
| “You” pronoun | 1.96 (4.81) | ||
| “She/He” pronoun | 0.53 (2.48) | ||
| “They” pronoun | 0.26 (1.58) | ||
| Virality | |||
| Number of likes | 1.05 (28.80) | ||
| Number of retweets | 0.44 (21.09) | ||
Declaration of Conflicting Interests
The author(s) declared no potential conflicts of interest with respect to the research, authorship, and/or publication of this article.
Funding
The author(s) disclosed receipt of the following financial support for the research, authorship, and/or publication of this article: This research was funded by the Trifecta Initiative at Michigan State University.