
Abstract
Higher education institutions are facing challenges in navigating social, cultural, and political issues. The online presence of higher education presents a new set of opportunities and challenges; knowledge, news, and continuing education are increasingly disseminated online. Additionally, the public, student bodies and stakeholders are increasingly looking at reviews or seeking opinions via online and social media to form opinions on institutions. This analysis uses online and social media to analyze and compare perceptions of two public universities in Indiana, namely Purdue University and Indiana University. These two Indiana institutions are located in the same state, allowing for comparisons of public perceptions and reactions to different collegiate events for two institutions facing similar “local environments” politically, socially, and environmentally. The 2018 to 2021 study period allows for comparisons of volume and sentiment of online and social media about two universities during the most disruptive period of COVID-19. Deeper understanding of public perceptions of these institutions may facilitate effective communication and/or assist with decision making regarding the societal roles of institutions of higher education.
Introduction
Around 19 million students enrolled in college in 2023—both at the undergraduate and graduate level—, 73% out of which enrolled in public institutions (Hanson, 2023), demonstrating the prominent role of public institutions in higher education. More than half of Americans believe that the economic value of a college degree has increased according to the Winston poll for American Council on Education (Lederman, 2022). Public universities serve not just the students on their campuses, but also the public through stakeholder engagement, research, extension, athletics, entertainment, serving as cultural and/or social hubs, and by providing leadership on a variety of scientific and social issues.
The dawn of the internet has presented a new set of tools, opportunities, and challenges for university administrators; of relevance to this research is the data generated by internet users through online media as a tool to monitor the U.S. public’s pulse on institutions of higher education. As far back as 2012, over 90% of colleges in the United Sates and the United Kingdom were using social media as a medium to engage with students and their communities (Greenwood, 2012; Omoruyi & Rembielak, 2019; Shaw, 2014), highlighting the importance of online media and communications. In addition to higher education institutions, two commercial university rankers, Times Higher Education (THE) and Quacquarelli Symonds Ltd (QS), also actively engage in social media activities to communicate with audience of institutions such as faculty members, students, administrators, and/or governments (Shahjahan et al., 2023).
Online marketing strategy, which is a part of electronic Word of Mouth (eWOM) marketing (Litven et al., 2008; Song et al., 2021), has been demonstrated to be influential to people for purchase decisions (Prendergast et al., 2010; Tien et al., 2019). As online space is becoming a prevalent place for eWOM marketing, people also share information about experiences in online spaces such as social media platforms, forums, and consumers review pages for topics encompassing diverse industries such as tourism, retail and e-commerce, etc. Marketers of higher education institutions have adapted by enhancing engagement in online spaces to establish identity and build relationships with stakeholders such as students, faculty members, staff members, industry, communities, and government. More recently, higher education marketers are adopting online marketing strategies to develop quality relationships in online spaces with high school students making choices among universities for pursuing their higher education (Amani, 2022; Lažetić, 2019). Greenwood (2012) showed that 92% of the U.S. colleges reported their usage of social media in conjunction with their official websites as a method of engaging with their stakeholders. Shaw (2014) found 98% of U.K. universities invested in social media as a part of marketing strategies. A. B. Shields and Peruta (2019) and Hesel (2013) found that significant numbers of prospect students use social media as an information source when deciding which college or university to attend.
Higher education rankers such as THE and QS are also aware of their audiences using social media as an information source and actively engage them in social media space, deploying social media as a form of affective infrastructure to further sustaining, diffusing, and normalizing their rankings (Shahjahan et al., 2023; R. Shields, 2016). Simultaneously, eWOM marketing is elevated in importance considering the plethora of information sources in modern societies have led consumers to reduce their trust in traditional forms of mass advertising (Cheung & Thadani, 2012).
Many studies have examined the quality of the social media marketing strategies in the context of their impacts on students’ decision-making process on college choice. One part of such research addresses the importance of adopting online marketing strategies in higher education in seller perspectives (Clark et al., 2017; Jain et al., 2022; Mason et al., 2021; Peruta & Shields, 2017). The other part emphasizes a need to evaluate quality of such online marketing activities in receiver perspectives to validate the power/efficacy of the online marketing strategies in enhancing engagement/communication with stakeholders (Amani, 2022; Clark et al., 2017; Peruta & Shields, 2017).
Considering online media characteristics of going viral immediately and sometimes unexpectedly going out of control (Jung et al., 2021; Widmar et al., 2022), monitoring reactions of people to online activities of companies or institutions constitutes another critical part of the online presence. Thus, it is important for brand managers to monitor and “listen” to social media. Online and social media listening can aid institutions in being aware of negative feedback from/to stakeholders as well as supporting timely engagement for enhancing positive stakeholder relationships. Maintaining continuous engagement and successful relationships with stakeholders through online marketing in social media space is critical in service markets, inclusive of higher education (Jain et al., 2022).
Although there is a lot of interest in using social media to provide information to prospective students or other interested parties, there is little existing research on the public’s reactions to online media about higher education institutions. Instead, topics of prior studies focus on social media as a communication space for college students (Potts & Stebleton, 2023) or as a tool for improving students’ engagement (Schuster & Boulder, 2023). There is also existing work on how college students communicate in social media space and how it affects development of social networks or establishing identities during transitions to college (Potts & Stebleton, 2023).
Online stakeholder engagement can be analyzed by a data-backed approach as Schaninger and Lauricella (2020) discussed because stakeholders are encouraged to relay their thoughts and opinions in an online space (Degtjarjova et al., 2018), perhaps in ways that are more candid than in response to a survey. There is widespread attention and concern amongst public universities regarding survey response rates and student engagement through surveys (Nulty, 2008; S. R. Porter & Umbach, 2006; Saleh & Bista, 2017), which motivates the need to make use of alternative data collecting methods. For gathering unsolicited opinions or general perceptions, some studies conduct contents analysis to examine how people communicate in online spaces (Peruta & Shields, 2017). Clark et al. (2017) indicates that “following” a social media platform of a certain institution of higher education enhance students’ perceived relationship quality with the college followed. However, they looked into such activities on colleges’ social media involvement such as social media accounts owned by higher institutions (Clark et al., 2017; Peruta & Shields, 2017). Considering it is more likely to find positive thoughts in institutions’ own social media accounts and negative opinions in general review pages or forums (Schweidel & Moe, 2014), monitoring one’s own social media accounts may provide positively biased feedback to higher education institutions.
It would be impossible to study perceptions of higher education after 2020 without acknowledging the effects of the COVID-19 pandemic. According to a recent study on higher education, “In total 24% (n = 596) institutions engaged in-person instruction—by institutional sector, 34% of 4-year private institutions engaged in in-person learning followed by 4-year public (27%), 2-year private (22%), and 2-year public (13%) institutions” (Collier et al., 2021). Coming out of the acute phases of the pandemic, it is meaningful to understand where universities stand within society. The COVID-19 pandemic has had devastating impacts on all people across the globe, especially in in-person educational settings where it was a challenge to navigate best practices to reach people safely. Simultaneously universities and research institutions were leaders in developing and implementing science as solutions to pressing human health and societal problems. Turning to our digital connections, humans observed a big cultural shift in the way they interact with one another. For example, Shahjahan et al. (2023) mentions that the rankers’ (like Times Higher Education [THE] and/or Quacquarelli Symonds Ltd [QS]) such engagement of social media activities amplified over the COVID-19 pandemic. Researchers are able to monitor these digital platforms to better understand the public’s sentiment toward different institutions and their approaches to education and university life during those difficult times.
This study quantifies volume and sentiment of online media toward Indiana University and Purdue University and uses this innovative dataset to compare stakeholders’ perceptions toward different aspects of University life including sports, free speech, tuition and fees, and engagement activities. Of particular importance is the ability to compare online and social media—both volume and sentiment—toward the different policies and practices enacted to safely operate during the COVID-19 pandemic. For public institutions more broadly, knowing where they stand in the eyes of the public could inform data-driven decision surrounding strategic educational plans, public investments/funding, and international research communities.
Several relevant theories support ideas of conducting social media listening analysis. They are Theory of Reasoned Action (TRA), Uses and Gratifications Theory (UGT), and Causal-Chain framework in terms of organizational attributes. TRA discusses situations and motivations which people voluntarily participate and engage in personal communication (Ajzen & Fishbein, 1980) and social media activities (Hsu & Lin, 2008). UGT is a theory of mass communication (Eighmey & McCord, 1998) that has been applied to traditional media in an effort to understand customers’ behavior and needs. UGT has also received considerable attention in social media research as well particularly in studies of investigating how to figure and satisfy customers (G. M. Chen, 2010; Dholakia et al., 2004; C. E. Porter & Donthu, 2008). Organizational framework in Causal-Chain framework emphasizes how to apply social media for marketing orientation, customers’ opinion on and choice of products, brand, company (Carr et al., 2015; Y. Chen et al., 2011; Karakaya & Barnes, 2010). This study contributes broadly to other works incorporating these theories by expanding the research area of such theories into social media marketing strategies of higher education institutions.
Materials and Methods
Incorporation of Novel Online and Social Media Datasets
In the past, collecting data on public perceptions of institutions, events, or even products/services have been dependent on primary data collection, such as through surveys, interviews, or focus groups. But, as technology has evolved, researchers have begun to take advantage of accessibility to mass amounts of user-generated data available through online platforms (Widmar et al., 2020a). Digital media plays a huge role in everyday life; 82% of Americans have at least one form of social media tied to their person (Statista, 2021). Studying digital data analytics is a non-intrusive way to study public perceptions, known as Web 2.0, because researchers can understand published open opinions of the general population without being influenced by surveys or other outside motivations (Berthon et al., 2012).
Sentiment analysis through social media data collection is a research tactic that studies the positive or negative messaging or reactions to a certain topic in the digital space (Karim & Das, 2018).
[S]tudying language generally required the close reading of texts and turning huge swaths of texts into data wasn’t feasible. Now, with computers and digitization, tabulating words across massive sets of documents is easy. Language has thus become subject to Big Data analysis. (Stephens-Davidowitz, 2017, p. 76)
Online and social media listening is common in the private sector (Zuboff, 2019). This method has been used in some other areas of study such as; public perceptions of animals at agricultural fairs (Mahoney et al., 2020), USDA’s move out of Washington, DC (Widmar, 2020), public perception of eggs (Widmar et al., 2020c), public sentiment and volume of overall attention devoted to the zika virus versus simply the nuisance of mosquitoes (Widmar et al., 2020b), disaster relief (Widmar et al., 2022), and food safety and recalls (Jung et al., 2021, 2022).
Numerous search engines and social listening analytics capabilities have been developed and are utilized to facilitate social media data collection and analysis. For example, LexisNexis (2018) provides news, business sources, and searching capacities for government agencies and/or universities (Tonsor & Olynk, 2011). More recently with increased online activities, other online and social media listening platforms such as Brand 24, Brandwatch, and NetBase (Quid) have been developed.
Universities Selected for Comparison: Case Study of Public Institutions in Indiana, United States
Two universities were chosen for study in this analysis, Purdue University (PU) and Indiana University (IU). These two schools share proximity, size, and state government policies. Further, they are reasonably comparable geographically, although they have some discrepancies in student body populations and areas of focus. PU is located in northwest Indiana in West Lafayette. The total enrollment was 49,639 in the fall of 2020 with 8% of the student population being international students. The largest percentage of the student body is in the College of Engineering at 31% (Student Enrollment—Undergraduate Admissions—Purdue University, 2020). PU is Indiana’s Land Grant University (Morrill Act, 1862), establishing it among the total of 112 in the United States who serve the Land Grant Mission of extending knowledge to more individuals, particularly in the areas of engineering and agriculture (Ching, 2023). IU is located in southern Indiana in the city of Bloomington. In 2020 IU reported 45,328 students on their main campus. (Historical, 2021). Of those students, 12,839 are enrolled in the Kelly School of Business (School Profile, 2021).
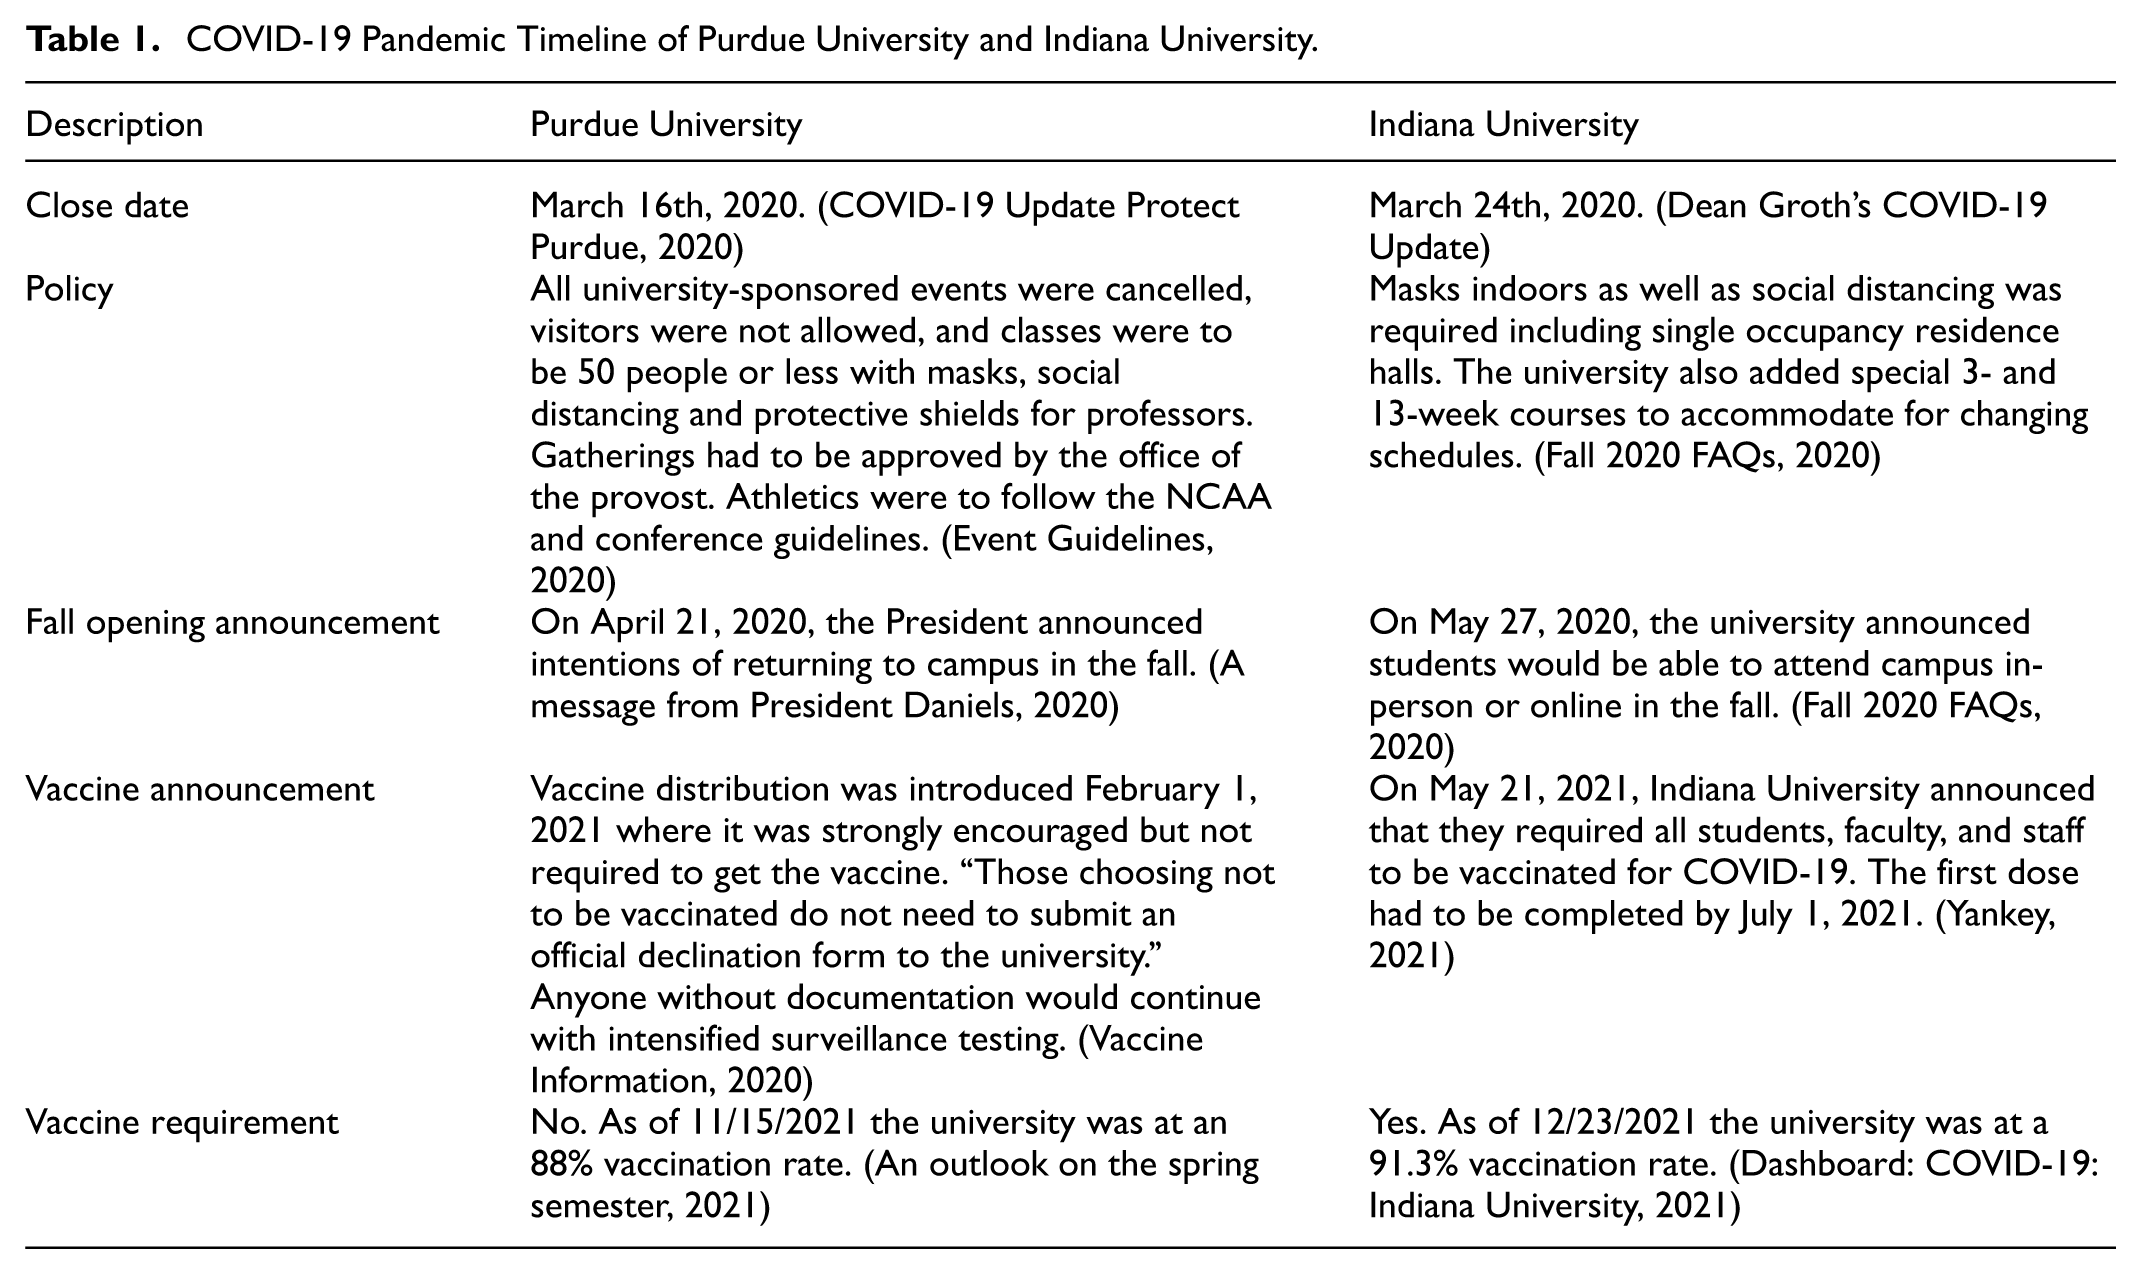
These two universities are well positioned to compare public perceptions of the university as the shared pandemic experiences with similar geopolitical environments. Table 1 specifies the timeline of actions taken by each university during the pandemic. As is shown in Table 1, the two universities took different actions on preventive actions; one notable difference was the vaccine requirement (Table 1). Comparison of the two universities with similar background/environment but different approaches of dealing with the COVID-19 pandemic may provide useful insights for understanding reactions of the general public to the decisions of two public institutions of higher learning (Table 2).
COVID-19 Pandemic Timeline of Purdue University and Indiana University.
Search Terms.

Data Collection and Analyses
Data on volume of mentions and sentiment of media was collected by conducting online and social media listening. The NetBase (now Quid) platform was used to parametrize searches of online and social media related to PU and IU from the 1st of 2018 through December 31st of 2021. Volumes of mentions, net sentiment (established through use of a Natural Language Processing [NLP]), top sentiment drivers, and sources of data were quantified for searches parameterized using with inclusionary and exclusionary search terms identified by researchers. Natural Language Processing (NLP) falls under the fields of computer science, linguistics, and artificial intelligence. NLP deals with how computers understand, process, and manipulate human languages (Harrison & Sidey-Gibbons, 2021). It is a field of artificial intelligence that allows computers to understand and process human language, both written and spoken, enabling them to interpret the meaning and context of text similar to how humans do; essentially, it’s the ability for a computer program to “read” and understand human language, like we do.
This 4-year timeframe, from 2018 through 2021 encompasses the COVID-19 pandemic allowing comparisons in reactions toward the two universities pre-pandemic and during various phases of the COVID-19 pandemic when the two universities announced and conducted different pandemic prevention practices. While searches are technologically possible across all languages, there are limitations of understanding caused by cultural context, slang, and shorthand. The scope for this data collection was limited geographically to within the United States and the U.S. minor outlying islands and searches were conducted in English exclusively. Considering that individual posts, comments, and accounts may disappear, be removed, or be reinstated by the authors or the platform, it is imperative to collect social media data over a reasonable period of time; collection of the data was conducted on March 1st, 2022.
Two stages of data collection were conducted. First, general searches for each of the two universities were conducted at weekly granularity for 2018 to 2021 based on search terms for the two universities. Primary search terms for PU were Purdue University, #Purdue, #PurdueUniversity, #boilermaker, #boilerup, #ThisIsPurdue, #GiantLeaps and for IU were Indiana University, #IndianaUniversity, #IU, #GoHoosiers, #goIU. The primary search terms specify posts or mentions generally related to PU and IU. Second, for there are lots of posts and mentions associated with the two schools in general not exclusively about pandemic, the data from the first step was filtered for years of 2020 and 2021 to exclusively capture postings related to the pandemic with additional search terms consisting of COVID-19, COVID, pandemic, coronavirus, covid, covid-19, covid19, COVID19.
Social media sentiment analysis identifies a positive, negative, or neutral sentiment toward the subject of posts or mentions which include the search terms specified. Search results including the specified search terms are analyzed for sentiment by NetBase’s (now Quid’s) NLP engine (NetBase, 2010, 2015, 2021a, 2021b, 2022; NetBase—NetBase Quid, 2021). NetBase (2010) explains how they developed their NLP engine and utilize it to conduct accurate sentiment analysis by capturing complicated context such as nuance and/or sarcasm. However, NetBase also notes challenges associated with the NLP engine in developing such accurate sentiment analysis due to languages used in social media such as misspells, poor grammar, colloquialisms, forum-specific acronyms, rapidly evolving “slanguage” and “urban words.” Utilizing the NLP, words or terms are categorized into positive (such as “love” or “like”) and negative sentiment (such as “hate”). There are also neutral terms for which no positive or negative sentiment is identified. The net sentiment is a measurement of comparing positive and negative posts, aggregated across all posts for a particular topic to calculate a single metric called the net sentiment. The net sentiment of topic or search is calculated as the difference between the percentage of positive posts and negative posts and is thus bounded between +100% and −100% (Jung et al., 2021, 2022; NetBase, 2022; Widmar et al., 2020b; Widmar et al., 2022).
Results and Discussion
This study covers 4 years from January 2018 to December 2021 and reports search results annually. Table 3 summarizes annual online media activity, providing the annual total number of mentions and average of daily net sentiment related to the primary and secondary search results. In general, the number of mentions about both PU and IU has decreased over the 4-year period. Considering increases in general social media activities related to the COVID-19 pandemic time period as is found in Jung et al. (2022), the decrease suggests that people might have talked relatively less about the Universities during the study period. Large-scale campus events and collegiate sporting events became less frequent due to the COVID-19 pandemic, which may explain decreased mentions during the study period. There is a drop in net sentiment in the COVID-19 specific searches compared to the results from the general searches about the Universities. Decreased net sentiment of media analyzed reflects the challenging situation over the pandemic period, albeit alongside lower volumes of university-related media.
Mentions and Net Sentiment by Year from January 1, 2018 to December 31, 2021.

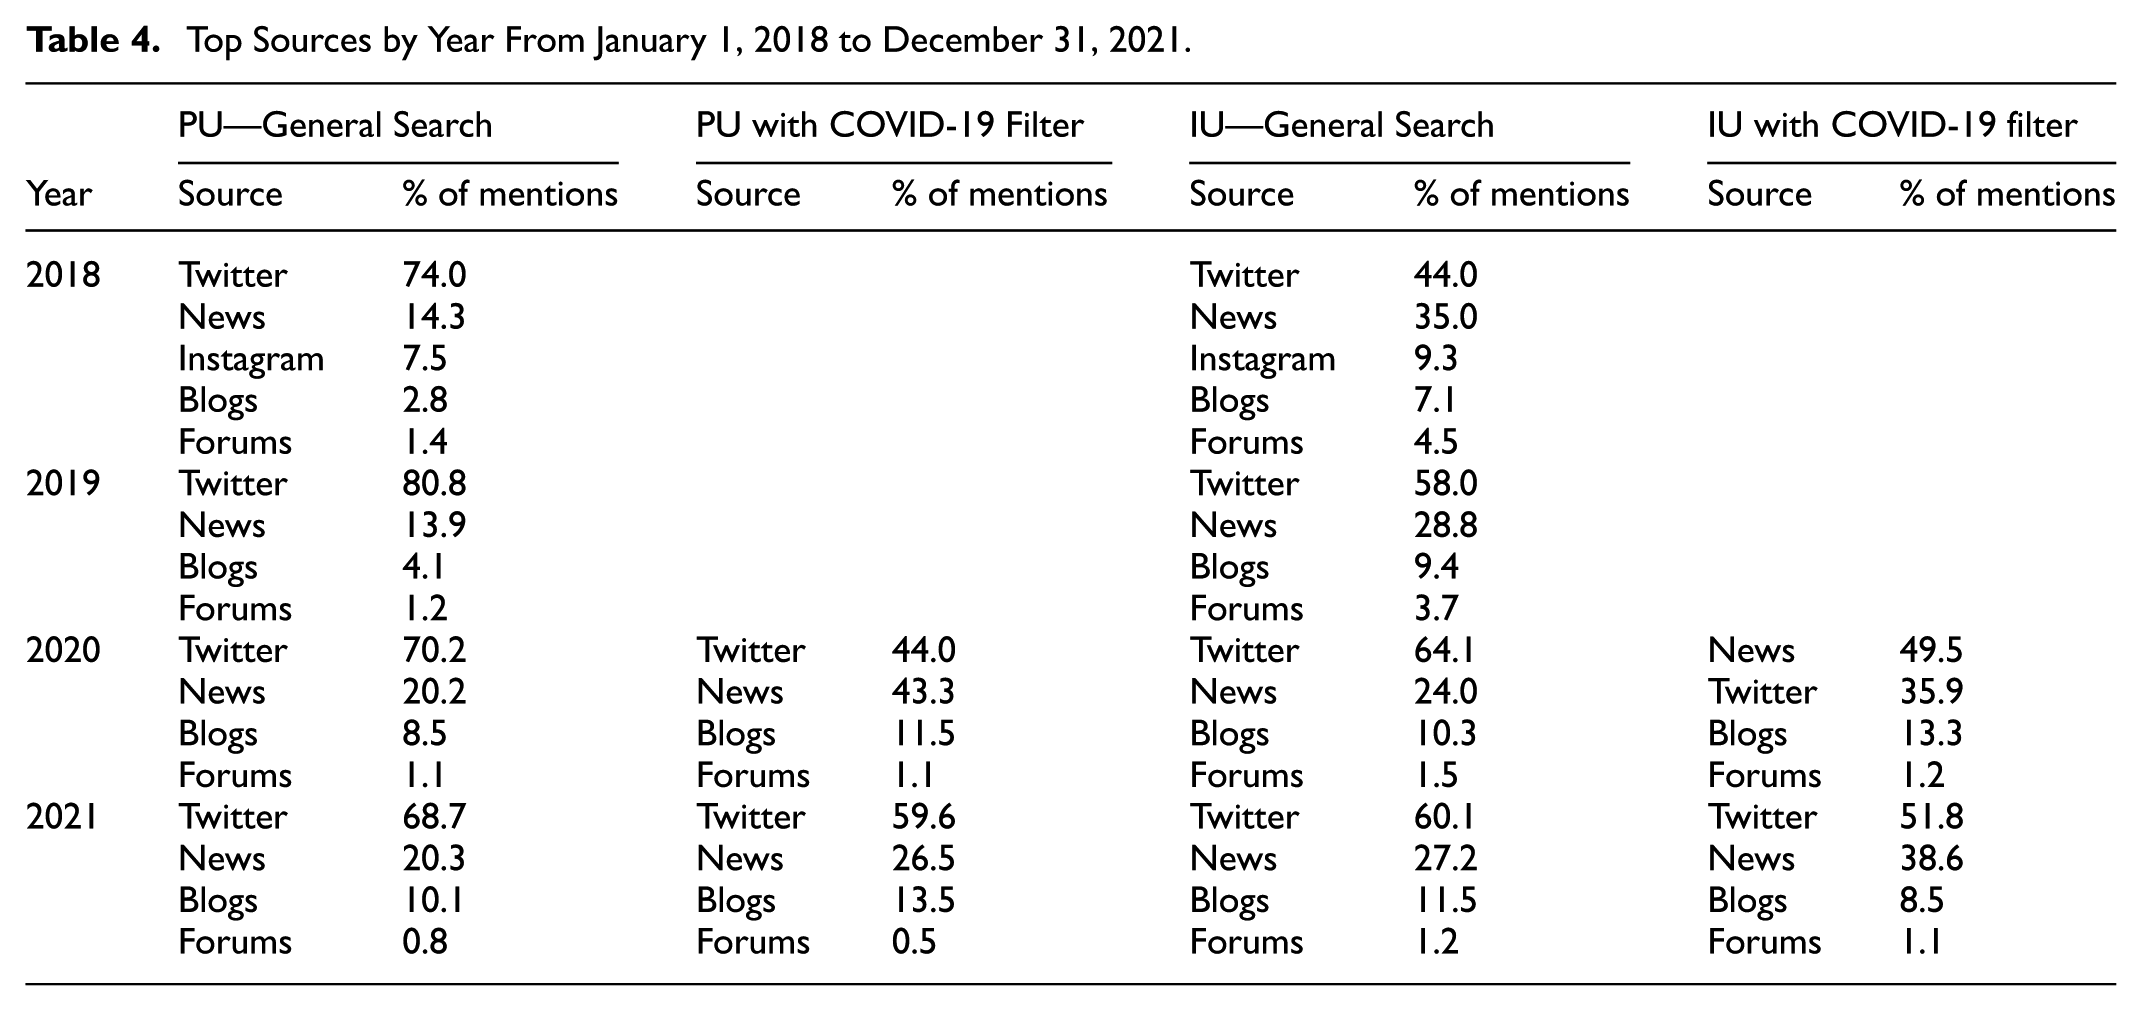
Table 4 presents the top sources of search results for the general searches of the two universities from 2018 to 2022 and the COVID-19 filtered searches from 2020 to 2021. Twitter (now X) comprised the largest portion of search results all general searches followed by News. Before the pandemic, the majority of the PU search results were on Twitter/X, 74% in 2018 and 81% in 2019, while IU data was comprised of 44% Twitter and 35% News in 2018 and 58% Twitter/X and 29% in News in 2019. During the pandemic, Twitter/X still remained the top source although mentions of PU and IU in news grew as the pandemic generated wide-reaching media coverage about campus adaptations and policies.
Top Sources by Year From January 1, 2018 to December 31, 2021.
Online communication by and about higher education institutions is not limited to only academic topics. Additional value creating activities of higher education institutions are engaging stakeholders, connecting with alumni and community members, and building trust and/or commitment (Clark et al., 2017; Farooqi, 2014; Jain et al., 2022; Korpershoek et al., 2020). Hawley et al. (2021), Korpershoek et al. (2020), Farooqi (2014), and Dush and Amato (2005) suggest that relationship quality between institutions and students can be nurtured by fostering affection, sense of belonging, intimacy, wellbeing, and care. Hesel (2013) also shows that students search for more beyond such typical information as major, education quality, or dorm rooms.
Figures 1 through 6 describe daily changes in mentions and net sentiment for individual years of study. Before the COVID-19 pandemic, reactions to PU had expected rises and falls during basketball and football seasons (Figures 1a and 2a). In 2018, mentions increased over the March Madness time period in March and then in October of 2018. PU observed a large spike in mentions for the win over Ohio State but had a fall in sentiment shortly after this event (Figure 1a). The story that gained popularity was Tyler Trent, a Purdue freshman, had predicted the win as he was battling cancer. The game was dedicated to him and “#CancerSucks” was aimed to raise money and awareness for cancer research and treatments. The word “Sucks” contributed to a negative sentiment in this case although the context is not in this nuanced case. In March of 2019, the mentions soared with people talking about March Madness. University athletics often attract attendees or enthusiasts who use university related hashtags, like “#BoilerUp.” This is consistent with findings from Peruta and Shields (2017) that certain topics related to athletics significantly increase audiences’ engagement in social media (Peruta & Shields, 2017).
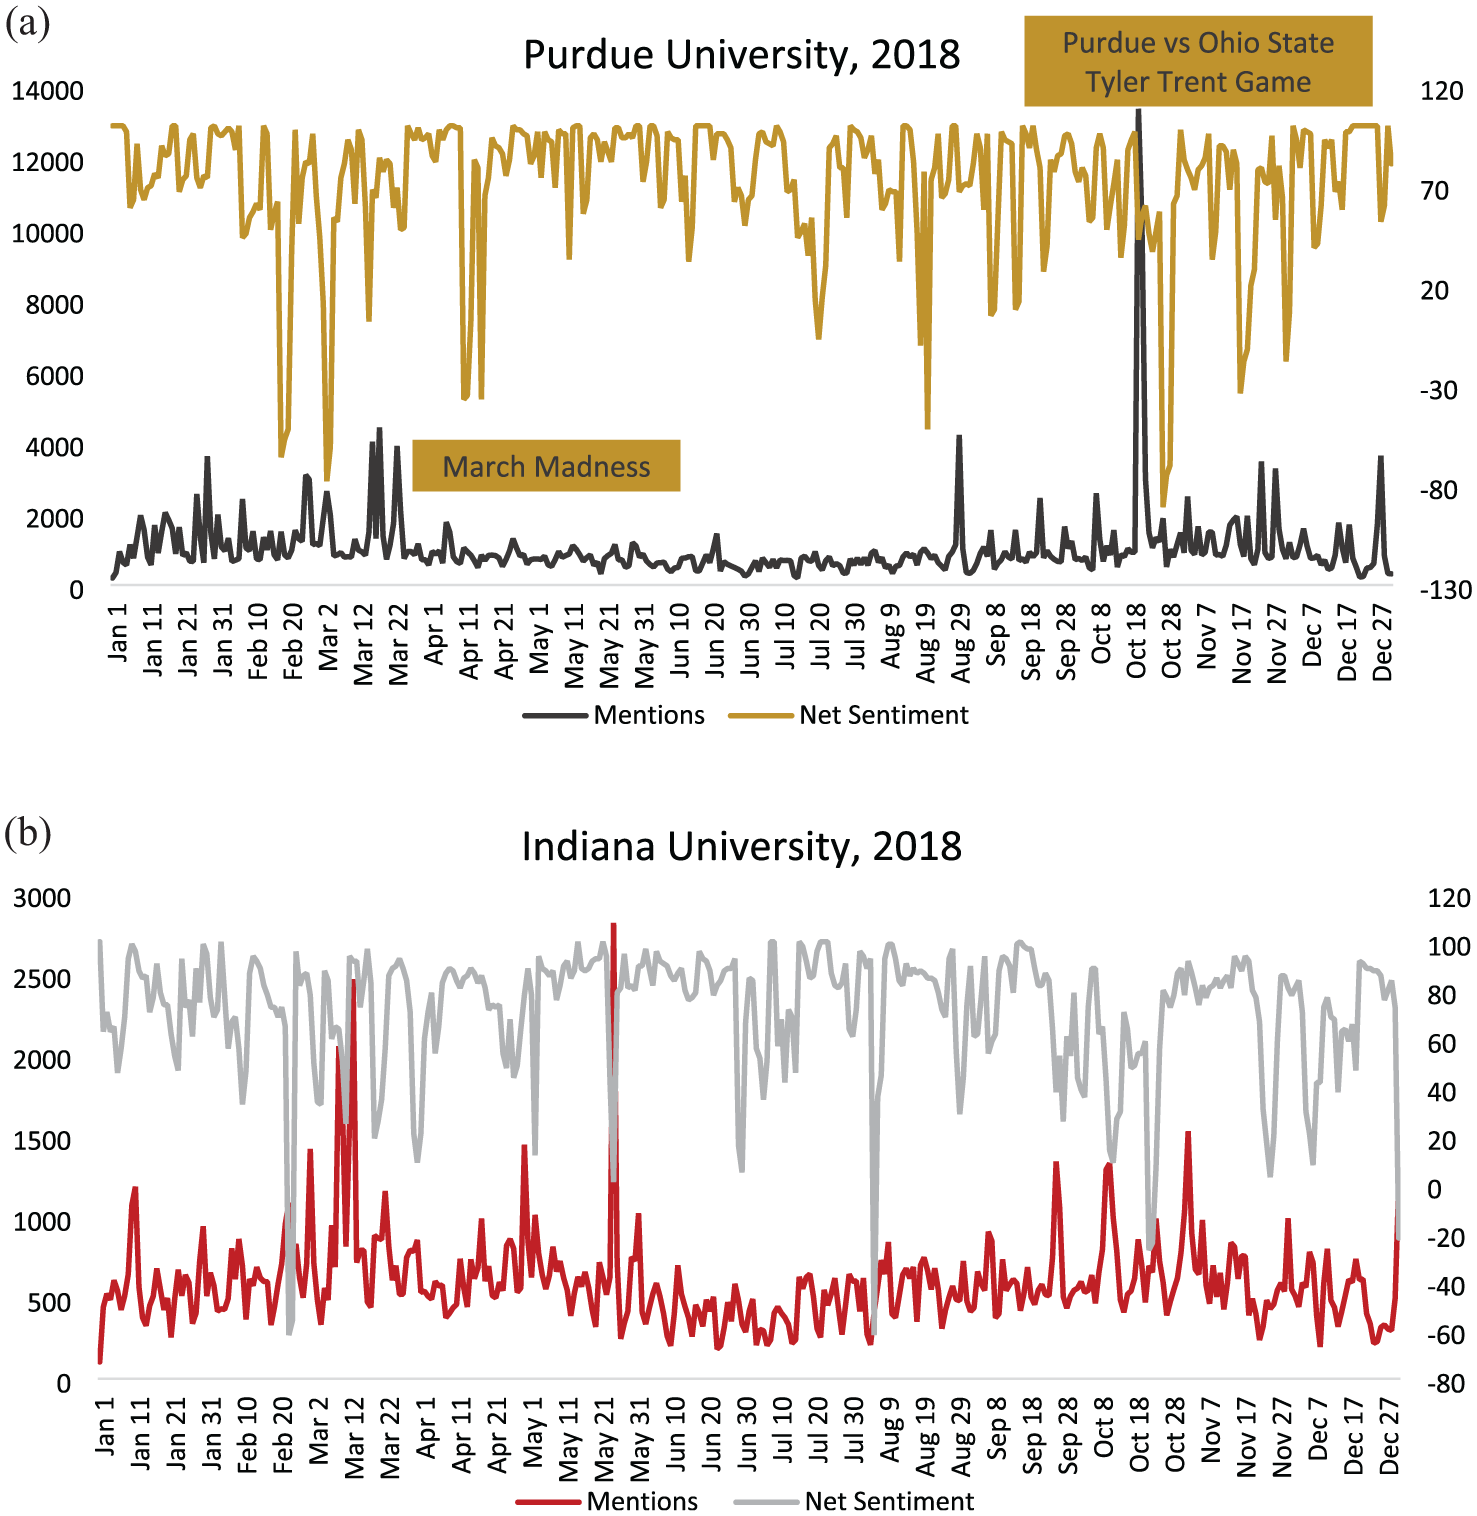
Daily mentions and net sentiment for the year of 2018 from the general searches: (a) Purdue University and (b) Indiana University.

Daily mentions and net sentiment for the year of 2019 from the general searches: (a) Purdue University and (b) Indiana University.
Discussions of IU covered broader issues than did PU. In addition to sports events, other significant increases in online media attention came from issues such as “shooting recovery in IU hospital” in early June of 2018 (Figure 1b) and “Racist Econ Professor not fired due to freedom of speech” in November, 2019 (Figure 2b). In particular, IU’s big spike in mentions happened in November of 2019 due to a professor keeping his tenure in spite of having made racist comments. There was an increase in the volume of people talking about the university, but it was in a negative light due to the situation.
In 2020, the COVID-19 pandemic swept the nation out of its routines. People reacted to pandemic-related issues in PU and IU search results, but topics varied from usual collegiate issues to the pandemic. Figures 3 and 4 illustrate this divergence from the usual online higher education conversations. Figure 3a shows that conversations in social media spaces were about a research center and extension service (farmer survey) of the Department of Agricultural Economics at PU, the tuition freeze, and the suspension of students for an off-campus party during the pandemic. Figure 3b also presents similar aspects for IU with online media devoted to topics such as suspension of classroom teaching, K-pop, and death of former football player during riots in Indianapolis. In 2021 when people started to show pandemic fatigue and/or situations began to improve, topics discussed became more diverse. PU was still talked about with regard to sports and social activities around campus (Figure 4a). On the other hand, IU was discussed relatively more with regard to their vaccine mandate and reactions to the mandate (both locally and nationally; Figure 4b).

Daily mentions and net sentiment for the year of 2020 from the general searches: (a). Purdue University and (b) Indiana University.

Daily mentions and net sentiment for the year of 2021 from the general searches: (a) Purdue University and (b) Indiana University.
Given that emotion and psychometric evaluation for the relationship with higher education institution is also important in higher education marketing (Kautish et al., 2021), people may give attention to how colleges coped with the COVID-19 pandemic, especially on campus where most activities happen in close quarters. Being aware of the concerns, institutions of higher education implemented varieties of COVID-19 prevention practices and mitigation efforts such as online learning, requirement on entry screening, mask wearing, vaccination, etc. A survey conducted by Hawley et al. (2021) found that students’ biggest concerns were centered on whether the upcoming academic year would be in-person or online, quality of online learning if it would be fully online, how they maintain relationship with instructors and peers, etc. When it comes to safety during the pandemic, students expressed varied concerns about how their schools managed the pandemic situation as well as how they personally should deal with it with fear of unintentional transmission of the virus (Hawley et al., 2021). Comparisons in reactions to the pandemic among different higher education institutions may allow insights for maintaining engagement and successful relationships with stakeholders when facing uncertainty and/or adapting to changing public and societal expectations.
The filtered search results (Figure 5) present how topics related to the pandemic and universities’ preventive efforts were discussed in online and social media spaces, albeit small in magnitude of mentions relative to the overall media about PU and IU. The number of mentions in the searches filtered for the COVID-19 accounts only for 10% of total mentions in 2020 and 4% in 2021 for PU and 13% in 2020 and 20% in 2021 for IU. Thus, the majority of online media was about topics other than the pandemic and although it was incredibly disruptive to normal University operations.

Daily mentions and net sentiment from 2020 to 2021 filtered with the COVID-19 search terms: (a) Purdue University and (b) Indiana University.
Search results when filtered with COVID-19 search terms show that online and social media clearly track the pandemic-related issues experienced around the two universities. When it comes to PU, for instance, mentions and sentiments increased upon such announcements as transition to online classes, the PU president’s comment on its preventive efforts, suspension of students for their off-campus party, and comparison of vaccination policy between PU and IU (Figure 5a). Figure 5b also show that the highest peak of mentions on IU is about the Supreme court’s declining request to block the vaccine mandate.
In addition, there are discrepancies in topics captured, the number of mentions, changes in mentions over time, net sentiment, and its movements for each university (Figures 1 through 5). A noticeable difference in the pandemic prevention efforts between the two universities is the vaccine requirement; IU requiring it while PU not requiring it but encouraging it strongly (Table 1), and it is captured in the search results around August 3rd, 2021 (Figure 5a).
Tables 5 and 6 present drivers of both positive and negative sentiment across search results. Over the 4-year study period, for PU, positive sentiment drivers encompass such topics as sports (drivers as Win, beat Northwestern 24-22, rally for 24-20 win, and game winning streak), admissions related posts (drivers as offer), and campus living conditions (drivers as foster vibrant academic community, celebrate diversity; Table 5a). Negative sentiment drivers also include sports (e.g., lost, game vs. Penn State, miss game), classroom related topics (such as professor, student, write), and pandemic related topics such as suspend 36 students in 2021 (Table 5b). Sentiment drivers for IU cover more diverse topics with relatively less focus on athletic events. Positive sentiment was driven by topics such as admission related posts (like offer), education topics (business school professor, scholarship, students, faculty), and cultural issues (#JongHyun in speech, top 50 beautiful campus, amazing visit; Table 5b). Negative drivers are even more diverse for IU. For example, drivers include such words like suspend fraternity, former Indiana University driver, attack Jewish student, not fire professor, and pandemic issues (suspend classroom teaching, COVID-19, COVID vaccine mandate).
Sentiment drivers from the general searches.

Note. n is the total number of mentions with terms that such sentiments as likes and dislikes are expressed, respectively. This is based on the actual words extracted from social media and lower letters are used for the first letter of each. Table contains only top five sentiment drivers and all drivers are summarized in Appendix 1.
Sentiment drivers from the searches filtered with the COVID-19 search terms.

Note. n is the total number of mentions with terms that such sentiments as likes and dislikes are expressed, respectively. This is based on the actual words extracted from social media and lower letters are used for the first letter of each. Table contains only top five sentiment drivers and all drivers are summarized in Appendix 1.
When the general searches were filtered by the COVID-19 search terms, sentiment drivers are unsurprisingly concentrated on COVID-19 related topics (Table 6). People react almost immediately online to real world event, which is a defining characteristic of social media (Jung et al., 2022). Sentiment drivers filtered by the COVID-19 searches clearly present the differences in topics between the two schools studied (Table 6). Differences in the pandemic preventive practices enforced on campuses might have led the discrepancies in social media reactions. The main discrepancy in approaches to on-campus safety was the vaccine requirement by IU in 2021, which was talked about and is evident in the sentiment drivers collected. In contrast, PU very strongly encouraged the vaccine and enforced more rigorous testing for those who did not show proof of vaccination. But, Purdue stopped short of a mandate of vaccination (Table 1). The vaccine mandate appears to have driven significant online media reaction in the case of online media about IU which is absent in the 2021 discussions about Purdue. The actions undertaken by institutions to protect public health were informed by a variety of factors, some of which may be local to each individual institution.
It is found that people engage differently to college marketing posts depending on institution types (Peruta & Shields, 2017) and/or media types (Duncan & Everett, 1993). This suggests that communicators may want to be informed about people’s reaction to their online marketing activities to implement more efficient higher education marketing strategies (Peruta & Helm, 2018). Higher education institutions adopt online marketing as one of their eWOM strategy for building identity and enhancing relationship with its stakeholders such as students, faculty members, staff members, industry, communities, and government (Omoruyi & Rembielak, 2019). Public communication on behalf of higher education institutions addresses diverse needs and often requires a portfolio of strategies to reach audiences encompassing current and prospective students, parents and family members of current or prospective students, alumni, direct stakeholders of University activities, and increasingly, the general public/society.
Conclusions
This study used online and social media volume and sentiment data about two public institutions in the state of Indiana, PU and IU, to study public perceptions of the two universities for the time period between January 2018 and December 2021. This study finds meaningful variations both in volume and sentiment surrounding PU and IU during the study period. The volume of online and social media generated around PU was generally larger than that of IU in 2018 and 2019 but was less than IU in 2020 and 2021. Even with student bodies are of similar size (47,527 students overall in 2023 at IU and 52,211 at Purdue, both at their main campus), there were notable variations in online media volume as well as the proportion of total online media about each institution that involved COVID-19 during 2020 and 2021. Twitter/X was the most common source for online mentions about both PU and IU, although much more prominently in the PU data.
The general search results reveal that discussions of PU are focused more on sports events while IU is discussed in reference to a broader range of events over the 4-year period. This result was surprising given that IU generated around 45% more revenue from their athletic program than PU in 2022 ($166.7 M vs. $115.1 M), making IU the 13th largest revenue athletic program in the United States (Langdon, 2023). Overall, the pandemic related topics have not been discussed as much in online spaces for both universities, comprising 10% to 20% of the total mentions about the two institutions. When filtered with COVID-19 search terms during the COVID-19 pandemic however results mostly focus clearly on pandemic-related issues and there were distinctly different online and social media responses to the two school’s approaches to on-campus safety, most obviously seen in the media mentions of the vaccine mandate at IU.
Institutions of higher education are a significant part of the communities in which they operate both locally/residentially and in the global academic community online. Understanding of perceptions of various institutions, especially during a global challenge such as COVID-19, can help inform communication campaigns by institutions of higher education. Future studies may wish to study online and social media data about public institutions during time periods with less obvious or universal disruptions (as COVID-19) to determine how responses may vary to different types of challenges or events.
Footnotes
Appendix 1
All Sentiment Drivers From the Searches Filtered With the COVID-19 Search Terms.

| Purdue University | Indiana University | |||||||
|---|---|---|---|---|---|---|---|---|
| 2020 | 2021 | 2020 | 2021 | |||||
| Positive or Negative Sentiment | Drivers | % of mentions | Drivers | % of mentions | Drivers | % of mentions | Drivers | % of mentions |
| Positive | n = 330 | n = 203 | n = 394 | n = 1,412 | ||||
| Take two different approach | 6.06 | Win $ 9,992 | 34.48 | Suspend classroom teaching | 17.77 | Faculty | 15.79 | |
| Come up with approach | 6.06 | Offer chance at win | 7.88 | COVID-19 | 17.77 | Intact | 11.40 | |
| Consistent to student | 5.45 | Develop autonomous robot | 5.91 | Address claim | 10.15 | Prevail | 11.40 | |
| Clear to student | 5.45 | Backing | 5.91 | Take two different approach | 5.08 | Due process | 8.92 | |
| Purdue University nursing professor | 5.45 | Forefront | 5.42 | Keep staff safe | 5.08 | Student | 8.57 | |
| Lend expertise | 5.15 | Launch free tuition contest | 4.93 | Free high-speed internet access | 3.81 | Put safety | 7.22 | |
| Lend resource | 5.15 | Virtual educational event | 4.93 | Recommend | 3.30 | Put well-being | 7.22 | |
| Cope with crisis | 4.55 | COVID-19 vaccination policy | 3.94 | Capability to test | 3.05 | Health | 3.90 | |
| Provide resource for generation | 4.24 | Give choice | 3.45 | Coronavirus | 2.79 | Design for well-being | 3.90 | |
| Develop handheld paper device | 3.94 | Offer | 2.96 | Suspend on-campus class | 2.54 | Requirement | 3.19 | |
| Develop new COVID-19 test | 3.64 | Announce | 1.97 | Offer socially distant alternative | 2.54 | Honor Anthony Fauci | 2.97 | |
| Support direct-to-consumer greenhouse | 3.64 | Encourage boilermakers to vaccinate | 1.97 | Provide free Wi-Fi access | 2.54 | Protect public health | 2.90 | |
| Design direct-to-consumer greenhouse | 3.64 | Receive 1-year award | 1.48 | Stop in class meeting | 2.54 | Vaccine mandate | 2.34 | |
| Provide insight | 3.64 | Member | 1.48 | World-class researcher | 2.54 | Offer religious exemption | 1.42 | |
| In-home greenhouse | 3.33 | Encourage vaccine | 1.48 | Positive | 2.54 | Offer chance at win | 1.13 | |
| Provide update | 3.33 | Professor | 1.48 | University | 2.03 | Ease vaccination requirement | 1.06 | |
| DE test | 3.03 | Capture class a trophy | 1.48 | Innovation | 2.03 | Require COVID-19 vaccine | 0.78 | |
| Cautiously optimistic | 3.03 | Celebrate in person | 1.48 | Consistent to student | 1.78 | Win in court | 0.78 | |
| Official | 3.03 | Offer two in-person ceremony | 1.48 | Clear to student | 1.78 | Offer for those | 0.78 | |
| Keep school | 3.03 | Offer Info | 0.99 | Growing coronavirus outbreak | 1.78 | Rich curriculum | 0.78 | |
| Ambitious plan to reopen | 3.03 | Provide fairly simple plan | 0.99 | Offer condolence | 1.52 | Lower cost | 0.71 | |
| Negative | n = 263 | n = 140 | n = 580 | n = 764 | ||||
| Suspend 36 student | 34.60 | Suspend 36 student | 26.43 | Suspend classroom teaching | 14.66 | COVID-19 | 13.74 | |
| Fan | 7.60 | Find farmer sentiment weaken | 9.29 | 40 Greek house | 10.17 | Quarantine | 12.57 | |
| Communicate coronavirus case | 7.60 | student | 7.14 | COVID-19 | 8.28 | 40 Greek house | 12.57 | |
| Student | 6.46 | Post criticism | 7.14 | Quarantine | 8.28 | COVID vaccine mandate | 10.73 | |
| COVID-19 | 5.32 | Create breakthrough #COVID19 | 7.14 | Tuition reimbursement | 7.76 | COVID vaccination requirement | 7.98 | |
| Respond to pandemic | 3.80 | Do genome virus | 7.14 | Tuition reimbursement | 7.76 | Sue | 7.72 | |
| Test for COVID-19 | 3.80 | Quarantine | 7.14 | Suspend on-campus class | 6.21 | File federal lawsuit | 5.37 | |
| Update COVID case | 3.80 | Not have mandate | 4.29 | Kill people | 5.17 | COVID VACCINE MANDATE | 5.24 | |
| COVID-19 pandemic | 3.80 | Vaccinated against COVID-19 | 3.57 | Suspend student | 3.79 | Violate constitutional right | 4.32 | |
| Startup | 3.42 | Scientist | 2.86 | Communicate coronavirus case | 3.45 | Student | 4.19 | |
| File lawsuit | 2.66 | Suspend | 2.86 | 4 Indiana university | 3.10 | Draw lawsuit | 2.62 | |
| Make it university violation | 1.90 | Warn about potential | 2.86 | No requirement to test | 2.41 | Violate recent law | 1.83 | |
| Draw criticism | 1.52 | Team | 2.14 | Have no requirement | 2.41 | Prove concern for patient | 1.44 | |
| Cancel university sponsored travel | 1.52 | Track malaria spread | 2.14 | Suspend classroom instruction | 2.24 | See spike in syndrome | 1.31 | |
| Make headline with letter | 1.52 | Refer to coronavirus | 1.43 | Researcher | 2.07 | Doctor | 1.31 | |
| Remark | 1.52 | Professor | 1.43 | President | 2.07 | Have no obligation | 1.18 | |
| Suspend cooperative house | 1.52 | Ignore warning | 0.71 | Outbreak of COVID-19 | 2.07 | Turbulent one | 0.79 | |
| Cite case | 1.14 | COVID-19 | 0.71 | Settle lawsuit | 1.90 | Not have mandate | 0.79 | |
| Virologist David Sanders | 1.14 | COVID vaccination mandate | 0.71 | Freshman | 1.90 | Deny request | 0.79 | |
| Force to leave campus | 1.14 | Exposed to coronavirus | 0.71 | Write about Boredom | 1.72 | Violate HEA 1405 | 0.65 | |
| Suspend university sponsored travel | 1.14 | Warning of expert | 0.71 | Raise tuition | 1.72 | Indiana University’s COVID-19 | 0.65 | |
Ethical Considerations
There are no human participants in this article.
Consent to Participate
Informed consent is not required.
Funding
The authors received no financial support for the research, authorship, and/or publication of this article.
Declaration of Conflicting Interests
The authors declared no potential conflicts of interest with respect to the research, authorship, and/or publication of this article.
Data Availability Statement
The data that support the findings of this study are available on request from the corresponding author, Jinho Jung.