
Abstract
This article explores how network centrality and structural holes of firms’ supply chain network shape its innovation performance and how supply chain stability moderates these relationships. Drawing on 2,328 relationships among China-listed manufacturing firms, we constructed a comprehensive ego-network of supply chains and empirically tested these relationships. The findings suggest a nonlinear (U-shaped) effect of supply chain network centrality and structural holes on innovation performance, indicating that either a very low or high level of network centrality and structural hole is beneficial to firms’ innovation. Additionally, we discovered that the effect of network centrality and structural hole on firms’ innovation performance are weakened and strengthened, respectively, by the stability of their supply chain network. This study provides a plausible explanation for the dual impact of supply chain network embeddedness (i.e., network centrality and structural holes) and network stability on innovation performance, highlighting a need to strategically optimize firms’ supply chain network embeddedness while managing supply chain network’s stability to enhance innovation performance.
Keywords
Introduction
Supply chains are essential for value creation and economic growth, as a firm’s competitiveness increasingly depends on interconnected networks rather than solely on individual enterprises (Koka & Prescott, 2008; Prabheesh & Vidya, 2025). In today’s dynamic markets, relying solely on internal research and development is insufficient for fostering innovation or achieving a competitive advantage. Consequently, many firms pursue external collaborations to access complementary knowledge, capabilities, and resources (Cavallo & Burgers, 2024; Hirani et al., 2025).
The relationship between network structure—specifically network centrality and structural holes—and innovation performance is well-established (Bouncken et al., 2015; Kumar & Zaheer, 2019; Li et al., 2015a; Zhang et al., 2024). However, the impact of network stability has been largely overlooked (Cao et al., 2019). Previous studies in this area have produced inconclusive results (Bouncken et al., 2015; Kumar & Zaheer, 2019; Li et al., 2015b), highlighting a gap in understanding the factors contributing to these discrepancies. It is crucial to consider how network members evolve over time while the overall structure remains stable, suggesting the need to account for network stability when assessing its effect on innovation performance. We define supply chain network stability as the persistence of inter-organizational relationships within a supply chain over a specified period, reflecting the continuity of ties among firms, such as suppliers and customers (Kumar & Zaheer, 2019).
To address this gap, our study has two primary objectives grounded in resource dependence and social network theory: (1) to investigate the impact of network structure—specifically network centrality and structural holes—on innovation performance and (2) to examine how the stability of supply chain networks moderates these relationships. We believe existing research may have undervalued the role of supply chain network stability in explaining variations in the relationship between network embeddedness and innovation performance. Here, network stability is defined as the extent to which a firm’s network configuration remains consistent over time (Kumar & Zaheer, 2019). By constructing a supply chain network distance weight matrix, we assess the interplay between network embeddedness and stability regarding innovation performance.
Our study contributes to the application of resource dependence theory (RDT) and social network theory within the context of supply chain networks and innovation performance. RDT posits that firms must effectively manage dependencies on external resources to achieve strategic goals, including innovation (Steensma et al., 2000). In supply chain networks, firms in central positions can better manage these dependencies, enhancing their innovation capabilities by accessing critical resources and information (Reck et al., 2022). Social network theory explains how network structures—such as centrality and structural holes—facilitate the flow of information and resources essential for innovation (Reck et al., 2022; Wang et al., 2018). Firms occupying structural holes can act as brokers, connecting different parts of the network and gaining access to diverse, non-redundant information that fosters innovation (Burt, 2010). By integrating RDT and social network theory, this study clarifies how variations in network structure (network centrality and structural holes), moderated by supply chain stability, influence innovation performance.
We empirically test our hypotheses using panel data from the top five suppliers and customers disclosed in the annual reports of listed companies from 2019 to 2021, supplemented by spatial autocorrelation analysis for pre-testing.
This study makes three significant contributions. First, we clarify inconsistencies in prior research regarding the relationship between network embeddedness and innovation by validating a U-shaped relationship. We propose that contingent factors influence this relationship, where supply chain network stability may weaken the U-shaped relationship for network centrality while strengthening it for structural holes. Second, we introduce a perspective on network membership change, emphasizing the importance of alterations in network constituents. Unlike most research that focuses solely on a firm’s network structure, we argue that changes in network members and the nature of relationships significantly impact the effects of network embeddedness on innovation performance. Overall, this study lays the groundwork for future research on the complex and evolving dynamics of supply chain networks and their implications for innovation and organizational behavior.
The structure of this article is as follows: the next section reviews the relevant literature, followed by the theoretical framework. We then detail our research methods, including data collection and analysis. A baseline network knowledge spillover spatial autocorrelation pre-test follows. Subsequently, we discuss the empirical findings and conclude with a summary of key insights and their implications for theory and practice.
Literature Review
Social network literature identifies two primary dimensions of network embeddedness: positional and structural (Gulati & Gargiulo, 1999).
Positional embeddedness refers to a firm’s position within the network, often measured by network centrality. A firm with high network centrality enjoys a prominent status, granting it substantial access to valuable information and resources (Cui et al., 2018; Godart et al., 2014; Godart et al., 2014; Su et al., 2025). This central position enhances the firm’s bargaining power, enabling more effective negotiations with other network members (Brass, 1992; Kamate & Kumar, 2024).
Network centrality specifically denotes the degree to which a firm occupies a strategic position relative to others in the network. It reflects the firm’s power and influence, indicating how well it can control the flow of resources and information (Gnyawali & Madhavan, 2001; Kamate & Kumar, 2024). A firm’s relative centrality reveals disparities in resource access and power dynamics among network members (Yang et al., 2018; Su et al., 2025). The more central a firm is, the greater its influence over collaborators (Fan et al., 2025; Liu, 2019), fostering stronger relationships that ultimately contribute to its success (Reagans & McEvily, 2003). Research indicates that firms with higher network centrality benefit from increased proximity to other organizations, significantly enhancing their innovation processes (Cavallo & Burgers, 2024; Su et al., 2025).
Supply chain network embeddedness encompasses the integration and interdependence of a firm within its supply chain network. It is characterized by positional advantages (network centrality) and structural characteristics (like the presence of structural holes) that facilitate resource exchange and innovation. This concept underscores the importance of both a firm’s position within the network and the nature of its relationships, collectively influencing its ability to leverage resources, share information, and drive innovation.
Network Centrality and Innovation Performance
A considerable body of research has examined the relationship between network centrality and firm performance, particularly in terms of innovation. However, findings have been inconsistent, with positive, negative, and nonlinear results, leading to confusion about when and why firms with high centrality may outperform competitors (Koka & Prescott, 2008; Reinholt et al., 2011; Su et al., 2025). This inconsistency suggests that the relationship between network centrality and innovation performance is complex and may depend on other variables.
First, less centrally positioned firms, especially those with limited knowledge and resources, often rely on reciprocity and seek information from more centrally positioned firms. These firms actively share and seek information with their supply chain partners to enhance their reputation and trust, potentially elevating their own network centrality over time (Aggarwal, 2020). This engagement increases access to beneficial information and resources for innovation activities.
Second, as a focal firm gains a more central position (e.g., at a medium level of network centrality), multiple partners may request access to its knowledge and resources. This can distract the firm from its R&D activities and lead to knowledge spillover to competitors. At this stage, the firm may lack sufficient negotiating power—the “power effect” (Greve et al., 2010; Raj et al., 2022)—to strategically engage with partners providing complementary resources. The demand for its information can create congestion in resource access, reducing the efficiency of integrating and transforming both internal and external resources, which may lower innovation performance. Thus, at a medium level of network centrality, disadvantages can hinder innovation.
Finally, firms with a dominant position and strong network ties in their supply chain benefit from a broader range of information and resources (Lavie, 2006), facilitating innovation activities and enhancing R&D efficiency (Cui et al., 2018). According to resource dependence theory, centrally positioned firms enjoy more options, control advantages, and negotiating power (Cui et al., 2018; Greve et al., 2010). They also gain exposure to diverse opportunities, allowing them to tap into technological knowledge from various markets (Fan et al., 2025; Raj et al., 2022). However, the information received from less centrally positioned firms may be less timely and effective (Mariotti & Delbridge, 2012). We argue that the benefits outweigh these negative effects, leading to higher innovation rates.
Thus, firms can access the necessary information, knowledge, and resources to facilitate innovation when positioned at either low network centrality (actively engaging with network partners) or high network centrality (exercising bargaining power to focus on beneficial relationships). The risk of being caught in the middle can distract firms, resulting in lower innovation performance. Hence, we propose:
H1: The centrality of a focal firm in its supply chain network has a U-shaped relationship with its innovation performance.
Structural Holes and Innovation Performance
Knowledge and resources among partners within a group tend to be more homogeneous than those spanning structural holes (Burt, 2004; Zhang et al., 2025). Consequently, a focal firm that spans structural holes in its network gains access to diverse knowledge and ideas from varied information sources, facilitating innovation and idea generation (Burt, 1992, 2004).
When firms have a low degree of structural holes in their supply chain network, the network is considered closed (Tatarynowicz et al., 2016). In such closed networks, information is often homogeneous, and redundant knowledge diminishes the likelihood of breakthrough innovations. Additionally, firms in a closed network tend to align closely with the group’s overall behavior, leading to innovations influenced by collective needs, which can slow down individual innovation. Closed networks are characteristic of technologically stable industries (Tatarynowicz et al., 2016), ultimately diminishing firms’ innovation performance. Therefore, when the degree of structural holes is low, an increase in structural holes can lead to more homogeneous information and redundant knowledge, further reducing innovation.
In closed networks where members are interconnected, information about a firm’s opportunistic behavior spreads rapidly, prompting firms to avoid such behavior due to the risk of reputational damage (Walker et al., 1997; Zhang et al., 2025). In cohesive networks with fewer structural holes, opportunistic actions can lead to swift sanctions, curbing such behavior (Coleman, 1988). Closed networks also foster social norms and explicit inter-organizational knowledge-sharing routines (Dyer & Noboeka, 2000; Walker et al., 1997), maximizing the benefits of collaboration and reciprocity. As a result, higher trust, reduced opportunistic behavior, and the development of social norms in closed networks (i.e., low structural holes) contribute to improved innovation performance for focal firms.
In contrast, when a focal firm spans more structural holes in its network (i.e., in a more open network), it faces a higher risk of opportunistic behavior. Without established norms, knowledge sharing, and trust, a firm may encounter issues such as sharing poor-quality information, misappropriating information and technology, or failing to fulfill commitments (Gulati & Singh, 1998). While structural holes offer benefits, the negative impacts of potential opportunistic behavior can undermine a firm’s innovation activities, leading to a decline in performance.
However, when a focal firm spans a high degree of structural holes, it gains access to a wider range of diverse (non-redundant) information sources. Firms in bridging positions within sparsely connected networks can tap into exclusive information and resources while maintaining better control over the flow of information between partners. These advantages enable them to leverage knowledge and resources effectively for innovation. Although structural holes may weaken communication and coordination among network partners, we argue that the benefits—derived from (1) access to broader information sources and resources and (2) the power to control information flow—outweigh the drawbacks, resulting in higher innovation performance.
Based on this reasoning, we propose:
H2: In the supply chain network, there is a U-shaped relationship between the degree of structural holes occupied by firms and their innovation performance.
Contingent Effect of Supply Chain Stability
According to Kumar and Zaheer (2019), “network stability” refers to the consistency of a firm’s ego network composition over time. This concept contrasts with “network churn,” discussed by Burt and Merluzzi (2016) and Sasovova et al. (2010), which describes the rate of change in network connections. Practically, network stability is measured by examining how many of a firm’s relationships with other organizations persist or change over time. A stable network indicates that the firm maintains a relatively constant set of connections, facilitating trust, collaboration, and resource sharing, thereby enhancing overall performance and innovation capabilities. In contrast, high network churn can disrupt these relationships, leading to instability and uncertainty.
The mobility of supply chain network members significantly impacts the dynamic evolution of organizational networks in real business operations. Research suggests that this mobility inhibits firms’ innovation performance (Cao et al., 2019; Kumar & Zaheer, 2019). From the perspective of resource dependence theory, this study explores how supply chain network stability affects the relationship between supply chain network embeddedness and innovation performance.
We argue that highly stable supply chain networks can weaken the U-shaped relationship between firms’ network centrality and innovation performance for two main reasons. First, a stable network allows members to develop trust and shared beliefs over time, enhancing the efficiency of knowledge and resource sharing (Reagans & McEvily, 2003; Tu et al., 2025). This stability enables firms to better obtain and absorb reliable external information, mitigating the negative impact of network centrality on innovation performance due to spillover risks and reduced power to selectively engage with strategic partners.
Second, when network centrality reaches a certain point (i.e., the turning point in the U-shaped relationship), firms have more diverse options for seeking information and resources. However, the stability of network members means that a focal firm interacts with the same set of partners, limiting the diversity of knowledge and non-redundant information it can acquire to facilitate innovation. Consequently, stable partners create stronger cohesion between a focal firm and its network partners, fostering path dependency and cooperation inertia, which can result in missed opportunities for breakthrough innovation.
Based on these arguments, we propose:
H3a: Stability in supply chain network weakens the U-shaped relationship between the level of network centrality and the firms’ innovation performance.
In a closed network, stability further diminishes knowledge diversity, reinforcing the negative relationship between firms’ structural holes and innovation performance. Prolonged stability can foster path dependency, where partners become entrenched in existing routines, technologies, or market strategies. This leads to risk aversion, as partners hesitate to deviate from established paths, ultimately stifling experimentation and innovation.
In contrast, an open network with structural holes creates opportunities for opportunistic behavior among network members. Opportunism occurs when actors exploit asymmetries in information, power, or resources for personal gain, potentially harming others within the network. The negative impact of structural holes on innovation is linked to this opportunistic behavior. However, trust and long-term collaboration fostered by stable supply chain networks enable firms to better monitor and mitigate these risks. Additionally, network stability enhances the efficiency of knowledge transfer through trust, shared routines, and beliefs.
Stability in the supply chain network also amplifies the benefits a focal firm gains from accessing diverse information sources via its span across structural holes, while minimizing the risks of opportunistic behavior and information theft. As the supply chain network stabilizes, a focal firm develops trust and strong ties with network members, allowing it to strategically engage with partners who possess high-quality and complementary information and resources. This strengthens the relationship between structural holes and innovation performance.
H3b: Stability in supply chain network reinforces the U-shaped relationship between the extent to which firms occupy structural holes and their innovation performance.
Based on this analysis and synthesis of the hypotheses, Figure 1 illustrates the theoretical framework of this article.

Theoretical framework.
Methods
Sample and Data Sources
On December 9, 2016, the China Securities Regulatory Commission issued the “Guidelines on Content and Format of Information Disclosure by Companies Issuing Public Securities No. 2—Content and Format of Annual Reports (Revised 2016),” encouraging listed companies to disclose their top five major suppliers and customers along with related transaction amounts. Consequently, the data for our study begins from 2019.
This study focuses on manufacturing companies in China’s A-share market from 2019 to 2021. We manually collected information on the top five suppliers and customers disclosed in the annual reports of each listed company, using the CSMAR supply chain research database. Companies whose primary suppliers or customers are foreign were excluded, and subsidiary names were replaced with those of their parent companies. This process identified 692 listed firms in China, each with at least 2 direct connections.
We compiled the relationships between the names of listed focal companies and their major suppliers and customers over the 3 years using Excel. The CreatePajek software transformed this relationship list into a social network matrix, which was then analyzed in Pajek to determine network centrality and structural hole indicators for each company in the supply chain network. This study collects information on the top five suppliers and customers voluntarily disclosed by Chinese A-share market manufacturing companies from 2019 to 2021, constructing the ego-network of the supply chain for those years, resulting in a total of 2,328 valid observation samples. Basic enterprise information, financial data, and patent data were sourced from WIND and CSMAR.
We employ Ordinary Least Squares (OLS) regression analysis to examine the relationship between ego-network embeddedness and innovation performance, with the stability of the supply chain network serving as a moderating variable. OLS regression allows for the inclusion of interaction terms, which is essential for testing moderation effects. We are particularly interested in how the stability of the supply chain network moderates the relationship between ego-network embeddedness and innovation performance. By including an interaction term between stability and the squared term of ego-network embeddedness in the regression model, we can estimate the conditional effect of ego-network embeddedness on innovation performance at different levels of supply chain stability.
Model Estimation and Variables
To test the hypothesis of the relationship between the focal firm’s supply chain network embeddedness and its innovation performance, the following regression model is constructed.

Where:
Dependent Variable
Most existing studies on innovation performance measure it using metrics such as the number of new products, new processes, and Likert scales (Bell, 2005; Qian et al., 2010). The number of patent applications filed in a year serves as a strong, objective measure that is difficult to manipulate. Following the method of Cornaggia et al. (2015), this study uses the natural logarithm of the number of a firm’s patent applications filed in the current year, plus one, to gauge its innovation output (InPat). Additionally, we utilize data on patent grants from the previous year for robustness testing.
Independent Variables
In this article, we measure network embeddedness properties using network centrality and structural holes.
Network Centrality
For network centrality, Freeman (1978) emphasizes the importance of context in selecting specific centrality metrics. Betweenness centrality reflects how much a node (the focal firm) lies on paths between other nodes, thus controlling the flow of information, knowledge, and resources within the network. This characteristic aligns with our research objective, focusing on the impact of information and resource transfer through the supply chain ego-network on the innovation performance of the focal firm.
Structural Holes
For measuring structural holes, we employ the network constraint metric proposed by Burt (2000), specifically using the natural logarithm of the difference between 1 and the constraint value, following Shi et al. (2019). This choice is grounded in structural hole theory, which posits that structural holes—gaps between non-redundant contacts—create opportunities for information brokerage and resource acquisition, enhancing an actor’s competitive advantage (Burt, 1992).
Moderating Variables
Network Stability
Supply chain network stability is embedded in the configuration of the supply chain structure. However, studies on social network properties often overlook dynamic changes in network members. This study references Kumar and Zaheer (2019) and Sytch and Tatarynowicz (2014) for measures of network stability and member mobility.
Operationalization of Supply Chain Network Stability
To assess the supply chain network stability of listed companies from 2019 to 2020, we follow a series of steps aimed at quantifying changes in the composition of suppliers and customers during this period. This reflection of network stability is operationalized through the following procedures performed in Excel.
Data Preparation
Column A lists the stock codes of listed companies.
Column B contains the names of the top five suppliers and top five customers in 2019.
Column C contains the names of the top five suppliers and top five customers in 2020.
Counting Supplier and Customer Appearances
For each supplier and customer name in Column B, we use the COUNTIF function to tally occurrences within the combined range of the 2019 and 2020 supplier and customer lists (Columns B and C). For example, for the company with stock code 000004 (rows 2–11), the formula = COUNTIF ($B2:$C11, B2) in D2 counts occurrences of one of its suppliers or customers over the 2-year period. This methodology is applied to count occurrences of other suppliers or customers for this listed company, adjusting the range accordingly (e.g., COUNTIF [$B12:$C21, B12] for stock code 000005 in D12).
Identifying Ties added and Ties Lost
A supplier or customer name that appears only once (i.e., a count of 1 in Column D) indicates either a newly acquired supplier or customer during 2019 to 2020 or a lost supplier or customer who was present in one of the years but not both.
By aggregating these counts, we obtain the numerator for the stability formula: the total number of ties added and ties lost.
Calculating Total Ties
Each listed company has a total of 10 unique ties during the 2019 to 2020 period, as they only disclose their top five suppliers and top five customers.
Applying the Stability Formula
We calculate the rate of change in the focal firm’s supply chain network by summing the number of new ties added and the number of old ties lost between years t1 and t2 as the numerator. The denominator is the total number of unique ties the focal firm had in the supply chain network during that period:

Where:
For example, as shown in Figure 2, if the supply chain network centrality and structural holes of firm F remain the same from 2019 to 2020, but the members change from A, B, C, D, and E to A, B, G, H, and I, its supply chain network stability has changed. The stability of firm F’s supply chain network from 2019 to 2020 is calculated as: 1 − (6/10) = .4.

Supply chain network member change.
Control Variables
Firm size
Larger firms often benefit from economies of scale, enhancing their innovation capabilities (Kumar & Zaheer, 2019). To account for this, we control for firm size using the natural logarithm of total assets, which normalizes the data and mitigates the impact of extreme values.
Firm Listing Age
The age of a firm since its listing can indicate accumulated knowledge and experience, critical for innovation (Gittelman & Kogut, 2003). Older firms may have more established processes and resources to support innovative activities, so we include listing age as a control variable.
Asset-Liability Ratio (Leverage Ratio)
Financial leverage, measured as the ratio of total liabilities to total assets, can influence a firm’s risk-taking behavior and investment in innovation. Wang et al. (2024) found that firms with higher leverage ratios often exhibit improved innovation performance, possibly due to pressure to generate higher returns. Thus, we control for the asset-liability ratio to capture its impact on innovation.
Return on Assets (ROA)
ROA, defined as the ratio of net profit to total assets, is a key indicator of financial performance and efficiency. Beckman et al. (2004) suggest that firms with higher ROA are more attractive as alliance partners, facilitating access to external knowledge and resources for innovation. Therefore, we include ROA as a control variable.
Fixed Assets Ratio
The proportion of fixed assets to total assets reflects a firm’s investment in long-term assets. A higher fixed assets ratio may indicate fewer financial resources available for innovation (Moretti & Biancardi, 2020). To account for this potential constraint, we control for the fixed assets ratio.
Inflation Rate
External economic factors, such as macroeconomic stability, can affect innovation performance (Adner & Feiler, 2019). Inflation is a key indicator of macroeconomic stability. By controlling for inflation, we ensure that variations in innovation performance are not due to macroeconomic instability.
Industry Classification
Different industries exhibit varying levels of innovation intensity and competitive dynamics, influencing a firm’s innovation performance (Smith, 2014). To control for industry-specific effects, we include industry dummy variables in our analysis.
Herfindahl-Hirschman Index (HHI)
The level of competition within a market significantly influences a firm’s innovation activities (Turner et al., 2010). Highly concentrated markets may demonstrate different innovation dynamics compared to more competitive ones. Given that the HHI is a widely recognized measure of market concentration, we employ it to address confounding factors related to market conditions.
By including these control variables, we aim to isolate the effects of our main variables of interest on innovation performance, ensuring that our results are not confounded by these other factors.
The symbols and measurements for each variable are shown in Table 1.
Variables, Symbols, and Measurements.

Baseline Network Knowledge Spillover Spatial Autocorrelation Pre-Test
This study employs the analysis of Ahuja et al. (2009) to construct a supply chain baseline network and conduct a pre-test on knowledge spillover effects related to supply chain network distance. Our goal is to determine whether a firm’s location within the supply chain network is associated with its innovation performance.
The construction of the baseline network leverages the theory of spatial autocorrelation to examine whether innovation performance among firms in the supply chain exhibits spatial autocorrelation. Specifically, we investigate the knowledge spillover effect, positing that firms closer together in the supply chain network benefit more from knowledge spillovers, thereby enhancing their innovation performance.
“Knowledge spillover” refers to the process by which knowledge diffuses between spatial units, such as firms within the supply chain network. When knowledge spillover occurs, neighboring firms are more likely to be influenced by each other’s innovative activities due to factors like geographical proximity and information dissemination, leading to spatial interdependence. This interdependence is a manifestation of spatial autocorrelation.
The purpose of analyzing baseline network knowledge spillover and spatial autocorrelation is to achieve methodological triangulation.
Supply Chain Baseline Network Construction Methods and Data Sources
Baseline Network Construction
The minimum sample size required for spatial autocorrelation analysis is 30. Therefore, we randomly selected 51 samples from the original dataset to ensure adequate representation. Following Ahuja et al. (2009), this study randomly selects 51 firms from the dataset for the years 2019 to 2021 and includes their corresponding suppliers and customers to construct the baseline network.
The network path distance reflects the positional relationships between firms within the supply chain network. We adopt the social network distance weight matrix constructed by Li et al. (2015a), based on the first law of geography: everything is connected, and closer individuals are more strongly connected than those farther apart (Cooper & Chiaradia, 2020; Tobler, 1970). In the supply chain network, firms with shorter paths have greater mutual influence and a more pronounced knowledge spillover effect.
The network path distance spatial weight matrix is constructed by measuring the shortest distance (sum of geodesic distances) between network nodes, using geographic and economic distance as reference points. This method is widely accepted as a standard metric for assessing distances between nodes in a network. The shortest path distance effectively captures both direct and indirect connections between firms, providing a comprehensive understanding of their spatial relationships within the network.

Where:
d is the shortest distance between firms i and j in the supply chain network.
We selected this method due to its robustness and widespread use in network analysis, ensuring our results are reliable and comparable to existing literature (Burt, 2002).
Innovation Indicators
The number of patent applications filed in a year is a strong, objective measure of innovation performance that is difficult to manipulate. Many scholars globally use this metric to evaluate a company’s innovation capabilities. Following the approach of Cornaggia et al. (2015), this study adopts the natural logarithm of the number of patent applications filed in the current year to calculate the firm’s innovation performance index.
Spatial Autocorrelation Analysis of Supply Chain Network Innovation Performance
The Moran’s I test is a widely used statistical method for measuring spatial autocorrelation. Specifically, global Moran’s I assesses spatial autocorrelation across the entire study area, while local Moran’s I reveals spatial autocorrelation within specific local areas.
In this article, we use global Moran’s I to measure the overall spatial autocorrelation of 51 firms over the 3-year period from 2019 to 2021. Additionally, we apply local Moran’s I to evaluate spatial autocorrelation for these firms in each individual year within the same timeframe.
Moran’s I test is conducted using the standardized network path distance weight matrix. Table 2 displays the results of the global Moran index test, indicating that all Moran indexes are positive and pass the 5% significance test. This suggests positive spatial autocorrelation of knowledge spillover among firms in the supply chain network, indicating that firms with similar innovation capabilities are located near each other, highlighting the importance of network positioning for innovation performance.
Global Moran Index of Baseline Network from 2019 to 2021.
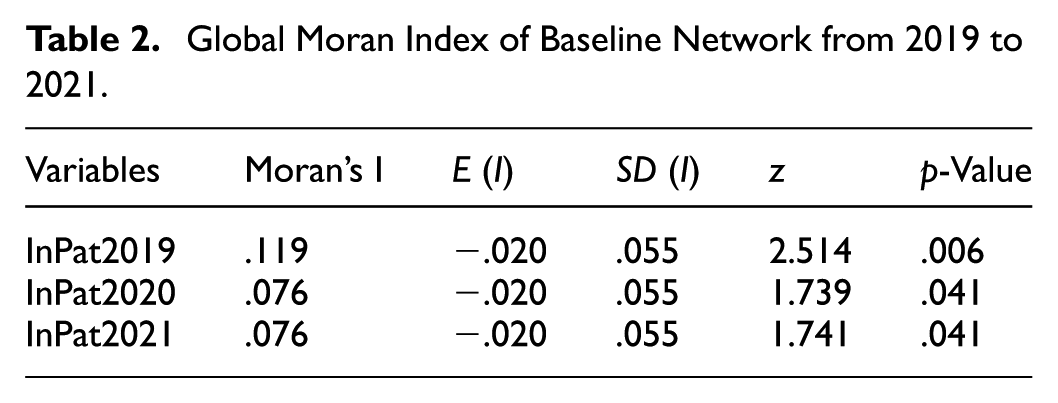
The analysis reveals spatial aggregation characteristics of high-high and low-low clusters, reflecting a pronounced “Matthew effect,” where “the rich get richer and the poor get poorer.” In the context of the supply chain network, high-high clusters consist of firms with strong knowledge and innovation capabilities that tend to connect closely with similarly advantaged firms. Conversely, low-low clusters comprise firms with lower capabilities that are likely to interact with other disadvantaged firms.
The global Moran index test results confirm that firms with comparable technological innovation capabilities exhibit strong spatial dependence on each other, supporting the correlation between a firm’s position in the supply chain network and its innovation performance. From the perspective of spatial autocorrelation, this study provides an empirical foundation for analyzing the impact of corporate supply chain network embeddedness on innovation performance.
To address the limitations of the global Moran index test, we also adopt the local Moran index and Moran index scatter plot tests (see Figure 3a–c). As shown in Figure 3, the local Moran index for 2019 to 2021 passed the 5% significance level test; however, the scatter plots were not linearly clustered in quadrants one and three.

Local scatter chart of innovation performance of firms’ supply chain network from 2019 to 2021. (a) 2019 Local Moran Index; (b) 2020 Local Moran Index; and (c) 2021 Local Moran Index.
The primary hypotheses of this paper explore the relationship between a firm’s position within the supply chain network and its innovation performance. The spatial autocorrelation analysis serves as a preliminary test to support these hypotheses, revealing a positive correlation between the spatial proximity of firms within the network and their innovation performance. This finding suggests that firms located closer together in the network exhibit similar levels of innovation performance, providing a foundational basis for further examination of how a firm’s embeddedness in the supply chain network influences its innovation performance.
Given the limited baseline network data, these results offer preliminary evidence to validate the non-linear relationship between supply chain network embeddedness and innovation performance for a larger sample.
Results
Descriptive Statistics
This study utilizes firms listed on the Shanghai and Shenzhen A-shares that disclose their top five suppliers and customers as the initial sample, constructing a supply chain network among these entities and the focal firm. Based on 2,328 relationships among China-listed manufacturing firms, we created a comprehensive ego-network of supply chains and empirically tested these relationships. Table 3 presents the descriptive statistics for each variable across the 2,328 observations in the sample.
Descriptive Statistics.

In our analysis, the variance inflation factors (VIF) for all variables were below 2, indicating a minimal issue with multicollinearity. To reduce potential research error, all variables in the interaction terms were centered.
Test of the Hypotheses
We first examine the relationship between supply chain network embeddedness and the innovation performance of the central firm. Subsequently, we assess the moderating effect of supply chain network stability on this relationship.
Table 4 shows the results of the regression analysis using fixed-effects panel models. Model 1 includes betweenness centrality (InNC), the squared term of betweenness centrality (InNC2), and control variables. The results indicate a significantly positive coefficient for the primary term of intermediate centrality (β = .300, p < .01) and for the squared term (β = .016, p < .01). This suggests a U-shaped non-linear relationship between supply chain network centrality and innovation performance, supporting Hypothesis 1.
Network Centrality, Structural Holes, Supply Chain Stability, and Innovation Performance.

Note. N = 2,328. Note: two-tailed tests for all variables.
p < .10. **p < .05. ***p < .01.
In Model 2, the coefficient for the first term of the structural hole constraint value (InSH) is significantly positive (β = 14.761, p < .01), and the coefficient for the squared term (InSH2) is also positive and significant (β = 82.066, p < .01). This indicates a U-shaped relationship between a firm’s occupation of structural holes in the supply chain network and innovation performance, supporting Hypothesis 2.
Model 3 shows that the coefficient of the interaction term between supply chain network stability and the squared term of centrality is significantly positive (β = .050, p < .01), indicating that supply chain network stability weakens the U-shaped relationship between centrality and innovation performance. Thus, Hypothesis 3a is supported.
In Model 4, the coefficient of the interaction term between supply chain network stability and the squared term of the structural hole constraint value is significantly negative (β = −127.746, p < .01), indicating that supply chain network stability strengthens the U-shaped relationship between structural holes and innovation performance, supporting Hypothesis 3b.
Robustness Tests
To confirm the validity of the conclusions, we conducted several robustness tests:
Alternative Measure
We employed an alternative measure for the dependent variable to robustly test our findings. Given that patent applications in China are typically granted within 1 to 3 years, we used data on the number of patents granted with a one-year lag to replace the current year’s patent applications. The regression results in Table 5 indicate that these alternative measures align closely with our original conclusions.
Regression Results of Alternate Measures.
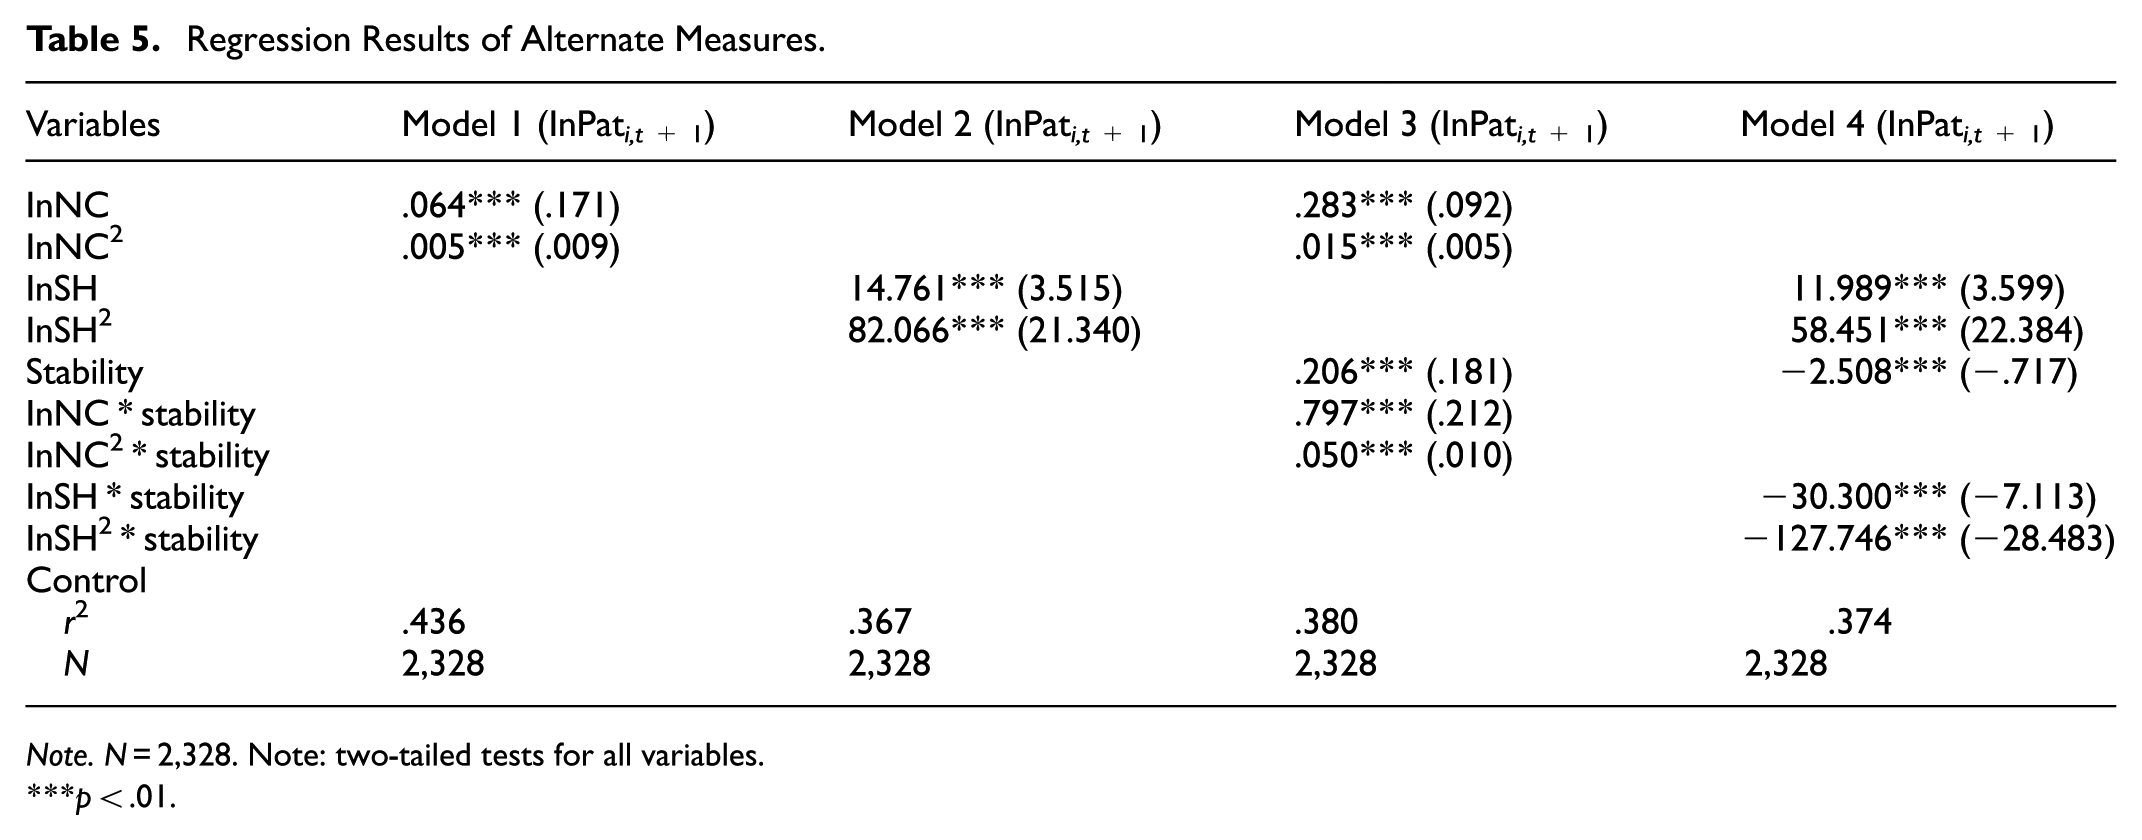
Note. N = 2,328. Note: two-tailed tests for all variables.
p < .01.
Reverse Causality Check
Since a firm’s level of innovation performance can influence its industry status and affect other firms’ decisions to engage in supply relationships, we considered potential reverse causality between explanatory and response variables. To address this endogeneity, we modified the original model using two-stage least squares regression (2SLS). The results from the second-stage regression supported our previous conclusions, confirming the robustness of our findings.
Sensitivity Analysis
To further confirm the stability of our findings, we conducted additional sensitivity analyses using the bootstrap method (Simar & Wilson, 1998). By resampling the data with replacement and estimating the model multiple times, the bootstrap results reaffirmed the robustness of the original findings, as the estimated coefficients remained stable across different samples.
Discussion and Conclusion
Main Findings
Our findings reveal a nuanced U-shaped relationship between network centrality and innovation performance. This suggests that while increased centrality can initially enhance access to diverse information, it may also lead to conflicts that hinder innovation. Firms must therefore carefully manage their network positions to balance control and collaboration effectively.
Similarly, the identified U-shaped relationship between occupying structural holes and innovation performance underscores the importance of bridging diverse knowledge sources. This highlights that firms in open networks can leverage non-redundant information to foster innovation, encouraging further exploration of network structures in innovation contexts.
Moreover, our results indicate that stability can weaken the benefits of centrality while enhancing the advantages of occupying structural holes. This insight is critical for practitioners, suggesting that fostering a stable network environment can promote trust and collaboration, particularly for firms with low centrality. Future research should explore how stability can be strategically managed to optimize innovation outcomes.
Additionally, our study implies that absorptive capacity is a key channel through which network embeddedness influences innovation performance. This emphasizes the need for firms to develop their absorptive capacity to fully leverage their network positions. Future research should empirically examine the mediating mechanisms and explore strategies for enhancing absorptive capacity across various contexts.
Implications for Practice
This study offers several practical implications for managers and policymakers.
For managers, firms should prioritize partnerships with key suppliers and customers. This focused approach simplifies collaboration and enhances resource efficiency, fostering deeper relationships that drive incremental innovation. Managers must strategically select partners that align with their innovation objectives; collaborating with firms that offer complementary resources enhances knowledge exchange and minimizes potential conflicts, thereby improving overall innovation performance. Additionally, firms should proactively evaluate and sever less productive links within their supply chains. This practice reduces the centrality of structural holes, alleviating constraints from existing resource demands. Streamlining networks enables better integration and transformation of knowledge and resources, creating a more dynamic environment for innovation.
For policymakers, they should guide listed manufacturers to vertically integrate with SMEs in specialized sectors through equity stakes or direct financing, thereby enhancing supply chain stability. Structural holes occupied by listed firms with SMEs can boost network openness, providing high-quality, non-redundant information and strengthening the positive impact of structural hole occupancy on innovation performance. Additionally, policymakers should promote a collaborative tech innovation environment by encouraging supply chain firms to form R&D consortia for joint innovation. High involvement builds stakeholder communities, facilitating information sharing. An efficient supply-chain-based network ensures resource flow, enhances absorptive capacity, and sustains innovation.
Limitations and Future Research
This study has several limitations that provide valuable insights for future research. First, the supply chain network analyzed is based solely on the top five suppliers and major customers disclosed in the annual reports of listed manufacturing companies in China. This introduces potential selection bias, as many supply chain members—particularly smaller or unlisted firms—are excluded. Additionally, many listed companies do not disclose their top partners, further limiting the network’s completeness. Future research could utilize web scraping technologies to extract data from alternative sources, such as bidding announcements, contract awards, and news reports on inter-firm collaborations, thereby constructing a more comprehensive and representative supply chain network dataset.
Second, while this study incorporates the theoretical concepts of “reciprocity” and “power” to frame its hypotheses, these mechanisms were not directly tested. This omission leaves open questions about how these dynamics influence the relationship between supply chain network embeddedness and innovation performance. Future research should explicitly operationalize these constructs using established theoretical frameworks and measurable variables. For example, reciprocity could be assessed through transaction frequency or mutual dependencies, while power might be quantified via resource dependence or bargaining asymmetry. Additionally, exploring alternative mechanisms—such as knowledge spillover, trust-building, or collaborative innovation—could deepen our understanding of how network embeddedness drives firm-level outcomes.
Third, this study focuses on the moderating role of supply chain network stability in the relationship between ego-network embeddedness (centrality and structural holes) and innovation performance. While this provides valuable insights, it overlooks other critical contextual factors that may influence this relationship. For instance:
Company size: Larger firms, with abundant resources and established networks, may leverage central positions or structural holes more effectively than smaller firms. Conversely, smaller firms might exploit their embeddedness through agility or niche strategies. Future research should examine whether the effects of embeddedness vary systematically by firm size and explore the underlying mechanisms. Industry type: Technological readiness, competition intensity, and regulatory environments differ across industries, potentially influencing how embeddedness impacts innovation. For example, high-tech industries may benefit more from spanning structural holes due to rapid technological change, while traditional industries might rely on centrality for knowledge dissemination. Cross-industry comparisons could reveal nuanced patterns and inform industry-specific strategies. Geographical context: Regional factors such as cultural norms, economic policies, and infrastructure quality may shape supply chain dynamics and innovation processes. Firms in regions with strong innovation ecosystems or supportive government policies might gain additional advantages from their network positions. Future studies could investigate cross-national or cross-regional variations to assess how geographical contexts moderate the embeddedness-innovation relationship. Other moderators: Additional firm-level factors—such as R&D intensity, technological orientation, and market demands—could also influence the relationship. For example, firms emphasizing product differentiation might amplify the effects of network embeddedness on innovation. Future research should incorporate these moderators into a more comprehensive framework.
Fourth, the study measures network stability based on the rate of change in a firm’s supply chain network members over time, following the approach suggested by Kumar and Zaheer (2019) and Sytch and Tatarynowicz (2014). While this method effectively captures the consistency of network configurations, it has limitations regarding data completeness. The analysis relies on publicly disclosed information from annual reports of listed manufacturing firms in China, which may not fully represent the actual network stability due to the exclusion of unlisted companies and undisclosed top suppliers or customers.
Fifth, endogeneity may arise if unobserved factors (e.g., managerial capability or firm reputation) simultaneously drive both network stability and innovation performance. This is particularly true for potential reverse causality, where highly innovative firms may attract stable partners, inflating the observed stability-performance link. To mitigate these concerns, the study employed robustness checks, including lagging innovation metrics (using patent grants at t + 1) to reduce simultaneity bias and conducting 2SLS regression with instrumental variables (e.g., industry-average stability) to address potential reverse causality, though instrument exogeneity remains imperfect.
The study acknowledges these limitations and proposes that future research could address endogeneity by employing panel data with fixed effects or instrumental variables (e.g., industry-level supply chain stability) to better isolate reverse causality. Additionally, expanding data collection to incorporate web-crawled information on unlisted firms and non-top partners would enable a more comprehensive capture of supply chain relationships. While this study prioritized supply chain network stability for focused analysis, future studies should integrate these additional moderators to build a richer theoretical understanding of ego-network embeddedness and innovation performance, thereby advancing academic knowledge and offering practical guidance for firms operating in complex and dynamic supply chain environments.
Footnotes
Acknowledgements
We would like to express our sincere gratitude to the anonymous reviewers for their invaluable feedback and constructive comments, which have significantly improved the quality of this article. We also extend our appreciation to the editorial team at Sage Open for their support and guidance throughout the review process. We are grateful to WIND and CSMAR for providing access to the data used in this study.
Ethical Considerations
Ethical considerations specific to this study were deemed irrelevant as it utilized publicly available secondary data for analysis. The data were sourced from reputable, open-access repositories, which eliminated the need for direct interaction with research participants and, thus, the necessity for informed consent procedures associated with primary data collection. The datasets were anonymized and de-identified by the original data custodians, ensuring the protection of participants’ privacy and confidentiality. Throughout the research process, no attempts were made to re-identify individuals or compromise their anonymity.
Author Contributions
This manuscript has greatly benefited from the collaborative efforts of my co-author. Liming Zhao made significant revisions to the Introduction and Literature Review sections, enhancing the clarity and comprehensiveness of our theoretical foundation. In addition to these pivotal contributions, she actively engaged in the iterative revision process in response to every round of reviewer feedback, ensuring that our responses were thorough, well—articulated. Her meticulous attention to detail was also evident in her comprehensive language editing of the entire manuscript. She refined the language throughout to guarantee better readability, streamlining complex ideas and ensuring that the prose flowed smoothly, making the paper more accessible to a broad academic audience. Her expertise and dedication have been instrumental in the successful completion of this research.
Funding
The authors received no financial support for the research, authorship, and/or publication of this article.
Declaration of Conflicting Interests
The authors declared no potential conflicts of interest with respect to the research, authorship, and/or publication of this article.
Data Availability Statement
The data that support the findings of this study are sourced from the WIND and CSMAR databases. These databases are subscription-based.