
Abstract
This study aims to construct a theoretical framework to analyze the elements of the network structure and the relationship system within the seafood supply chain. The scope of the investigation is to evaluate how these elements influence the flow of products and the efficiency of the seafood supply chain and why these social interactions can create value and enhance competitive advantage. The model combines the resource- and knowledge-based view and the social network analysis applied to seafood supply chains. To demonstrate the application of the model, two theoretical examples and a real case study of the Mercado del Mar in Guadalajara, Mexico, are used. Primary data are obtained from semi-structured interviews, social network analysis metrics, and qualitative analysis. Findings are based on the analysis of theoretical examples and must be considered with caution. Nevertheless, the observations in the examples and case study provide new arguments to the relationship between the pattern of interrelationship and the efficiency of a supply chain. This study emphasizes the necessity of combining quantitative and qualitative analyses to understand and explain real-life supply networks.
Introduction
Seafood trade has been described as a complex and dynamic activity due to the variety of products, processes, and actors that intervene on it (Anderson, 2003). Nowadays, fish can be produced in one country, processed in a second, and consumed in a third. Moreover, fish and fish products are one of the most traded food commodities in the world, increasing fish trade and exports; more than half of the fish exports by value comes from developing nations (Food and Agriculture Organization of the United Nations [FAO], 2016). One of the reasons is the increasing demand for seafood in developed and transitional economies (Clover, 2006). However, in the last decade, many fish resources have been added to the list of those that are exploited to their maximum potential or overexploited (FAO, 2007). Thus, the increment of demand to 20 kg per person in 2014 and seafood depletion has made more difficult to supply growing and new markets; therefore, they are currently being supplied by the substitution of species and the massive growth of aquaculture products (Clover, 2006). These create network structures supported by multiple relationships organizing the production and delivery of fish.
Seafood supply chains are now compounded by complex social networks. These complex social networks are integrating small-scale fisheries to different markets; through these social structures, fish flows from local producers to national and international markets (Crona et al., 2016). The timely distribution of seafood can therefore depend on the network organizational setting (topology), and this structure might affect or facilitate the flow of goods which is a key element in perishable goods such as fish.
Currently, the literature on fisheries economics has not explained why social interactions affect fish market organization and behavior, why the decisions made to develop or strengthen relationships between suppliers and buyers are important, and why the social context can modify the network structure and economic behavior (Granovetter, 1985; Jackson, 2010). The way these social interactions build competitive advantage and create value for network partners, how and why social relations become a resource, and simultaneously represent a capability to acquire resources, has little development in the analysis of fish markets.
In this study, fish trade behavior is analyzed with a theoretical framework which integrates knowledge and information exchanged in trade relations. This can create insights to better understand the seafood supply chain. The resource-based view (RBV), integrating knowledge into the firm strategy, from the strategic management discipline and the social network analysis (SNA) perspective can contribute to building a theoretical framework to better understand and explain current fish trade dynamics because they consider the elements and actions that intervene to construct this behavior.
Therefore, this work combines both perspectives (RBV and SNA) to construct a theoretical framework to analyze how the network structure and relationship system can have an impact on the flow of products from fishers to markets along the seafood supply chain. In other words, how trading interactions develop a network structure, what type of socioeconomic elements are involved in different network topologies, and why the social interactions are capable of creating value and enhance competitive advantage.
To achieve this objective, this article is structured as follows: First, a review of the RBV and SNA perspectives and their applications to the management of seafood supply chain is presented. Subsequently, section “Methodological Approach” presents the theoretical model which shows how both perspectives can be integrated and applied, illustrated with two hypothetical examples. Section “The Model, Examples, and Case Study” presents a real case study. The last two sections are devoted to the discussion of findings and conclusions.
A Theoretical Perspective
A supply chain is an interrelated network of suppliers and customers (Zelbst et al., 2009) where the flow of materials and information is coordinated throughout the chain (Stevens, 1990). This can occur through linking implicit connections that the firm creates with suppliers and customers. These connections have been recognized in management literature as an important element for the operational performance of the supply chain (Rungtusanatham et al., 2003; Zelbst et al., 2009).
Traditional economic models assume homogeneity among agents, all actors are interconnected among themselves, and its access to information is uniform, ignoring that real social networks do not present a uniform topology among trade partners. In particular, fish trade relies on a social network and its structure can facilitate or complicate the flow of products from fishers to markets and have an impact on income distribution.
Fish trade dynamics may be analyzed under a RBV approach with knowledge being a resource for capability creation, and SNA to understand and explain the nature and strategic behavior that gives place to all activities and processes within fish flows from producers to consumers. Thus, based on the extended knowledge approach from the RBV of the firm, we may consider the managers’ choice based on their previous experience and knowledge as important resources in fish trade dynamics.
The RBV is a theoretical perspective that looks at the firm in terms of its resources rather than its products (Wernerfelt, 1984). This perspective tries to understand, explain, and predict how a firm can have different sources of competitive advantage in terms of the resources it can acquire or control, by implementing a value-crating strategy not simultaneously implemented by a competitor (Barney, 1991).
This includes intangible resources such as knowledge or information, and tangible resources such as the assets and equipment a firm possesses and controls to facilitate the production and distribution of goods and services (Grant, 1991). A resource enables competitive advantage for a firm when four characteristics are given: it is valuable and capable of enhancing strategies that improve firms’ efficiency and effectiveness, it is rare among competitors, it is imperfectly imitable, and it does not have substitutes (Barney, 1991).
Intangible resources (knowledge–information based) can be the most valuable resources to create a sustainable competitive advantage (Grant, 1996; Nieves & Haller, 2014; Nonaka, 1994). They are resources that are not already in the market, but rather must be created by the firm (Sepulveda & Gabrielsson, 2013).
Firms may achieve performance and profit not because they possess better resources, but rather because their distinctive knowledge allows them to make better use of their resources (Penrose, 1959). The RBV theory of the firm suggests integrating knowledge into the firm’s strategy because among a firm’s intangible resources, knowledge is the most important and critical for competitive advantage because it is the most difficult to imitate (Nieves & Haller, 2014; Omerzel & Gulev, 2011). Therefore, the knowledge base view (KBV) views firms as generators and integrators of knowledge, and to create and utilize, knowledge is considered to be the most important source to establish and exploit a sustainable competitive advantage (Grant, 1996; Nonaka & Takeuchi, 1995; Nonaka & Toyama, 2003; Pollitte et al., 2015).
Firms create knowledge through actions and interactions with the environment, and knowledge creation starts with “Socialization, which is the process of converting new tacit knowledge through shared experiences in day-to-day social interactions” (Nonaka & Toyama, 2003, 2005) However, the knowledge held by individuals must be passed to others for its value to be appropriated and leveraged (Cabrera & Cabrera, 2005). Knowledge acquisition occurs when a firm or an individual is able to transfer its knowledge (Buckley et al., 2009). This occurs through a process of Externalization where tacit knowledge is made explicit to be able to share it with others and tacit knowledge can only be acquired through shared direct experience (Nonaka & Toyama, 2005).
Intangible resources depend on the human capital a firm possesses because it is through individual persons that knowledge will be created, acquired or applied, and organizational processes and relations are going to be performed. Human capital is the skill and capability of individuals or the stock of knowledge within the organization (Cabrera & Cabrera, 2005; Coleman, 1988). Knowledge workers are part of the social capital and knowledge assets of the firm, whose interaction among themselves or with the environment creates the economic value of knowledge creation within the firm (Nonaka & Toyama, 2005).
A way to develop or increase human capital is through social capital. Social capital has been identified as a productive and valuable resource that enhances the competitive advantage of a firm (Tsai & Ghoshal, 1998) actually or potentially embedded within relationships (Nahapiet & Ghoshal, 1998), or available through changes in relations among persons that facilitate action (Coleman, 1988). The norms and values associated with social relationships can be the basis for trust, cooperation, and collective action (Nahapiet & Ghoshal, 1998; Putnam, 1995).
Relationships among supply chain partners give rise to exchange linkages within a supply chain network (Zelbst et al., 2009). These linkages are the connections that a firm can create to manage the flow of information, materials, and products from producers to customers (Rungtusanatham et al., 2003). From these exchange linkages, the network takes shape, and major supply chain dynamics develop because cooperation and competition take place within supply chains and not between firms (Christopher, 1998).
Networks seek to exchange resources within network partners, and this includes the relationships that give rise to these exchanges (Sepulveda & Gabrielsson, 2013). Relationships can be strategic and create value if they develop the characteristics to enhance competitive advantages, difficult to acquire, imitate or substitute (Barney, 1991) or become part of the network. Thus, network membership can be seen as a resource if it creates benefits for its members (Gulati et al., 2000) and the network resources owned by its members can be accessed by the other network partners through ties (Lavie & Miller, 2008). In other words, social networks can provide a medium where knowledge assets can be transferred between partner firms (Pollitte et al., 2015).
Fish trade occurs within social networks, and the exchanges within these forms of organization are given within links built through social relations. Therefore, the resources used to facilitate the harvesting, transformation, and distribution of fish products are social network resources. The resources obtained within social networks can be key resources (Sepulveda & Gabrielsson, 2013) because the links developed within the network can assure accessibility to fish products and markets.
Therefore, network content, or the resources obtained from the network, can be more or less strategic depending on fish production and market variability (abundance or scarcity). Unexpected high catch volumes will require forward networking; in other words, a firm will have to work in alliances with intermediaries rather than with suppliers, and in times of scarcity, networking should be backward; a firm will have to find more suppliers if its own working capital is not enough to satisfy demand. Thus, network organization implies that the strategic resources, which can be the source of competitive advantage, not only come internally, within each organization, but also from the network (Sepulveda & Gabrielsson, 2013). In other words, network partners can become a source of knowledge, or a knowledge asset, to adapt to market changes in terms of fish supply and demand variability.
Consequently, the network perspective is used to identify the structure shaping the social group trading relationships, and KBV is the framework for reasoning about the behavior that explains the structure of the network. The KBV provides the elements to explain why basic traders or other agents organize in a particular way and describes the benefits from being part of such a social structure.
Review on Seafood Supply Chains
Seafood plays an important role in regional and local food security; particularly, small-scale fisheries are highly used for self-consumption in poor coastal communities (Garcia & Rosenberg, 2010; Kittinger et al., 2015), and, in general, seafood makes important contributions to economies around the world (Alison et al., 2009). Moreover, there is an increasing consumer demand, and seafood has become one of the most heavily traded food commodities in the world (Fox et al., 2018; Shehata et al., 2019). However, 50% of seafood exports to the developed world come from developing countries (Bailey et al., 2016; FAO, 2016). Therefore, some of the major topics in seafood supply chain literature are traceability, certification, fish safety and quality to transform or shape seafood governance to improve seafood management, or the role of relations and networking in the flow of seafood products (Al-Busaidi et al., 2016; Glavee-Geo & Engelseth, 2018; Sampson et al., 2015; Vo et al., 2016). However, these measures also represent additional costs to industry.
Seafood supply chains have also been used to analyze how increasing consumer demand, price increment, seafood scarcity, and complex management have caused seafood fraud and mislabeling of these commodities (Fox et al., 2018; Gopi et al., 2019; Shehata et al., 2019). Market substitution and species misidentification might place one fish of higher value or different quality characteristics for any other fish affecting consumers’ health and budget.
Another important topic confronting the sustainability of seafood supply is climate change. The role of supply chains in effective adaptation of fisheries and aquaculture industries to climate change has been used to identify the implications of varying strategies at different stages of the supply chain (Lim-Camacho et al., 2015). Therefore, due to the complexity of seafood supply chains, agility and reputation have also been presented as major components for the distribution of seafood (Hernández & Pedroza-Gutiérrez, 2019; Pedroza-Gutiérrez & Hernández, 2017). Table 1 summarizes some of the seafood supply chains’ most important characteristics.
Review of Seafood Industry Characteristics.

Methodological Approach
This study presents a theoretical model and an empirical study. The theoretical model combines the KBV and SNA applied to seafood supply chains. It is illustrated with two simple examples. The empirical case is based on field work. Field work was carried out from 2013 until 2016.
Field Work
The first stage of the field work was carried out in the Mercado del Mar (MM), the second largest fish market in Mexico, with a daily volume of trade around 500 to 1,000 tons. It is located in Zapopan, a suburb of the city of Guadalajara, Mexico. Guadalajara is a traditional commercial center in Mexico, and most of the seafood there is traded in the MM. The product comes from the same state (Jalisco), other Mexican states, and foreign countries. The main buyers are local markets, restaurants, fish shops, and wholesalers from other marketplaces in Mexico.
We used a nonprobabilistic sample adapting chain referral techniques such as response driven (Heckathorn, 1997), targeted sampling (Watters & Biernacki, 1989), and snowball (Wasserman & Faust, 1994). In this way, each person interviewed would indicate a freshwater fish wholesaler in the MM; thus, the limit of interviewees was set by those who trade freshwater fish. This restriction was motivated for the sake of simplicity and by the fact that Mexico is one of the world’s consumers of freshwater tilapia. The interviews were addressed to the owner or the person in charge of the business. From the 44 wholesalers in the MM, we chose a sample of 10 and visited them two or three times to corroborate information.
We used formal and informal interviews, applied to the market administrator, the president, and selected business owners. Formal interviews with the business owners were based on a semi-structured schedule based on our research objectives. The objective of these interviews was to investigate the MM sellers’ and buyers’ dynamics to understand the market network organization. The informal interviews provided additional qualitative data, and a better understanding of the MM dynamics.
The second stage of the field work was to interview part of the suppliers and buyers with the intention to triangulate the information provided by wholesalers in the MM. We visited 11 of the processing plants located in three riparian communities to Lake Chapala because they process most of the local tilapia that goes to the MM. However, because it was not possible to visit all suppliers, most of the information was obtained from the wholesalers.
A similar case emerged for the interviews with buyers. We interviewed the most representative buyers from the market. According to wholesalers, the tianguis (open market) and the retail markets are the most frequent clients. In the tianguis, we interviewed eight market stalls and three in the retail market. In total, we carried out 36 interviews.
SNA
A network is a set of vertices (nodes), N= {1, 2, . . . n}, edges, and the way both elements are connected. In social networks, nodes are represented by individuals/agents or group of individuals/agents, while edges represent relations among those agents. The SNA provides quantitative methods and models to analyze social networks, starting from the individual (locational) and global (structural) characteristics (Wasserman & Faust, 1994).
A network can be graphically represented by drawing the nodes with dots and the edges with segments connecting the dots. Here, we assume two types of edges: strong ties (STs) and weak ties (WTs). We will represent STs by solid lines and WTs by dashed lines. The network can be algebraically represented by the adjacency matrix Anxn. The element aij of this matrix, with
Centrality measures. They provide information about the importance of each node with respect to the others. There are several specific centrality measures, each one according to the specific definition of node importance. This study uses node degree (ki), which is the number of connections possessed by that node,

and the rate of STs over total relationships, which is given by the following expression:
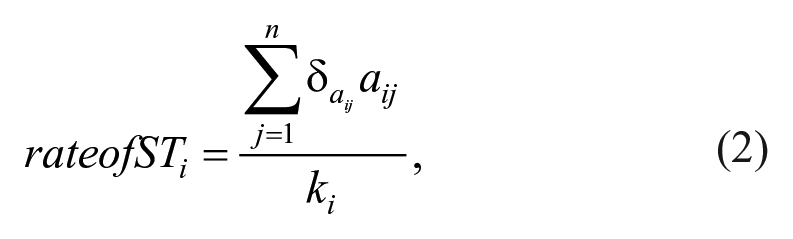
where
Degree and rate of ST distributions. The network degree distribution (p[k]) indicates the proportion of nodes that have a k degree. In other words, the degree distribution indicates the probability that an arbitrary node includes k edges. Many real networks follow power law or scale-free degree distribution,
The calculation of metrics and graph representation were done with igraph R package (Csardi & Nepusz, 2006).
The usefulness of SNA has been recently emphasized in supply chain management (Borgatti & Li, 2009). Following the network perspective, a supply chain is also termed supply network (Choi & Hong, 2002). A supply network is represented by a complex system of interdependence among multiple firms, each one with a number of links to specific partners, and follows the characteristics of a complex adaptive system (Surana et al., 2005). The network in these systems behaves coherently from the aggregation of every agent’s decisions, where everyone influences the functioning of the network but not just anybody can control the global behavior. In this context, SNA is an adequate tool to analyze the key factors influencing the global behavior of the supply network.
The Model, Examples, and Case Study
Theory and Concepts
It is considered that fish trade, where all the supply chain stages take place from the production to the distribution of goods, is organized as a social network, where the actors have developed different types of relationships, whose interactions create a social capital or part of the knowledge assets of the firm, which can contribute to the industry’s opportune response to changes in supply and demand. In this section, the framework that describes the fish trade network is presented, where three perspectives are combined: the graph theory perspective, which is used to identify the structure of the social trading relationships, showing
Table 2 shows the different attributes extracted from the three perspectives and the relationships among them. Three types of attributes are considered and classified according to the elements that compound a social network: the nodes, the edges, and the network measures. In Table 2, centrality is identified as the main network measure which is interconnected to concepts and resources from the other perspectives.
Fish Trade Network: Representation and Analysis (Column 1), Socioeconomic Indicators (Column 2), and Resources (Column 3).
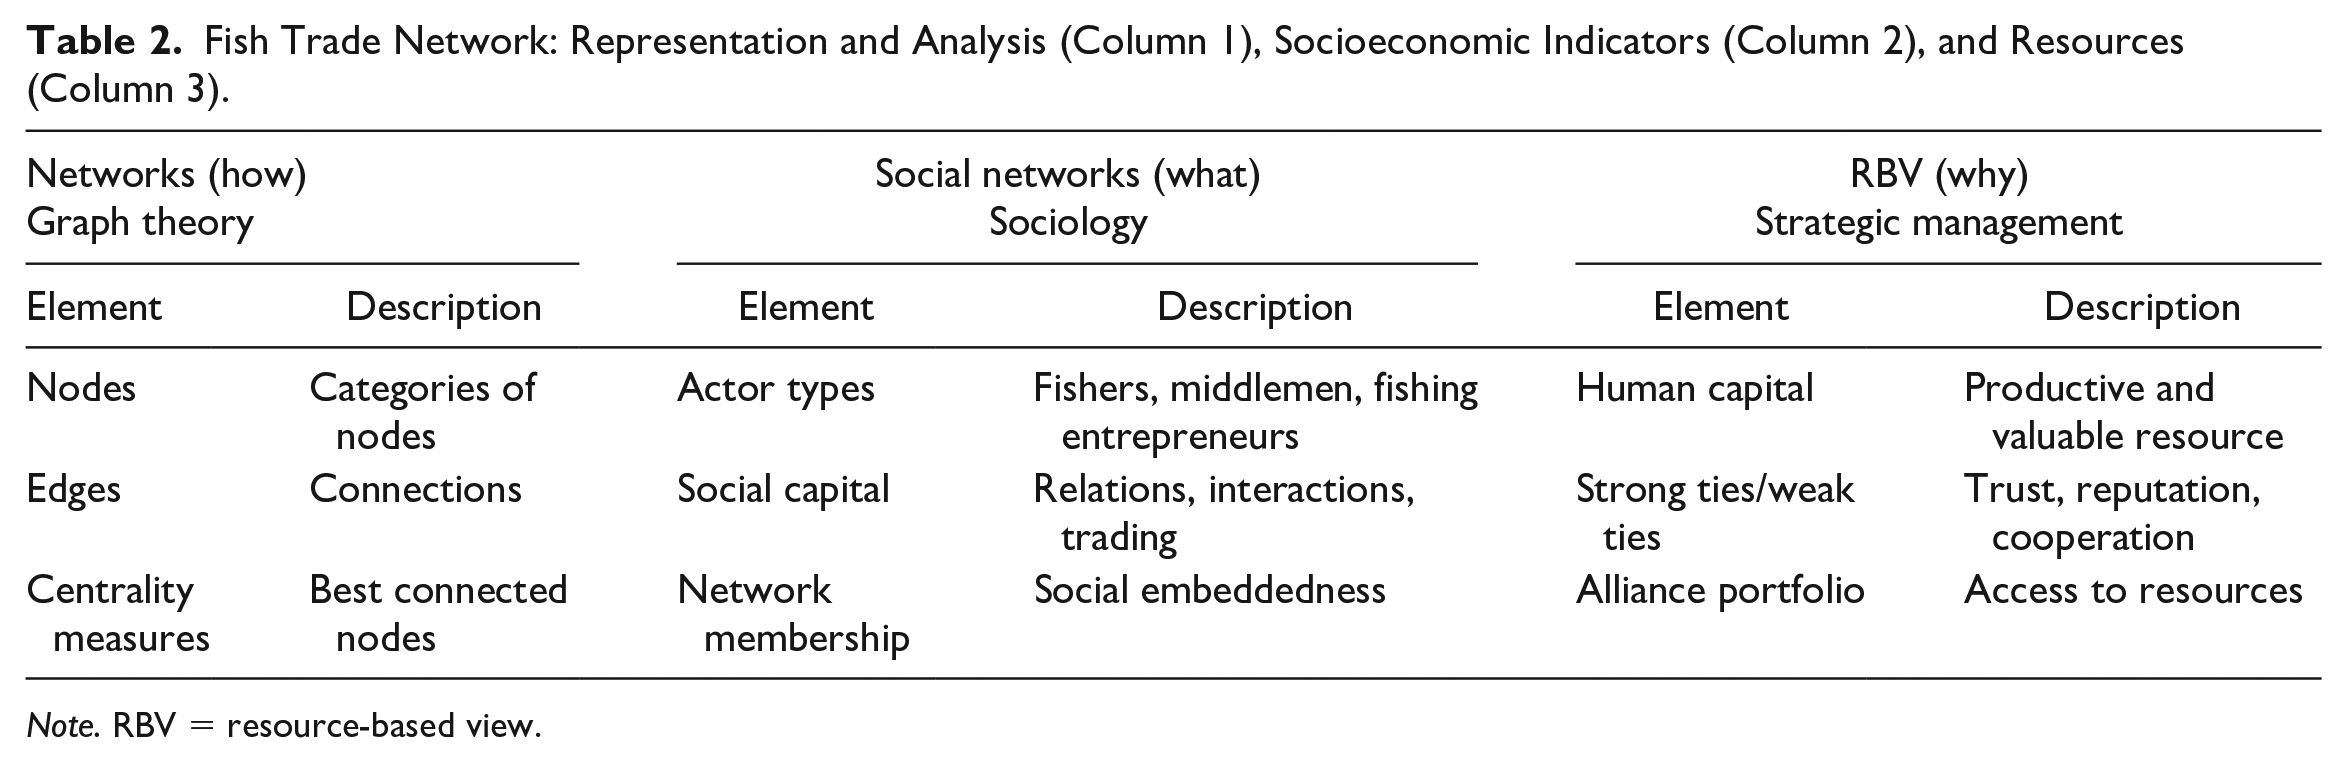
Note. RBV = resource-based view.
The first row presents the nodes, the basic components of a network. In a social network, they are the actors interrelated through social relations (Mitchell, 1973). In a fish trade network, they can include basic traders (middlemen), fishers, dealers and a combination of fishers and dealers (Ropicki & Larkin, 2014), or other agents, such as investors or quota redistributors (van Putten et al., 2011). All components of the network form the human capital, the stock of knowledge, the individuals that develop social relations, norms, and values over time (Coleman, 1990) which, once identified, provide the basis for cooperation and collective action, giving rise to social capital (Jacobs, 1965), as a productive and valuable resource (Casanueva et al., 2013) and where the economic value of knowledge takes place (Nonaka & Toyama, 2005).
The second row shows the edges, which represent the relationships among actors in fish trade, the social capital. The nature of these relationships is varied and can be divided into two types, STs and WTs, defined and measured in different ways. Granovetter (1973) defines them in terms of the frequency of interactions, with STs as those having regularity in relationships and WTs as those under a more random or casual connection. Another way is by relating the ties to their importance or level of influence on a given relationship (Coviello, 2006). Following this approach, STs are considered deep-rooted social links, given under cohesive relationships, whereas WTs are relationships without social attachment (Hite & Hesterly, 2001). STs will have a level of trust, which is missing in WTs (Gabrielsson et al., 2008). Frequency or closeness of relationships has been the most common indicator used to measure tie strength (Jack, 2005). Therefore, frequent communication under cohesive relationships within STs can also facilitate knowledge sharing (Cabrera & Cabrera, 2005).
Both types of ties are necessary for the efficient functioning of the network because different types of relationships can provide different resources (Jack, 2005). STs are essential for industry performance because they are already socially embedded, with a level of trust and reputation (Gabrielsson et al., 2008; Jack, 2005) and therefore are easy to activate. At the same time, relying only on STs can limit the industry to access new or different opportunities (Hite & Hesterly, 2001). Thus, even though the benefits obtained from STs can be seen as more trustworthy than the benefits from WTs (Granovetter, 1973), the latter are seen as an element of social structure providing access to the flow of information from different organizations (Burt, 1992) and an opportunity to connect to other social structures (Ibarra, 1993). Therefore, both types of ties can give place to the interactions where knowledge is created and transferred.
Implicit contractual arrangements can be another form of STs which can give rise to long-term bilateral exchange patterns (Wilson, 1980), where the actors involved would have better access to information, thereby facilitating access to resource allocation. This action is identified by repeated transactions (frequency) between producers and buyers. Frequency is what transforms a simple transaction into a long-term, quasi-contractual relationship, STs, implying trust, cooperation, and mutual benefits. These implicit contracts are based on mutual dependence and a system of reciprocation. Buyers need a constant supply of fish and fishers need a way to sell their production, and this takes place under accorded rights and benefits for each party. This allows for the development of trust and the necessary ongoing process of negotiations to maintain such ties. Following this proposal, WTs can be identified as those relationships where the product is sold on consignment implying less dependence among buyers and fishers, again a seldom-used relationship.
Therefore, STs in fish trade could be defined by trust expressed through oral agreements of cooperation that give rise to long-term bilateral exchange patterns. This is possible because of the dependence between buyers and fishers to obtain and sell fish. This relationship is influenced by supply and demand variability and given in terms of reciprocation. The maintenance of STs depends on how long the parties involved in the network can obtain a benefit of this partnership or add value to one another. The ending or beginning of a relationship will have an impact on the network topology and the performance of fish trade, and the ability to manage STs and WTs forms part of the necessary interactions to create or transfer knowledge and develop competitive advantage.
The third row of Table 2 links centrality measures of every node with network resources as termed in the strategic management approach. The highest values of centrality measures correspond to the best-connected nodes in terms of degree, betweenness, or other characteristics. These are the actors that have the ability to establish relationships with the best business partners and are able to influence or control network resources (J. C. Anderson et al., 1994). Part of the most valuable resources obtained from the network is the creation of an alliance portfolio. An alliance portfolio, from a social network perspective, is considered focal to a firm’s egocentric alliance network (Wassmer, 2010). This includes all the direct ties with partner firms or the aggregate of all strategic alliances to the focal firm (Lavie & Miller, 2008). In the case of fisheries, the focal firm can be the actor who takes the most important position in terms of bulking and distribution of fish products, a middleman or a wholesaler. Being the focal firm means being well connected with their trading partners, which favors the access to new and more valuable resources (Ozcan & Eisenhardt, 2009) and improves the ability to deal with different levels of uncertainty that characterize fish production and demand (Wilson, 1980). Therefore, in fish trading, organizing an alliance portfolio can be a key resource to adjust and adapt to the eventual supply and demand changes by giving the possibility to activate or deactivate STs and WTs (Lorenzoni & Lipparini, 1999; Ozcan & Eisenhardt, 2009), and forms part of the knowledge assets of the firm.
Two Examples of Fish Trade Networks
To illustrate the theoretical model above, two simple hypothetical examples are presented. These examples show how the pattern of interrelationships in the seafood supply chain, in the form of STs and WTs, can influence the efficiency of distribution, and why these types of socioeconomic elements can organize alliances that provide the resources for the industry to adapt to changes in supply or demand. In the next section, the characteristics of a real-world seafood trade network are examined.
It is assumed that there are only three types of actors in the network: suppliers, wholesalers, and retailers. The relationships among these actors are based on fish trading; any quota or lease trade is not considered in the examples. In both examples (Figures 1 and 3), STs involve a compromise between the two nodes, such that the lower tier should provide a quantity of product to the upper tier and vice versa, and the upper tier must accept at least part of the product from the bottom one. Instead of this, the WTs are inactive unless one of the two agents activates them, but it is not necessary that some amount of product passes through this process.

Distribution networks of aquatic products, Example 1. Case A and B.
It is assumed that a consumer’s demand is channeled through the distribution capacity of three retailers, who demand product from wholesalers and subsequently from suppliers connected by edges. Each supplier’s output is considered identical and, all together, covers six of the demanded units. For simplicity, it is assumed that every agent can process 0, 1, or 2 units of fish products to the upper tier. The performance of the supply network in every example is analyzed below.
Example 1. It is assumed that there is an increase in six units in fish demand (e.g., due to a sociocultural event, increase in consumer income, advertising, etc.). In this scenario, each agent activates WTs to access fish products (see Figure 1). Two outcomes are presented. In Case A, the demand of six units of product is not satisfied in a given time because wholesaler W2 cannot process the required amount of product to satisfy the demand from three connected retailers. In Case B, it is possible to satisfy the demand because wholesalers can process all fish products coming from suppliers.
The network metrics for the two cases above present some differences. Figure 2 shows the histograms for the node degree in both cases. As it can be observed, the degree distribution for Case B is closer to being homogeneous than for Case A, which is concentrated in extreme values. Thus, node degree distribution captures some of the underlying reasons for differences in the performance of the trade network between the two cases. Through these metrics, it is shown how in the case of similar capacity among agents, a more balanced degree distribution, which is true of Case B, favors a fast response to eventual increases in fish demand because the supplementary effort to satisfy demand can be similarly shared among actors. However, this is not the case for degree distributions with high kurtosis, such as in Case A. When this trade network topology is presented, the response to an increase in demand can exceed the distribution capacity of highly connected agents, while those that are lowly connected cannot cover this surplus from the lower tier.
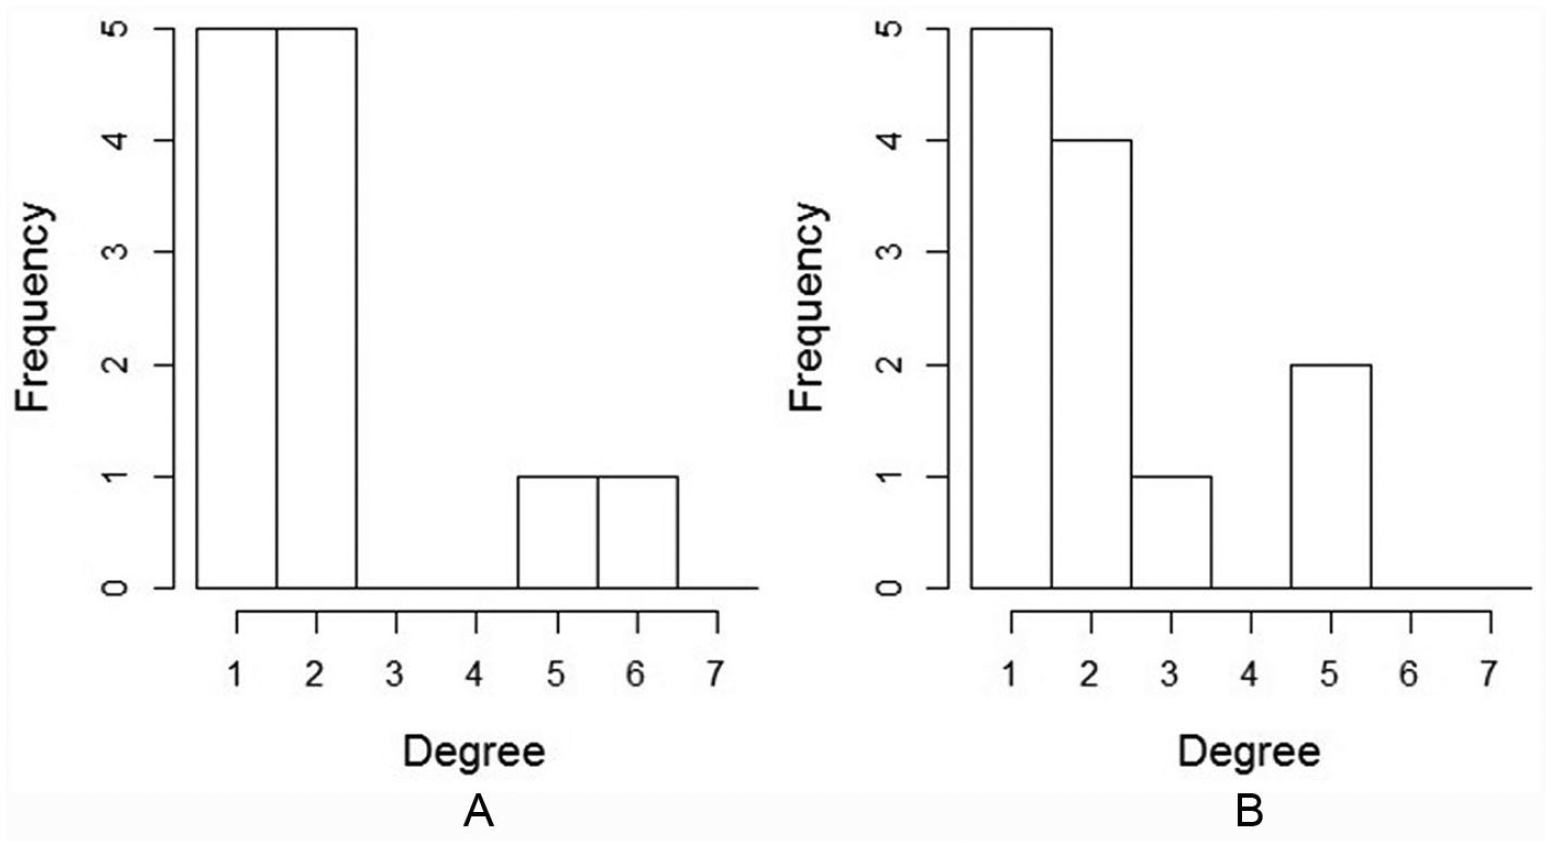
Histograms for node degree in the two cases of Example 1. Case A and B.
Example 2. It is assumed that an unexpected high level of production from fishers with STs occurs. Subsequently, WTs from suppliers remain inactive, but possibly those WTs between wholesalers and retailers should be activated. In Figure 3, it is assumed that each of the three suppliers connected through STs reaches a production of two units in a given period of time. Wholesalers distribute them preferably among retailers connected with STs. In Case A, overproduction does not occur because wholesaler W2 has STs with two retailers, R2 and R3, and needs to share his or her quantity between them. Consequently, wholesaler W3 cannot place all his or her fish. In Case B, each wholesaler distributes the product to the sole retailer connected through STs. In both cases, it is not necessary to activate WTs.
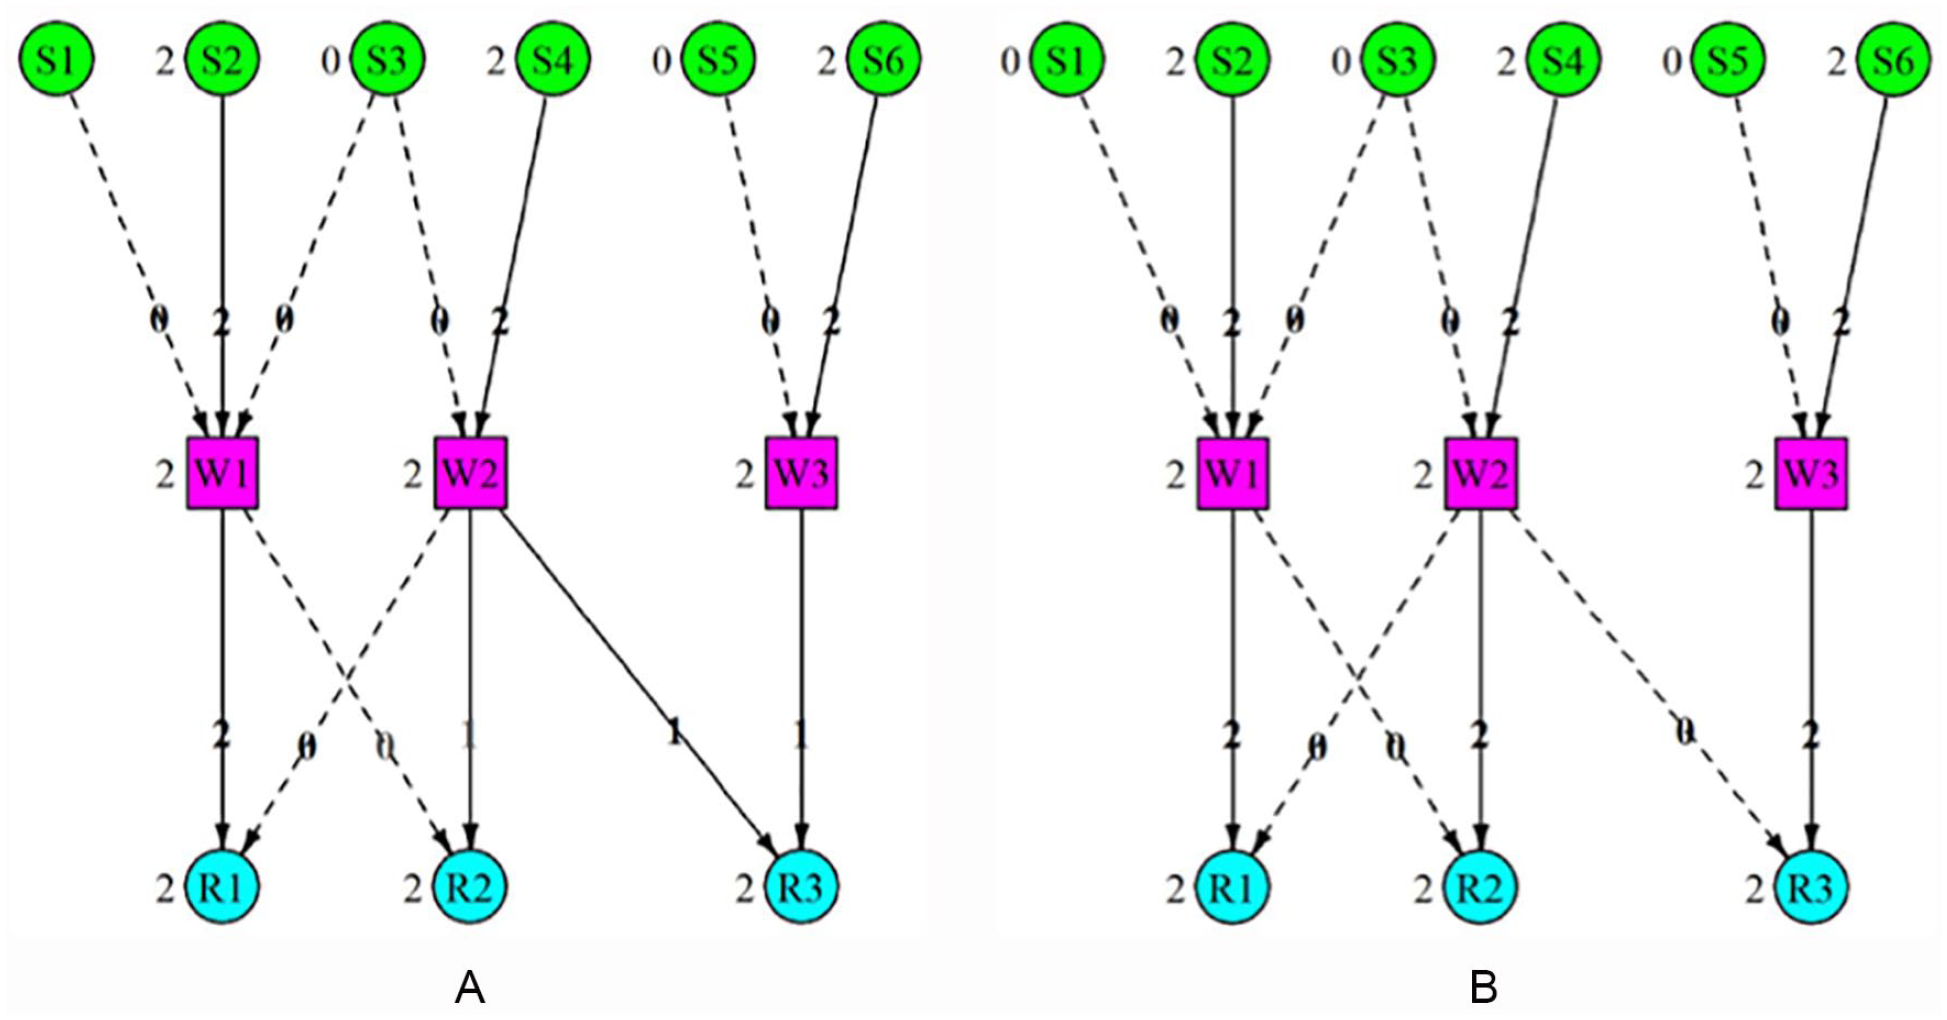
Distribution networks of aquatic products, Example 2. Case A and B.
The difference between the two situations is the ST and WT disposition among the tiers. Thus, in this example, a specific network metric can also be used to grasp the topological differences among the two supply chains showing how these differences can result in opposite performance. Figure 4 shows the distribution of the ST rate over the total edges of every node. As can be observed, the distribution of the ST rate is closer to a homogeneous distribution and displays a lower mean ST rate in Case B than in Case A (0.50 and 0.56, respectively). This statistical property is related to the good or bad performance of the supply network when an extraordinary event occurs. A high flexibility in fish trade among actors, given by a high provision of WTs in the total edges, allows for an equilibrated and fast adaptation to shocks because every agent can activate his or her contacts without many conflicts with others. On the contrary, the existence of a significant number of rigid edges in some supply chains makes this adaptation more difficult.

Histograms of the rate of STs over the total edges in the two cases of Example 2. Case A and B.
In both cases, it is shown that the nature of fish trade, through the network structure taken by the distribution of STs and WTs, and these topological differences can influence flexibility and adaptation in fish trade.
Furthermore, to explain these topologies, some studies based on real-life examples of fish trading relations are considered. A common case in small-scale fisheries is the role played by middlemen in connecting fishers with markets.
Middlemen in small-scale fisheries form social networks through different linking mechanisms given in terms of STs and WTs. Some authors have called these mechanisms as implicit contracts (Wilson, 1980) or “Labor-Tying-Loans” (Platteau & Abraham, 1987). Middlemen use loans to assure their access to fish because they expect to be repaid with fish, and the way they are issued to fishers is based on trust and oral agreements (Crona et al., 2010; Pedroza, 2013; Platteau & Abraham, 1987). These implicit contracts are based on mutual dependence and a system of reciprocation.
Fishers receiving loans from middlemen have developed an ST that indicates a compromise to sell their fish to them, giving rise to regular transactions. However, as in Example 1, when demand increases, middlemen will try to establish more ties with other fishers, (even if they do not receive loans or have any previous agreements) to be able to supply their buyers. Seldom-used relationships, WTs, will open the possibility to have another supplier without lending money. In this case, the level of commitment from both sides might be seasonal or random and not regular such as in STs.
In the case of overproduction, middlemen are also obligated to receive production from the fishers that owe them money, otherwise they risk underpayment, debt increase, and the loss of trust. Middlemen will have to buy fish from these fishers with STs and sell the product to their regular buyers and they might also need to look for seldom buyers; to accommodate the overproduction, they might have to sell the product on consignment, which can be the case of Example 2.
This shows why STs in fish trade are possible because of the dependence and reciprocation between buyers and fishers to obtain and sell fish, and to connect fishers with markets. However, this relationship is influenced by supply and demand variability which can determine the need to activate WTs; however, being able to find WTs when needed depends on the ability of middlemen to negotiate. Moreover, these different linking mechanisms performed by middlemen, having relations with suppliers and buyers, give them the opportunity to have information about supply and demand. This information and the interactions through these different links can give place to acquire the necessary knowledge to develop flexibility among trade partners and fast adaptation to shocks.
The use of STs and WTs implies multiple sourcing strategies to achieve an agile flow of fish products, increasing customer satisfaction. Thus, the reason why wholesalers have developed stable relations with suppliers and buyers is because they assure a reliable supply and, in the case of retailers, frequency and reliability in transactions. These abilities are the result of a process of knowledge creation through the interactions with network partners.
Case Study
To illustrate the model, this section shows the case of a real fish trade market, the MM in Guadalajara, Mexico. Figure 5 presents the sample of the supply network in the MM. Suppliers and buyers are aggregated into three levels: (a) regions in the state (Jalisco), (b) states in Mexico, and (c) foreign countries. This shows the introduction of the MM in the local, national, and international market. STs and WTs are also represented, indicating whether wholesalers declared that they have regular and sporadic transactions with the partner, respectively. In summary, this figure shows how the wholesalers in the MM have developed a network topology through STs and WTs.

Seafood supply chain throughout 10 wholesalers in Mercado del Mar, Guadalajara, Mexico.
The sample only includes vertical relationships (those from agents of different tiers). Horizontal links between wholesalers are assumed null. Thus, it is possible to compare the topological characteristics of the MM with those shown in the theoretical examples.
Table 3 shows the description of the suppliers and buyers in the sample, aggregated by sector and geographic origin. When declared relationships with agents nonassigned to a sector, it is assumed that they belong to the same company which is added to the network. By doing so, some wholesaler’s WTs are included, commonly associated with those agents.
Sample of Agents in the Seafood Supply Chain in the MM.

Note. The end code “00” indicates suppliers/buyers whose name was not specified by wholesalers. MM = Mercado del Mar.
Table 4 presents the statistical results of the supply network in the MM. This indicates that the degree distribution is homogeneous. According to Example 1 above, homogeneous degree distributions favor an efficient response to demand changes. However, the distribution of the ST’s rate in the wholesalers of the MM presents high mean and median values (0.61 and 0.60, respectively). As shown in Example 2, this fact may lead to problems in the allocation of sudden supply increases.
Statistical Results of Supply Network of the Sample of Wholesalers in the MM.

Note. MM = Mercado del Mar; STs = strong ties.
This case study allows showing what are the underlying elements involved in the establishment of a social network of STs and WTs and why the network partners have developed these types of trading interactions.
Wholesale markets attract basic traders such as suppliers and buyers but also wholesalers because they take the bulk of products, they are in permanent operation, they offer large volumes and a variety of products, and they include all the activities related to the selling of goods and services. The MM, by being the second largest fish market in Mexico, includes a wide network of suppliers and buyers and is considered a major fish distribution center, as the Market administrator explained: “there are other states in the country where you cannot find certain types of fish, here you can find about 350 fish varieties throughout the year”, and the traditions and experience developed by the wholesalers are also a major advantage in the market.
Most wholesalers in the MM have different specialties and some of them are already second or third generation of fish traders who inherited the businesses including social relations with suppliers, and according to the Market administrator “families follow tradition and know how to manage fish trading”. The inherited knowledge and experience from the MM pioneers attracted new fish businesses and “merchants who at the beginning would supply the market, now they have become important fish distributors in the MM” (Market administrator).
Wholesalers have two types of STs with suppliers: (a) long-term or (b) kinship relations. Three of the wholesalers are partially supplied by their relatives, either because they are in charge of bulking the product from the fishers’ cooperatives or because their relatives have fish processing plants, or “the owner has his own tilapia brands, and he has been working with Chinese for more than 15 years” (W1). Wholesalers have developed long-term relationships because they can assure a transaction: the supplier assures a reliable supply if the wholesaler commits to buy and pay for the supplied products, but suppliers must maintain quality and good prices. W9 explained “I have developed long-term relations with my suppliers because they always have had good product management, including quality, taste and large volumes of seafood.” This enhances trust and reliability, giving rise to stable relations, STs. Thus, they have fixed reliable suppliers to satisfy demand. However, at the same time, they also buy on consignment when demand increases. Buying under consignment agreements happens when demand increases during lent and sporadic suppliers appear trying to accommodate their products, or because the quality and quantity offered by the supplier are not always reliable, W6 explained that “I cannot commit to always buy the product from certain suppliers because sometimes their tilapia taste like mud.” This is the nature of WTs with suppliers, a strategy to diminish risks for wholesalers and increase their options to satisfy unexpected changes in demand.
The STs developed with buyers have been created upon source loyalty and asset specificity because wholesalers give preferential treatment to these retailers. They give them better prices and put aside the best products for them. “Loyal buyers are normally distinguished by the amount of fish they buy, and because their payments are reliable, thus we call them when we have the fish they like and give them better prices” (W1). Thus, the actors within an ST relationship are involved in a transaction enhanced by asset specificity investing and adapting to clients’ requirements (Bennett & Gabrielm, 2001). In the case of WT, they are mostly represented by the Tianguis, the people from the tianguis come here every day, they go around the market looking for what they want, they pay in cash and try to get the best fish, this is why we say that they are some of the best clients that sustain the MM (W5).
The fact that the distribution of the ST’s rate in the wholesalers of the MM presents high mean and median values does not necessarily lead to a problem of resource allocation because what most wholesalers do to manage overproduction is to freeze the extra supply and use this product when supply decreases. However, this product cannot be sold to the loyal retailers because most of them go to buy the best fresh fish of the day.
Therefore, in concordance with the examples presented in the previous section, the results show that the pattern of interrelationships in the MM is suitable for specific aspects of the supply chain efficiency but not for others. Moreover, the knowledge acquired through generations and updated during the interactions with suppliers and buyers forms part of the knowledge base of the MM to adapt to market changes. This initial conclusion is only based on two theoretical examples and needs to be tested with further theoretical and empirical analysis. Nevertheless, the case study illustrates the potential utility of metrics coming from the SNA to analyze the seafood supply chain efficiency.
Discussion
The examples and case study include the interactions among basic traders: suppliers, wholesalers, and retailers. They show how these actors have developed different types of social relations in the form of WTs and STs which can be graphically represented in a social network. The interactions from this human capital give rise to different network topologies (Figure 1, 3, and 5) and this can have practical and theoretical implications for fish trade.
Practical Implications
Node degree distribution is used to capture the underlying reasons for differences in the performance of the trade network between the cases because it can show the number and types of links, in other words, how the social relations between wholesalers, suppliers, and buyers are structured. This can be an indicator showing the ability of each wholesaler to manage their relations with suppliers and buyers, to create alliance portfolios. The actors that can establish relationships with the best business partners are able to influence or control network resources (Anderson et al., 1994). In other words, the wholesalers that can influence or control network resources demonstrate that they are able to apply the acquired knowledge, and their knowledge base is better managed than those who cannot deal with supply and demand variability or have a fast adaptation to shocks (Omerzel & Gulev, 2011; Penrose, 1959).
In the MM, WTs are represented by the tianguis, who are frequent clients to the market, but they buy the best and freshest fish where they find it. Thus, quality, seen as fresh fish, stimulates STs to the MM and WTs to wholesalers because buyers know that they will always find good-quality fish in the MM, but not necessarily with the same wholesaler. Therefore, this type of customers is an important source of external information for wholesalers, and this new information is a source to build new knowledge (Nonaka, 1994; Nonaka & Toyama, 2003). Tianguis are one of the drivers to stimulate wholesalers in the MM to define and maintain quality and seafood diversity because they are in contact with final consumer demands.
In the cases shown in this article, the efficiency of fish trade networks depends on the business partners’ ability to link, negotiate, and maintain different types of ties, and to manage them in accordance with fish production and demand variability. Therefore, according to the KBV, networks are a dynamic source of resources from which network partners can benefit (Sepulveda & Gabrielsson, 2013). Moreover, the way wholesalers deal with the different types of ties can be a way to show how organizational knowledge influences the ways in which companies face dynamic environmental changes (Grant, 1996).
Moreover, the fish businesses in the MM are part of a family traditional industry where the transfer of tacit knowledge is essential for the survival and development of the firm (Woodfield & Husted, 2017). Wholesaler’s ability to acquire, transfer, and adapt knowledge through the different ties within the network is one of the key elements to maintain this family business in the market.
Theoretical Implications
The forms of this social capital (network topology) can determine what the nature of fish trade is. STs and WTs are necessary for the efficient functioning of a supply chain because each tie can provide different types of resources (Gulati, 2007). STs are socially embedded within a level of trust and reputation, and WTs are opportunities to connect to other social structures. The best-connected wholesaler or the supply networks where wholesalers have developed the best way to connect are those with the most efficient distribution or the best quality fish.
In addition, being part of a supply network is a form of social capital, a valuable resource, represented by STs and WTs (Nahapiet & Ghoshal, 1998) because through these links, network partners can access different resources (Jack, 2005) such as an alliance portfolio making it possible to have the right partners at the right time (Jackson et al., 2010), or to knowledge assets (Nonaka & Toyama, 2005) that can help to develop new knowledge to face market changes. Therefore, access to different resources helps members to manage the flow of products (Rungtusanatham et al., 2003), to diminish supply uncertainty and better manage the risk involved in the dynamic conditions of fish markets. This explains why STs and WTs form part of the network resources and can have strategic value.
WTs become strategic and valuable resources because they can be activated or deactivated when needed, a characteristic difficult to substitute (Barney, 1991). In other words, the type of relations that are involved in these linking functions such as the level of trust, efficiency to respond to the needs of the trading partner, ability to connect with fishers and obtain products, ability to negotiate, and be part of the social network of fish trading are the source of creating value and enhancing competitive advantage. Moreover, trust as a key aspect of social capital, and one of the resources embedded within it, derives in interpersonal relations in the network where knowledge can flow among network members (Pee & Kankanhalli, 2016). Therefore, the level of trust developed within ties can enhance the daily flow of knowledge creation within network partners to maintain a reliable flow of seafood products.
Thus, this article contributes to the debate of the most suitable network structure for an efficient supply chain (Capaldo & Giannoccaro, 2015; Hernández & Pedroza-Gutiérrez, 2019; Kim et al., 2015). The examples show that homogeneous distributions of edges and the rate of STs are associated with more efficient supply chains than heterogeneous distributions. Nevertheless, this observation is based only on two simple examples and further exploration is necessary.
Limitations and Management Implications
The model shows how different topological structures of a social network have different effects on fish distribution; in cases of an increase in fish demand and an excess of fish production, wholesalers organize its WTs and STs to supply that demand or to process the excess of production. In addition, through this model and examples, we also identified some limitations and implications. Probably, one disadvantage is the limited number of actors because we only considered suppliers, wholesalers, and retailers, and fish trade can be a much more complex network, especially at the international level. However, at the same time, considering only three tiers can be a way to go deeper into this type of relations and into the understanding of how wholesale fish markets function.
Another limitation can be the fact of only considering vertical relations because horizontal relations also show the type of relations among the actors of the same tier, how cooperation and/or competition develop among them. However, one of the reasons why a market functions mainly through vertical relations is found in rural markets because in many cases, producers do not have the capacities to organize among themselves and to sell their products directly in wholesale markets. Then, they require the intervention of middlemen to connect them with national or international markets (Crona et al., 2010). They do not integrate to compete; they only produce and sell to intermediaries.
The examples and case study show the role of the type of ties in the efficiency of the fish trade network. The examples show a static model of fish trade network, leaving aside the dynamic nature of real fish supply chains. For example, the observed inefficiencies in product distribution in the two examples could be overcome by creating new links between the actors (e.g., horizontal links among wholesalers who share product in case of necessity). This dynamic behavior of the market is not represented in the two examples. Notwithstanding, the objective of the model is to illustrate how the network topology in fish supply chains influences the distribution efficiency, independently of the agents response to these inefficiencies.
Food, in general, and fish in particular, due to its high perishability, involves concerns regarding health and safety. In case of any perceived problem, consumers often react immediately (Van Woerkum & van Lieshout, 2007). This is why quality is a major concern among fish suppliers and buyers because consumers’ links to their suppliers might swift according to the quality of seafood. On the other hand, a constant high-quality product might also be a variable to keep ST functioning and to maintain a more constant network topology. At the same time, this is an important management implication involving the acquisition of an applicability of knowledge to manage the different types of ties in accordance with supply and demand variability.
However, different markets, even from the same commodity, have different organizational settings (Giulioni & Bucciarelly, 2011), and countries have different regulations about fish management and fish trade, as well as safety and quality standards. Even though the internationalization of fish trade demands more strict safety or management levels, in alternative or rural markets, these measures are difficult to justify because they are not specified. This is why in many markets, organizational structures might be given more by social interactions such as kingship rather than other variables such as quality or safety regulations.
This article has another important management implication by highlighting the relevance for wholesalers to recognize, acquire, and adapt the knowledge provided through their relations with STs and WTs to keep updated their seafood management practices.
Finally, further research could also be developed in terms of knowledge sharing across family fishing businesses, how this tacit knowledge can be transferred from one generation to another under the different market conditions of seafood availability and consumers demands.
Conclusion
This study presents a theoretical framework of fish trade networks that combines statistical, socioeconomic, and strategic management perspectives. This framework can be used to identify the existence and understand the nature and dynamics of fish trading relationships. How these interactions can modify the social network structure and economic behavior to enhance competitive advantage, create value, and become the structure where knowledge exchange for network partners takes place. Furthermore, this work contributes to the holistic vision of the seafood supply chain, as an initial attempt.
The theoretical model presented in this study shows how the structure of a network leads to different levels of performance (Koka & Prescott, 2002), and what type of relations are included in the management of interactions with basic traders (Ropicki & Larkin, 2014), or other agents (van Putten et al., 2011). The KBV approach explains why these links (relationships-ties) are taking place by describing the background (Gulati et al., 2000) and identifying the characteristics of the interorganizational relations that form the social network, the social capital, and give place to the creation and transfer of knowledge through these network interactions. Therefore, the ability to create, maintain, and manage an alliance portfolio is a knowledge asset to build competitive advantage and be able to give opportune responses to demand and supply variability because relations will give access to partners with valuable resources and become a source of knowledge. However, the value of these relations can be conditioned by the access to resources (Casanueva et al., 2013). This will help us to understand the nature and need for cooperation depending on market changes.
SNA allows the graphical representation and quantification of fish trade. By using this methodology, it is possible to identify, first, the structure of the social network where fish trade takes place and, second, the key actors, who are the most influential individuals that have the best connections to influence fish trade performance. Centrality measures, such as the node degree, are used to quantify the value of intangible resources that form part of the social capital of every agent in the network, whose competitive advantage on fish trade depends on their ability to create and manage an alliance portfolio to give an opportune response to market changes.
In the examples presented above, fish products pass through different actors whose relationships build a social network. The specific network structure can ease or complicate the flow of products from fishers to consumers. The ability to adapt to fish production and demand variability is related to the characteristics of the degree distribution of the fish trade network. Homogeneous degree distributions favor the efficiency of the fish trade network more than other bimodal high kurtosis distributions. In addition, the provision of STs and WTs can influence the efficiency of fish distributions. This also illustrates the importance of having both STs and WTs because they can be used in different situations to gain access to fish products. A homogeneous ST/WT ratio among actors can give flexibility to fish trade to adapt to market changes. These findings are limited to the specific examples presented in this study and must be taken with caution. Nevertheless, the observations in the examples and case study provide new arguments to the relationship between the pattern of interrelationship and the efficiency of a supply chain.
The information and the interactions through the different type of ties can give place to the necessary knowledge to develop flexibility among trade partners and fast adaptation to shocks. Suppliers provide information about fish stocks and buyers about final consumers’ demands. This can also show how organizational knowledge influences the ways in which companies deal dynamic environmental changes and how the efficiency of fish trade networks depends on the business partners’ ability to negotiate and maintain different types of ties in accordance with fish production and demand variability. Moreover, the level of trust developed within ties can enhance the daily flow of knowledge creation within network partners to maintain a reliable flow of seafood products. Family business can also enhance trust and interactions to transfer knowledge within the fishing industry.
The quantitative methodology (SNA) proposed in this article provides statistical data which can facilitate comparisons of different cases worldwide. This aspect is crucial to investigating general aspects of how fishers can respond to supply variability and market changes, a major challenge in the actual conditions of fish markets. In particular, it can be applied to the analysis of fish markets in small-scale fisheries considering fishers committed through loans, as a form of having STs with middlemen.
It is also shown that qualitative analysis is also necessary to understand and explain real-life networks because it goes beyond the shape and form of the network. Qualitative analysis makes it possible to explain the mechanisms and processes which influence the operations and functions of the social network.
Footnotes
Declaration of Conflicting Interests
The author(s) declared no potential conflicts of interest with respect to the research, authorship, and/or publication of this article.
Funding
The author(s) disclosed receipt of the following financial support for the research, authorship, and/or publication of this article: The study was funded by the Universidad Nacional Autónoma de México (UNAM) under grant PAPIIT IA300215 and IN301719, which financed the field study work and part of the travel expenses of both researchers, and the Government of Spain under grant ECO2014-59067-P financed part of the travels of Dr. Juan Hernández.