
Abstract
Enhancing financial well-being has been a challenge for countries, especially due to its positive impacts on economic growth, quality of life, and the physical and mental health of citizens. This article’s main objective is to estimate the level of perceived financial well-being in the Brazilian population and investigate how socioeconomic and demographic variables influence this perception. Using a scale adapted for emerging countries, this study employed a large sample of 3,998 participants, covering all five regions of Brazil. The results reveal that a significant portion of the Brazilian population presents a level of perceived financial well-being below the ideal, reflecting a concerning financial insecurity that affects more than 60% of the respondents. Additionally, it was observed that certain groups, such as young people, black and brown individuals, members of the lower socioeconomic classes, with educational levels up to completed elementary school, and self-employed workers, are particularly vulnerable. These findings point to the need for more targeted attention from society and government agencies to mitigate disparities and promote the financial well-being of all strata of the Brazilian population.
Introduction
Financial well-being is a topic of growing importance in the economic and behavioral literature, especially in times of rapid change and global uncertainty (Sorgente et al., 2022, 2024). The Covid-19 pandemic, for example, exacerbated financial challenges, impacting global markets and individual financial conditions, resulting in job losses, declines in Gross Domestic Product (GDP), and increased inflation, with particularly intense effects in developing countries like Brazil (Kumar et al., 2023).
Originally conceptualized based on an individual’s income (Ghazali et al., 2020; Wilmarth, 2021), financial well-being has evolved to encompass broader aspects. Today, it is characterized by the ability to manage day-to-day finances, absorb financial shocks, achieve financial goals, build savings, and have financial freedom (Consumer Financial Protection Bureau, 2015), being intrinsically related to financial behavior, financial knowledge, and personal traits (Fan & Henager, 2022).
It is possible to observe in the literature different ways of measuring financial well-being, with an objective perspective that encompasses factors such as income and wealth, and a subjective perspective, which prioritizes emotional and cognitive assessments of one’s own financial situation (Sorgente et al., 2022). In this line, financial well-being is generally measured in a multidimensional way (Bashir & Qureshi, 2023; Kaur et al., 2021; Riitsalu et al., 2023; She et al., 2023; Vieira et al., 2023).
However, despite its relevance, most studies still focus on developed countries, leaving significant gaps in the understanding of financial well-being in emerging economies, such as Brazil (Kumar et al., 2023). In this sense, Brazil is experiencing an especially challenging financial context, with more than 78% of families in debt (Confederação Nacional do Comércio, de bens, serviços e turismo-CNC, 2024), persistent gender wage inequalities (Rodrigues, 2023), and occupational segregation by gender and race (Souza Silveira & Siqueira Leão, 2021).
In addition, there is also a research gap regarding differences in the perception of financial well-being in Brazil. The international literature points to the existence of significant differences for variables such as gender (Chatterjee et al., 2019; García-Mata & Zerón-Félix, 2022), marital status (García-Mata & Zerón-Félix, 2022; Hira & Mugenda, 1998), income (Adam et al., 2017; Botha et al., 2021; Chatterjee et al., 2019; Choi et al., 2020; García-Mata & Zerón-Félix, 2022; Hira & Mugenda, 1998; Michael Collins & Urban, 2020; Neman, 2020; Vera-Toscano et al., 2006), ethnicity (Husniyah et al., 2012), and age (Jhuremalani et al., 2022).
Thus, the objective is to identify the perceived financial well-being of Brazilians and the differences according to various socioeconomic and demographic variables. To this end, the level of perceived financial well-being will be constructed as proposed by Vieira et al. (2023).
The innovation of this study lies in its focus on the Brazilian context, an emerging economy, where research on financial well-being is still scarce. Additionally, due to the lack of evidence in the literature on the behavior of financial well-being according to social class, this variable will be given special emphasis among the studied variables, seeking to bring new evidence and contribute to this gap. Another distinguishing feature of this study is the sample, which includes Brazilians from all regions of the country and with different socioeconomic and demographic profiles.
This study contributes to understanding the dynamics of financial well-being in Brazil, offering valuable insights for public policies and interventions focused on improving the financial health of the population. Understanding disparities in financial well-being is essential for the development of more inclusive and effective strategies in financial literacy and economic support, especially in a post-pandemic recovery context, where such inequalities may have been exacerbated.
Theoretical Framework
The theories that have been widely used in financial well-being studies are the Theory of Planned Behavior, Social Identity Theory, and Family Financial Socialization Theory. The Theory of Planned Behavior (Ajzen, 1991) is the most widely used in the literature (Bashir & Qureshi, 2023). According to this theory, behavior is influenced by three factors: attitudes toward the behavior, perceived behavioral control, and subjective norms. Ajzen (1991) explained that attitudes reflect an individual’s personal evaluation of the behavior, perceived behavioral control refers to the ease or difficulty of performing the behavior, and subjective norms represent the social expectations surrounding the behavior. Thus, the Theory of Planned Behavior offers a framework for explaining financial well-being by linking individuals’ rationales to their financial behavior (García-Mata & Zerón-Félix, 2022).
In addition to the diversity of theories, there is no consensus on the concept of financial well-being. Among the most commonly used definitions is that of the Consumer Financial Protection Bureau (2015). Therefore, in this study, financial well-being refers to a state in which an individual has control over their finances, possesses sufficient resources to manage unexpected events, is on track to achieve their goals, and enjoys the financial freedom to make choices that enhance their life experience (CFPB, 2017; Mahendru, 2021). In addition to positively impacting the individual lives of people, good levels of financial well-being in a population help economies to prosper and function properly (García-Mata & Zerón-Félix, 2022).
To better understand the well-being of individuals, two strands stand out proposing to evaluate objective and subjective aspects (Sorgente & Lanz, 2017). The objective approach mainly encompasses the economic resources of individuals, such as wealth, income, financial ratios, and liquidity (Chatterjee et al., 2019). However, it was observed that people with similar financial levels can present differences in terms of feelings of joy, fulfillment, and happiness, leading to the development of studies focused on financial satisfaction (Xiao et al., 2009).
In view of this, subjective well-being encompasses contentment in various areas, including interpersonal, community, professional relationships, physical, psychological, and economic sensations (Prilleltensky et al., 2015). This feeling of happiness or satisfaction can be linked to a sense of security, the ability to meet personal needs, or the possibility of achieving a desired standard of living (Chatterjee et al., 2019).
In the subjective line, several scales have emerged seeking to measure financial well-being. From this, the Consumer Financial Protection Bureau (2015) developed an assessment model based on cognitive interviews, factor analysis, and psychometric tests. However, the scale has greater adherence to developed economies and needs to be readjusted to adapt to the different realities and sets of public policies of local contexts (Organization for Economic Co-operation and Development, 2018; Sorgente & Lanz, 2019). Thus, Vieira et al. (2023) developed a scale of perceived financial well-being adapted to the context of developing countries.
Regarding the antecedents of financial well-being, they can be broadly categorized into individual-related factors, family/household/peer-related factors, and community/societal-level factors. Among the individual factors are socio-demographic characteristics, traits, skills, attitudes, motivation, and life events (Bashir & Qureshi, 2023). In this study, the focus is on socio-economic and demographic characteristics. Table 1 presents a summary of the evidence for these characteristics.
Summary of the Relationship Between Socioeconomic and Demographic Variables and Financial Well-Being.

Source. Authors’ own compilation (2024).
It is observed that in Table 1, the social class variable does not appear, but studies have already identified differences for the income variable. Lee et al. (2020), Michael Collins and Urban (2020), Riitsalu and Murakas (2019), Zyphur et al. (2015) observed that the income variable has a positive correlation with financial well-being. Dickason-Koekemoer and Ferreira (2019) found that individuals with lower annual incomes have lower levels of financial well-being. In these studies, the income variable was treated as a quantitative variable (monetary values) or in classes divided according to the researcher’s interest.
However, we understand that instead of a statistical classification (by quartiles) or for convenience, a socioeconomic stratification is more promising, especially in developing countries. Socioeconomic status is important for market segmentation in developing countries because emerging economies tend to be more hierarchical and exhibit greater separation between social classes, giving class distinctions a greater role than in economically developed societies (Burgess & Steenkamp, 2006). And a particular social class tends to persist for many years and share a broad way of life, have a more or less defined culture, and have similar concerns (Cottrell & Roslender, 1986). Different socioeconomic strata can reflect differentiated values, attitudes, social norms, lifestyles, and consumption patterns (Kamakura & Mazzon, 2016).
Method
Sample and Data Collection
Considering a population of 190,755,799 Brazilians (Brazilian Institute of Geography and Statistics, 2010), a confidence level of 95% and a margin of error of 2%, the desired minimum sample size was 2,401 respondents. The project was approved by the Research Ethics Committee (CAAE no. 53589721.5.0000.5346) and the respondents signed the Informed Consent Form (TCLE).
Ten interviewers were previously trained by the researchers to conduct the survey. Data collection instruments were printed and administered by interviewers in public spaces across all regions of the country during the first half of 2023. Individuals aged 18 years or older were included based on the study’s inclusion criteria.
The data collection took place in 32 Brazilian cities, and the obtained sample was 3,998 respondents. Table 2 presents the profile of the respondents.
Profile of Respondents According to the Variables Sex, Age, Marital Status, Race/Ethnicity, Education Level, Housing Type, and Occupation.

Source. Survey data (2024).
According to Table 4, the sample is predominantly female, white, and with their own home, corresponding to 59.1%, 70.9%, and 61.8% of the sample, respectively. Regarding age, there is a balance between the age groups, with the average age of the sample being 46 years old. The most prevalent marital status of the respondents is married. Regarding education and occupation, individuals with high school or higher education who work as public employees or salaried employees predominate.
Instrument
In order to achieve the proposed objective, a survey research was carried out with a structured questionnaire composed of two blocks. The first block aims to collect sociodemographic and profile aspects of the respondents with nine questions related to age, gender, race, marital status, occupation, education, number of financial dependents, housing, and income.
The second block consists of 23 questions aimed at measuring perceived financial well-being as proposed by Vieira et al. (2023). The questions have response alternatives according to a five-point Likert scale, ranging from 1-never to 5-always. Perceived financial well-being is formed by four dimensions: financial security; financial tranquility; financial freedom; satisfaction with financial management.
Financial security is related to socioeconomic variables such as income, occupation, and psychological aspects (Chatterjee et al., 2019; Choi et al., 2020), and deals with the ability of individuals to meet all their current and future financial needs (Netemeyer et al., 2018) and to deal with financial setbacks (CFPB, 2015, 2017). Financial tranquility, on the other hand, is related to aspects related to the feeling of having the money one needs, paying bills on time (Organization for Economic Co-operation and Development, 2018), and being able to enjoy life without worrying about money (Netemeyer et al., 2018).
The financial freedom item, the third dimension evaluated, is related to the possibility of the individual having financial autonomy and having access to non-essential consumer goods and services (Michael Collins & Urban, 2020), in addition to having money left over after paying their main expenses (Kempson et al., 2017). Finally, satisfaction with financial management is connected to financial knowledge and the individual’s ability to adequately plan their finances (Organization for Economic Co-operation and Development, 2018; Zhao & Zhang, 2020) and manage their finances (Kempson et al., 2017).
Regarding reliability, the four dimensions showed Cronbach’s alpha values above .9 in the original scale development study by Vieira et al. (2023). In our study, the dimensions also demonstrated excellent internal consistency: Financial Security (0.831), Financial Tranquility (0.849), Financial Freedom (0.933), and Satisfaction with Financial Management (0.925).
Based on the evaluation of these four dimensions, the methodology proposed by Vieira et al. (2023) and adopted in this work, classifies financial well-being as follows: 1.00 to 1.99 very low; 2.00 to 2.99 low; 3.00 to 3.99 high; and greater than 3.99 very high.
Analysis Techniques
For the data analysis procedures, descriptive statistics, mean comparison tests, ANOVA for differences in means, Games-Howell post hoc test, chi-square test, and regression analysis were employed. Descriptive statistics were used to outline the profile of the respondents and their perceptions of financial well-being. The chi-square test was applied to assess the association between levels of financial well-being and demographic characteristics. ANOVA and post hoc tests were conducted to examine mean differences in perceived financial well-being across social classes. Finally, to identify the determinants and assess the strength of the relationship between sociodemographic variables and financial well-being, two regression models were estimated:
Model 1:

Model 2:

where:
PFWBi is the perceived financial well-being of individual i;
As observed in both models, the dependent variable is perceived financial well-being. As independent variables, age, sex, race, marital status, occupation, education, financial dependents, and housing are used in Model 1. In Model 2, social class dummies are incorporated. Table 3 details the independent variables.
Description of the Independent Variables in the Regression Model.

Source. Authors’ own compilation (2024).
The individuals’ social classes were defined and adapted based on the Minimum Social Indicators (ISM), a segmentation by income proposed by Instituto Brasileiro de Geografia e Estatística (2010). The values included in each class can be observed in Table 4.
Social Class, Minimum Wage, and Corresponding Value.
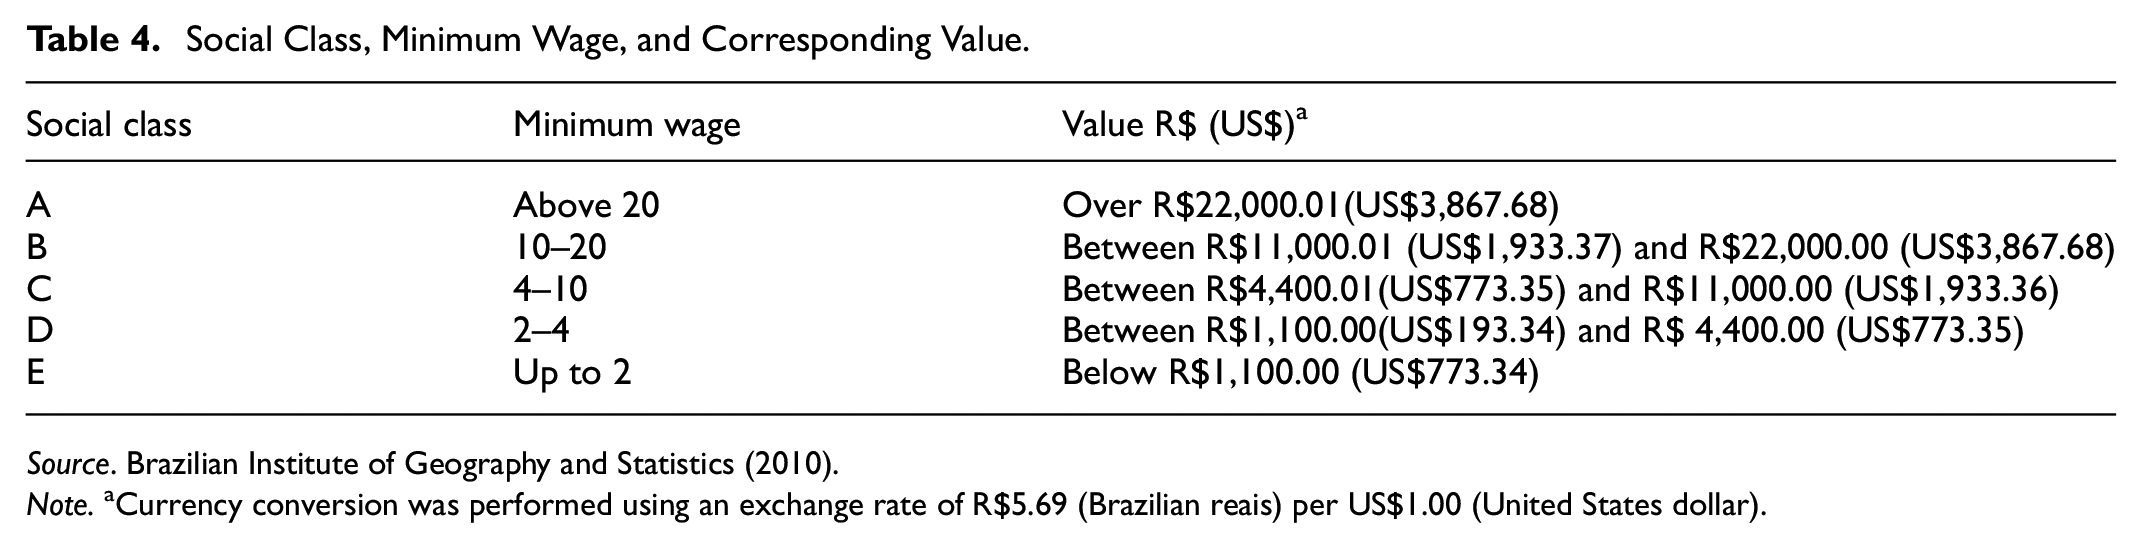
Note.Currency conversion was performed using an exchange rate of R$5.69 (Brazilian reais) per US$1.00 (United States dollar).
Due to the heteroscedasticity of the residuals, the HCCM (heteroskedasticity consistent covariance matrix) robust estimation proposed by White (1980) was used to calculate the regression model.
Presentation of Results
This section presents the analysis of responses from the 3,998 survey participants. It begins with descriptive statistics to illustrate participants’ perceptions across the four dimensions and their perceived financial well-being. Next, following the methodology proposed by Vieira et al. (2023), perceptions are classified into levels (very low, low, high, and very high), and associations between these levels and various socioeconomic and demographic variables are examined. Subsequently, the results of the analysis of variance for perceived financial well-being across social classes are presented. Finally, the findings of the multiple linear regression model are reported.
The initial step was to explore respondents’ perceptions of each item on the financial well-being scale. Table 5 presents the mean scores and the percentage distribution of responses for each option on the Likert-type scale.
Means and Valid Percentages of the Variables and Dimensions of the Perceived Financial Well-Being Scale.

Source. Survey data (2024).
Table 5 shows that, within the financial security dimension, three questions had the “Never” alternative as the most prevalent, pointing to the respondents’ inability to deal with unexpected adversities and build a reserve for their retirement. The results are consistent with what was observed by the World Bank, indicating that most Brazilians would not be able to get money in the short term to deal with unforeseen events (Demirgüç-Kunt et al., 2022).
In the financial peace of mind dimension, it is observed that in four of the five questions, the respondents mostly checked the “Sometimes” alternative, with the exception of the question about the feeling of being in control of their financial life, where they mainly indicated the “Always” alternative. The results point to a balance in perceptions, with a positive inclination regarding the feeling of being in control of their financial life.
Regarding financial freedom, the “Sometimes” alternative predominated again, being the most voted in five of the eight questions. The results indicate that the respondents feel that their money is not always enough for their daily needs and that, even when they manage to have some comfort, it is not enough to provide a vacation trip.
The individuals’ financial satisfaction is also in the middle ground, as the “Sometimes” alternative was the most checked in all the questions in this dimension. Nevertheless, the means of the questions were higher in this dimension than in the others, indicating that the respondents feel relatively satisfied with how they manage their resources. Based on the calculation proposed by Vieira et al. (2023), the four dimensions and the perceived financial well-being can be observed in Figure 1. And Table 6 provides more detailed information on the means and percentages of financial well-being and its dimensions.

Frequency distribution of dimensions and the perceived financial well-being scale.
Means, Standard Deviations, and Classification of the Perceived Financial Well-Being Scale.

Source. Survey data (2024).
It can be observed in Figure 1 that the distribution patterns are not the same across all dimensions. The tails of the distribution of the security and freedom dimensions are denser to the left, indicating that these are the dimensions with the worst perceptions. On the other hand, the distribution of satisfaction is more flattened, indicating a more diverse perception among the population regarding their ability to properly manage their resources. However, for the perception of financial well-being, a relatively symmetric distribution is observed.
Also, according to Table 6, it can be concluded that, except for the Financial Security dimension, all other dimensions—as well as the consolidated perceived financial well-being—are close to the average score of three, which is considered a high level according to the classification proposed by Vieira et al. (2023).
Next, an effort was made to evaluate the role of socioeconomic and demographic variables in the perception of financial well-being. For this, chi-square tests were initially used to assess the association between the variables and the classification of the level of perceived financial well-being. Subsequently, using the quantitative measure of perceived financial well-being, a regression model was applied. Table 7 presents the initial assessment of the association of perceived financial well-being with the different sociodemographic characteristics of the interviewees.
Contingency Table: Perceived Financial Well-Being Versus Socio-Economic and Demographic Variables.

Source. Survey data (2024).
p < .01 (statistically significant).
Table 7 shows that there is an association with financial well-being for all variables, except for gender. The results for social class demonstrate that the lower social classes predominantly have lower levels of perceived financial well-being. In contrast, the higher social classes observe the best levels of financial well-being. These results are in line with what has been observed in other countries for income, both in developed countries such as the United States (Choi et al., 2020) and in developing countries such as India (Chatterjee et al., 2019; Prakash et al., 2022).
Regarding the age of the respondents, it is possible to observe that a smaller percentage of young people have high levels of financial well-being compared to older individuals. These findings are supported by similar studies (Michael Collins & Urban, 2020), but contradict other findings that indicate there is no statistically significant association between age and financial well-being (Chatterjee et al., 2019) or even indicating a negative correlation in developing countries, such as Mexico (García-Mata & Zerón-Félix, 2022).
Regarding marital status, it is observed that widowed or married individuals predominate in the high and very high range of perceived financial well-being. It is possible to identify a global trend of better levels of financial well-being in individuals who are married or living with their partner, both in developed countries (CFPB, 2017) and in emerging economies (García-Mata & Zerón-Félix, 2022).
Individuals of white ethnicity had higher percentages of high perceived financial well-being. The results find broad support in the literature (Clark et al., 2021; Dickason-Koekemoer & Ferreira, 2019; Lee et al., 2020; Mogaji et al., 2021), in addition to observing that blacks have a lower probability of presenting high financial well-being indices compared to white individuals (Hudson et al., 2022).
Regarding education, it is possible to identify that individuals who have a college degree, specialization, master’s or doctorate have higher classifications of perceived financial well-being. The results obtained are in line with other studies, which point to this result mainly due to greater financial effectiveness (Chatterjee et al., 2019; Fan & Babiarz, 2019; Ghina & Sukarno, 2021).
Regarding the type of housing, individuals who own their own home or have a mortgage showed better levels of perceived financial well-being compared to others. It is observed that not having one’s own home increases the risk of indebtedness (Wong & Lynn, 2020), which in turn directly affects financial stress and financial well-being (CFPB, 2017; Fan & Henager, 2022).
Finally, business owners and civil servants showed the highest levels of perceived financial well-being. Notably, a stable job is associated with better financial well-being indices (Chatterjee et al., 2019).
Next, considering the lack of evidence in the literature for social class, it was decided to also use the analysis of variance to identify potential differences in the means of perceived financial well-being between social classes (Table 8).
ANOVA Test for Mean Differences Among Social Classes in Perceived Financial Well-being.
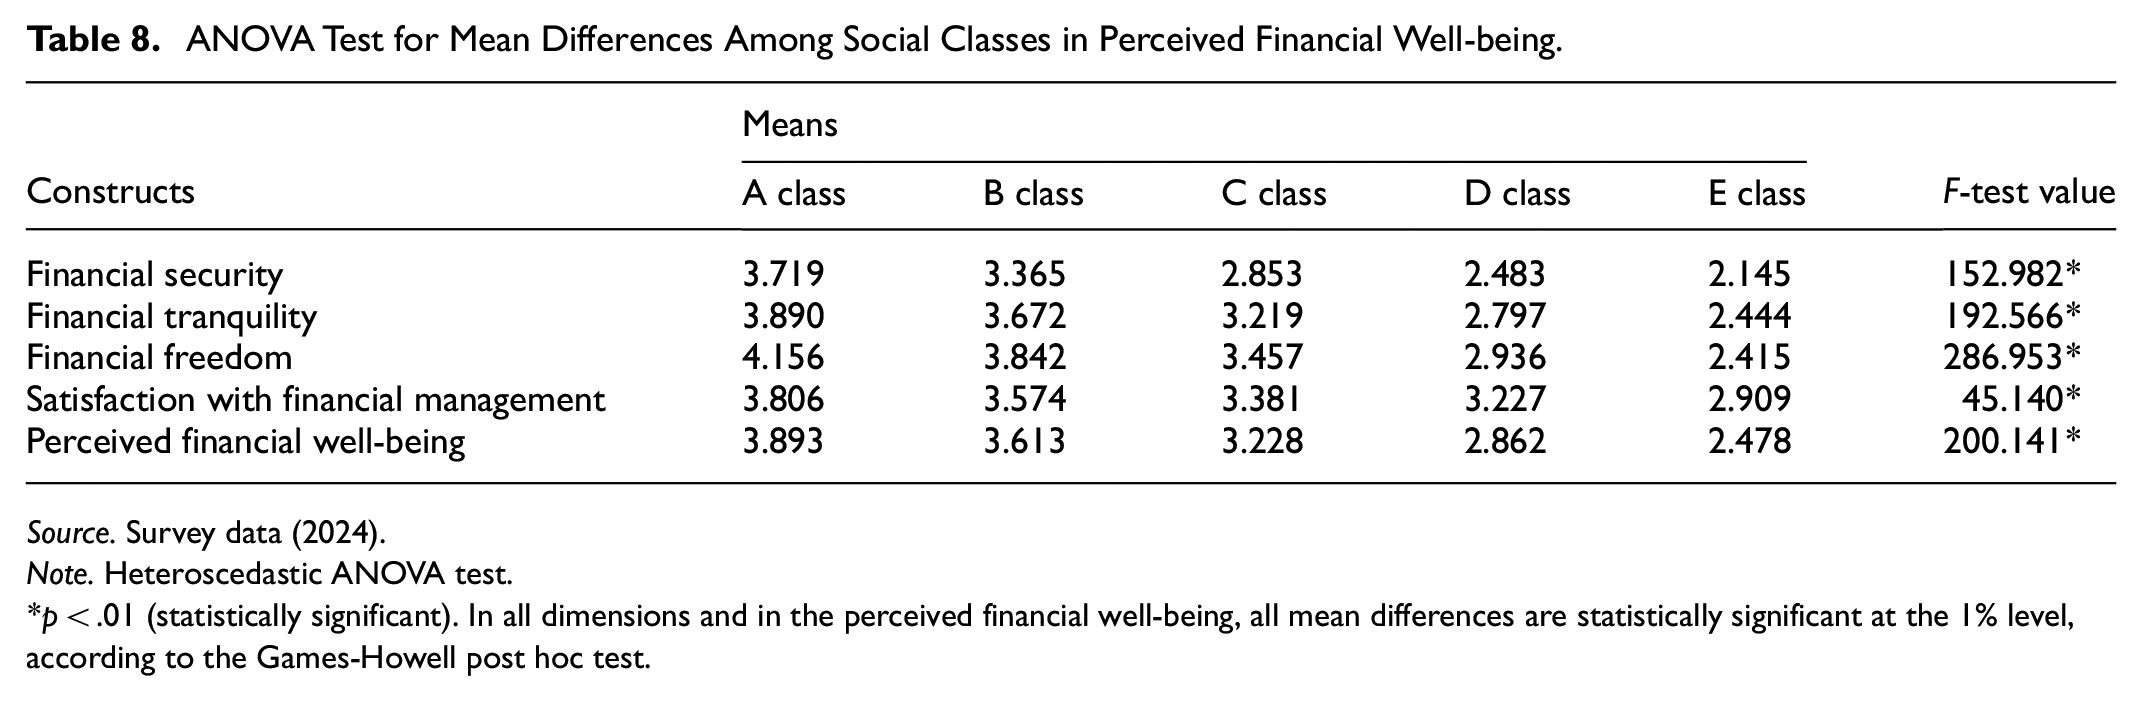
Source. Survey data (2024).
Note. Heteroscedastic ANOVA test.
p < .01 (statistically significant). In all dimensions and in the perceived financial well-being, all mean differences are statistically significant at the 1% level, according to the Games-Howell post hoc test.
Table 8 shows that as social class increases, perceived financial well-being and all its dimensions also grow. In all dimensions, the highest means are in social class A, while the worst are in class E. When analyzing the social classes, it is observed that among the higher classes (A, B and C) the highest means are in the financial freedom dimension, while in the lower classes (D and E) the highest means are in satisfaction with financial management. Therefore, there is a wide discrepancy between the classes. The poorest class has the majority of means around a value of two, that is, they “rarely” feel financially secure, peaceful or free, and only “sometimes” feel satisfied with their financial management. On the other hand, the wealthiest have much higher means, indicating that for all dimensions they perceive that they “often” feel financially secure, peaceful, satisfied and free, that is, they perceive a high level of financial well-being. These results are in line with those obtained by Kamble et al. (2024), who conclude that poor Indians are more likely to have a low level of financial well-being than non-poor.
Finally, multiple linear regression was performed, as presented in Table 9, in order to identify the significance and intensity of the correlation of the observed independent variables with the individuals’ perceived financial well-being.
Values and Significance of Coefficients From Estimated Regression Models for Perceived Financial Well-Being.
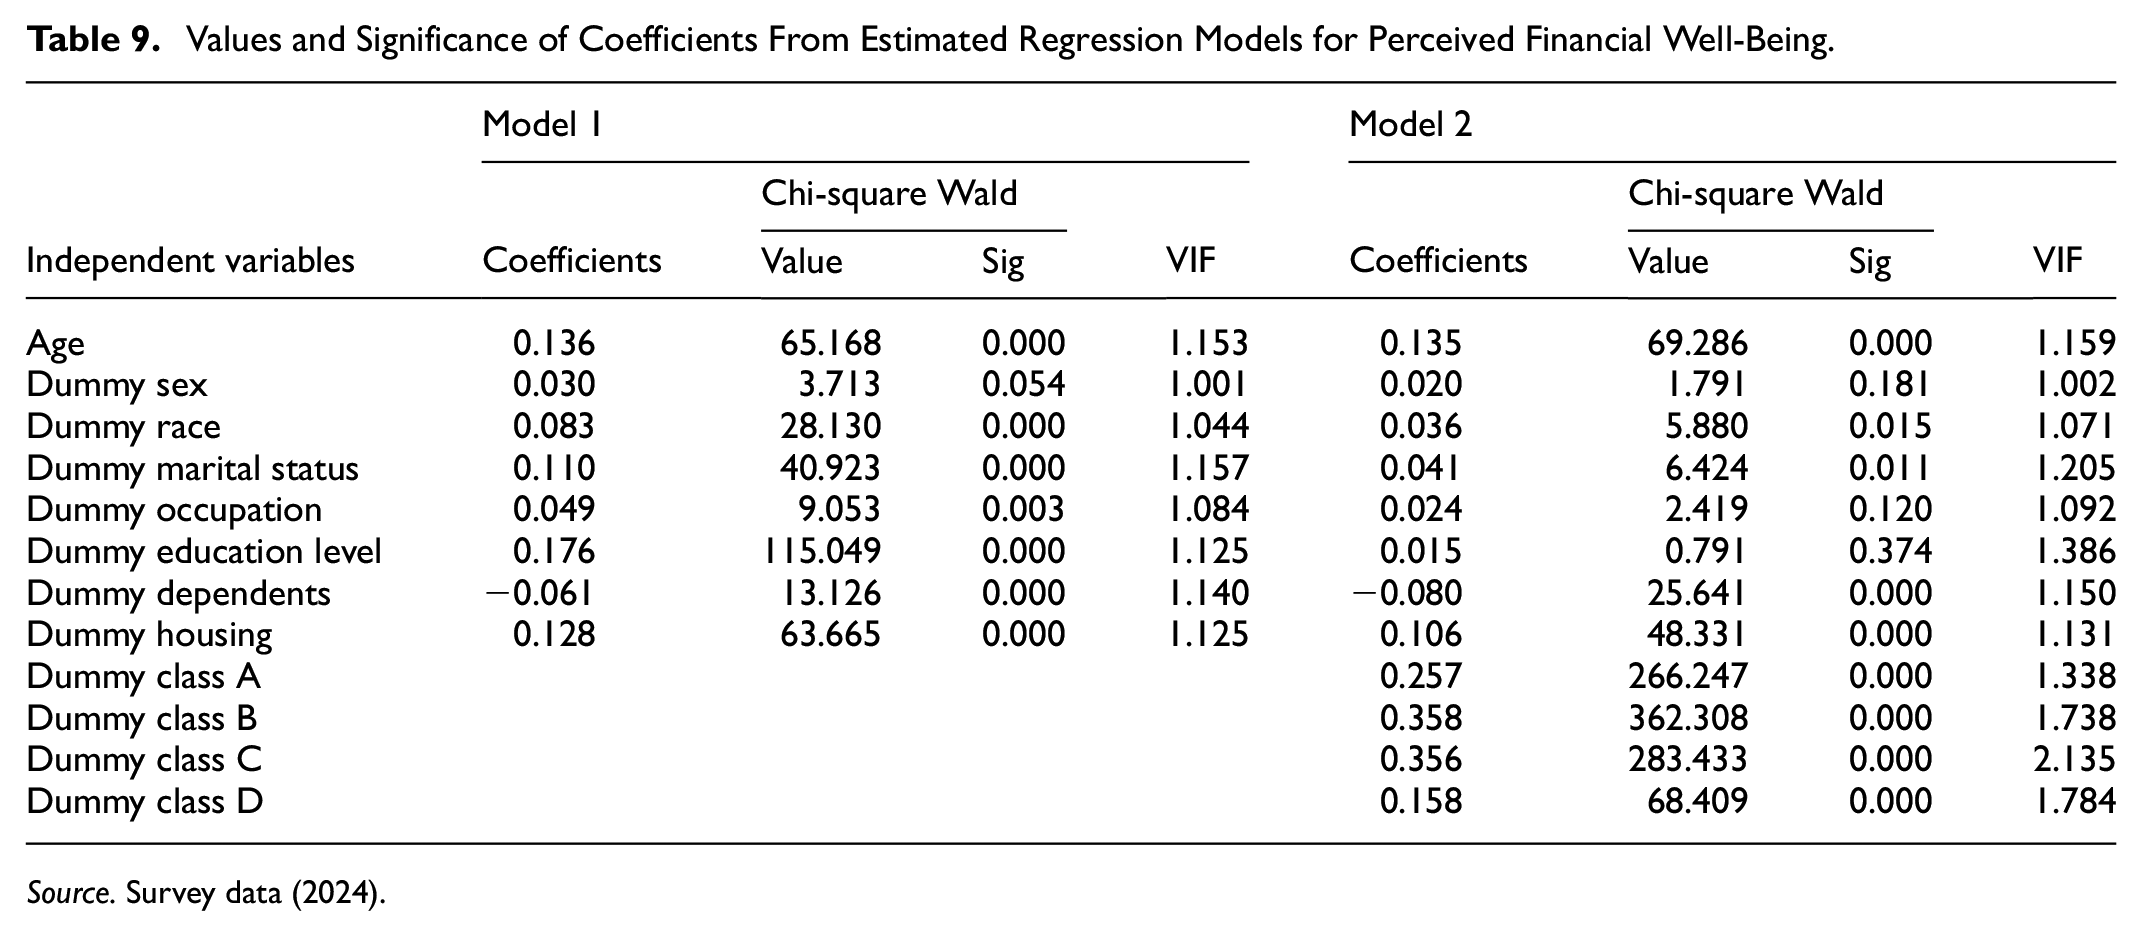
Source. Survey data (2024).
In Model 1, it is observed that all variables are significant at the 1% level, except for gender. The coefficients indicate that white individuals, married individuals, public employees or salaried employees, the more educated (college degree or higher), those who own their own home, and those who do not have dependents perceive higher levels of financial well-being. These results are consistent with most of the evidence presented in Table 1.
In the second estimation (Model 2), it is observed that when adding the social class dummies to the model, the occupation and education level dummies became non-significant. On the other hand, the most representative positive coefficients refer to the social classes, showing that the higher social classes have a higher level of perceived financial well-being.
Another notable coefficient was age, showing, like Michael Collins and Urban (2020), that older individuals have a higher level of perceived financial well-being. The results again indicate that individuals of white race and without dependents have a higher level of financial well-being, confirming the findings of the international literature (Clark et al., 2021; Keese, 2012; Lee et al., 2020; Mogaji et al., 2021).
In turn, gender did not show statistical significance in either the Pearson chi-square test or the two linear regression models. Michael Collins and Urban (2020) also did not find statistically significant differences when evaluating gender and its correlation with financial well-being. Recently, Kumar et al. (2023), when evaluating a set of sociodemographic variables, also identified that gender, education, marital status and education level do not influence the financial well-being of Indians.
Discussion
The findings indicate that the average perceived financial well-being among Brazilians is three on a scale from 1 to 5, suggesting that, on average, individuals perceive themselves as experiencing financial well-being only “sometimes.” The distribution of responses around the mean was relatively symmetrical, highlighting significant variability within the population. While 48.9% of respondents reported low or very low levels of perceived financial well-being, 51.1% reported high or very high levels, underscoring the heterogeneity of experiences across different segments of the population.
Among the four dimensions assessed, the lowest mean score was observed for financial security. With an average of 2.69, and 60.1% of respondents reporting low or very low levels of perceived financial security, this result reflects a widespread sense of vulnerability. This finding may be attributed to the limited capacity of many Brazilians to save or engage in long-term financial planning. Supporting this interpretation, Vieira et al. (2023b) found that three out of four Brazilians have never calculated how much they need to save for retirement. This is particularly relevant given that the ability to plan for the future and protect oneself against financial shocks is a critical factor in achieving financial well-being (Estrada-Mejia et al., 2023).
In line with previous studies (e.g., García-Mata & Zerón-Félix, 2022; Kamble et al., 2024), the data show that younger individuals tend to report lower levels of financial well-being. One possible explanation is that more recent cohorts are more likely to experience heightened financial insecurity (Wijaya et al., 2024), possibly due to unstable labor market conditions, rising living costs, and growing debt levels.
The results also suggest that education plays a significant role in financial well-being, as higher levels of schooling were positively associated with greater perceived financial well-being. This may reflect the broader impact of formal education on individuals’ ability to understand financial concepts, make informed decisions, and navigate complex financial systems. Notably, in recent years, Brazil has made strides in integrating financial education into various educational levels. Such efforts are supported by the literature, which demonstrates that formal financial education not only directly improves financial literacy and promotes the use of financial technologies, but also indirectly contributes to positive financial behaviors and higher financial well-being (Zhang & Fan, 2024). Moreover, individuals with financial education are better equipped to understand tax systems, compare investment alternatives, and interpret financial regulations (Mahendru et al., 2022).
An important and innovative aspect of this study was the inclusion of social class as a determinant of financial well-being. The results confirmed the importance of this variable, as individuals from lower social classes consistently reported significantly lower scores across all dimensions. This finding supports the view that social class shapes financial behaviors, concerns, and perceptions, reinforcing the idea that public policies should be sensitive to class-based disparities. Given that a large share of the Brazilian population belongs to the D and E social classes, efforts to improve financial well-being must prioritize these groups.
Lastly, the analysis identified specific demographic profiles that are particularly vulnerable: young adults, Black and Brown individuals, those from lower socioeconomic classes, people with only primary education, and self-employed workers. These groups consistently reported lower levels of perceived financial well-being. This evidence highlights the urgent need for targeted social and economic policies aimed at reducing inequality and promoting inclusive financial well-being.
Final Considerations
Analyzes of individuals’ financial well-being have become an increasingly present and relevant topic, especially after financial shocks caused by the pandemic, financial crises and high inflation around the world. The topic becomes even more relevant when analyzed from the perspective of developing countries, as is the case of Brazil, where almost 80% of families are in debt (Confederação Nacional do Comércio, de bens, serviços e turismo-CNC, 2024).
The study explored the perceived financial well-being among Brazilians of different profiles, revealing critical nuances and significant differences that shape financial health in Brazil. Through a quantitative approach, it was evident how personal characteristics influence individuals’ financial well-being.
Therefore, this work reaffirms the complexity of financial well-being as a multidimensional construct that goes beyond the mere accumulation of financial resources, also encompassing aspects of financial security, peace of mind, freedom and satisfaction. By highlighting the determinants of perceived financial well-being and the existing disparities, this study provides a valuable basis for the development of more inclusive and effective public policies and educational interventions, aiming to promote financial health for all Brazilians, but focused especially on the lower socioeconomic strata, the population segment with the lowest levels of perceived financial well-being.
Promoting actions that increase the level of financial well-being of the population is essential not only to reduce financial problems such as the high rate of over-indebted families and lack of financial preparation for retirement, but also brings positive consequences for various health-related aspects such as reduced anxiety (Strömbäck et al., 2020), depression (Negash et al., 2021) and suicide (Adinkrah, 2020), as well as increased self-esteem (Hashmi et al., 2021). It also has positive impacts on quality of life, happiness and relationship quality (Brüggen et al., 2017). However, better results can be achieved if government agencies, financial and educational organizations adopt integrated and differentiated actions, considering socioeconomic and demographic issues (Singh & Malik, 2022).
Furthermore, given the ample evidence that financial literacy contributes effectively to retirement planning, reduction of over-indebtedness, improvement of family financial management, and is considered one of the main antecedents of financial well-being (Singh & Malik, 2022; Zaimovic et al., 2023), the expansion of financial literacy actions is a promising path. The inclusion of financial education as a cross-cutting theme in the school curriculum was an important initial step. Expanding digital financial literacy (DFL) strategies is also essential, as evidence indicates that DFL can increase financial well-being for both the poorest and the financially better-off groups (Kamble et al., 2024). However, for the country to effectively achieve better levels of financial education and, consequently, greater financial well-being, a broad joint effort by the government, organizations and civil society will be necessary.
This study, despite the great sample representativeness, is not exempt from limitations. The main one is based on the fact that it is a survey research, where individuals may not provide accurate responses or opt for more socially acceptable alternatives. In addition, the use of a cross-sectional approach limits the ability to infer causality between the studied variables.
Future research could address these limitations by using longitudinal designs to explore changes in financial well-being over time. It would also be relevant to investigate the impact of specific financial education interventions on the financial well-being of individuals, especially in the most vulnerable groups. Studies that delve deeper into the effects of social class, including the adoption of new proxies, are also promising.
Footnotes
Ethical Considerations
This study was approved by Federal University of Santa Maria Research Ethics Committee (approval no. 53589721.5.0000.5346). Respondents gave written consent for review and signature before starting interviews.
Funding
The authors disclosed receipt of the following financial support for the research, authorship, and/or publication of this article: The authors thank the National Council for Scientific and Technological Development (CNPq; CNPq - grant number 308953/2022-3) and the Research Support Foundation of the State of Rio Grande do Sul (FAPERGS – grant number 21/2551-0002134-9) for the financial support.
Declaration of Conflicting Interests
The authors declared no potential conflicts of interest with respect to the research, authorship, and/or publication of this article.
Data Availability Statement
The data that support the findings of this study are available from the corresponding authors upon reasonable request.