
Abstract
The rise in the interest in ESG-Financial performance nexus has brought with it both opportunities and challenges for companies managing their risk-return dynamics with shareholders and other stakeholders. This paper investigates the impact of environmental, social, and governance indicators on the corporate financial performance of 249 public companies selected from Europe, the Middle East and Africa (EMEA) and the Latin American economic regions from 2010 to 2020. We use the panel generalised quantile instrumental variable and common correlated effect mean group estimators, which are robust to cross-sectional heterogeneity, endogeneity and cross-sectional dependence issues. Our findings suggest that ESG plays a significant role in influencing the financial performance of companies. Moreover, high-performing firms tend to see positive effects from ESG indicators, while low-performing firms may benefit from corporate social responsibility. By incorporating unobserved common factors to account for potential cross-sectional dependence, we found that the financial performance of firms in the lower and middle quantiles could be significantly enhanced through improved ESG disclosure and performance. In addition, the relationship between ESG indicators and leverage tends to favour high-performing firms over lower-performing ones. We confirm that the relationship between ESG indicators and corporate financial performance is heterogeneous, and there are possible unobserved common factors that could potentially bias the estimated coefficients. However, our econometric methods are robust and flexible enough to address these econometric issues.
Plain language summary
This study examines the relationship between the disclosure of environmental, social, and governance (ESG) information and financial performance by considering the interests of all stakeholders against the backdrop of the stakeholders’ theory. Based on the findings, it is important to emphasise that, overall, ESG is a substantial driver of corporate financial performance. The regulatory landscape for ESG disclosure varies across countries, with some implementing mandatory requirements and others relying on voluntary frameworks. However, our findings suggest that the relationship between ESG indicators and financial performance is considerably contingent on institutional effectiveness through corruption control and governments’ effectiveness in enacting proactive and pragmatic policies that are financially and economically induced.
Keywords
Introduction
Financial performance, environmental, social and governance sustainability performance and disclosure are becoming more and more important to policymakers, investors and companies; see A. C. Ng and Rezaee (2015), Chen and Xie (2022) and C. Zhang et al. (2024). The rise of this interest has brought with it both opportunities and challenges for companies managing their risk-return dynamics with shareholders and other stakeholders; see also Melinda and Wardhani (2020). Businesses are looking for longer-term, more sustainable, and morally sound ways to conduct business, and capital markets are now focusing on how to integrate governance, society and the environment Chen and Xie (2022). The global trend of sustainability reports has grown significantly, from 48 in 2000 to 12,075 by 2017, indicating the growing commitment of global companies to sustainability (Halkos & Nomikos, 2021; Merello et al., 2022). Currently, the vast majority of the world’s top 250 companies (G250) provide reports on sustainability. The reporting rate among the G250 in 2022 remains unchanged at 96%, which is the same as in 2020; see KPMG (2022).
Businesses are greatly concerned about sustainability issues, which has prompted them to create strategies to tackle problems related to pollution, water consumption, climate change, labour rights, activities of supply chain partners and the impact on local communities (Maloni & Brown, 2006; Waddock et al., 2002; Whitehouse, 2006). In the last 20 years, there has been a focus on environmental, social, and governance (ESG) practices, which have expanded businesses’ objectives from solely maximising shareholder wealth to meeting the expectations of all stakeholders; see Xie et al. (2019) and Santamaria et al. (2021). Emerging markets encounter challenges due to the forces of globalisation and the presence of weak institutional frameworks while ensuring ESG practices (Hoskisson et al., 2000; Marquis & Raynard, 2015). ESG disclosure and performance are gaining traction, particularly in developing regions like Europe, the Middle East, Africa and Latin America (Mohammad & Wasiuzzaman, 2021; Morris, 2023). This trend is driven by investor pressure, regulatory requirements and the growing recognition of sustainability and responsible business practices; see Lin et al. (2023). The regulatory landscape for ESG disclosure varies across countries, with some implementing mandatory requirements and others relying on voluntary frameworks; see Baldini et al. (2018) and Yoon et al. (2023). Investor interest in ESG factors is growing, leading to pressure for firms to improve their ESG performance and disclosure practices (Singhania & Saini, 2023). However, challenges such as capacity constraints and a lack of data in developing regions may hinder the adoption of ESG practices.
In the aftermath of the global financial crisis, companies are placing a high priority on engaging in ESG activities in order to restore their reputation and demonstrate social responsibility (Cassely et al., 2021; Nirino et al., 2021). Robust corporate governance is essential for future operations and ensuring consistent financial performance; see Zaid et al. (2019). Corporate social performance serves as a protective barrier against market reactions and safeguards a company’s stock (Al Frijat et al., 2024). Robust corporate governance and a strong track record in ESG performance contribute to the maintenance of consistent profitability and less fluctuation in stock prices (Di Vito & Trottier, 2022). Nevertheless, increased investment in ESG initiatives may not consistently receive a positive response from shareholders, as they might choose to withdraw their capital from the stock market, leading to an abrupt decline in stock price and profitability; see Mattingly (2017).
The current study is motivated by the stakeholder theory, which suggests that when making business decisions, management should consider the benefits of different stakeholders (Argandoña, 1998; Friedman, 1984; Gibson, 2000; Stieb, 2009). Stakeholder theory guides management to focus on business operations that enhance the long-term value of the company and voluntary actions that result in sustainable performance in environmental, social, and governance (ESG) aspects, which are important to all stakeholders (Santamaria et al., 2021; Xie et al., 2019). The concept of business sustainability involves stakeholders who hold property or legal rights (such as shareholding), have a direct interest, or stake and take on the risks associated with business operations. Other stakeholders may also possess contractual obligations, legal claims or moral responsibilities; this includes creditors, employees, suppliers, society and the environment. This study examines the relationship between the disclosure of environmental, social and governance (ESG) information and financial performance by taking into account the interests of all stakeholders.
We make some practical contributions to the existing literature in the ESG-financial performance nexus; see Shakil et al. (2019), Melinda and Wardhani (2020), Bahadori et al. (2021), Chen and Xie (2022), among many others. First, the existing studies, however, have expanded less into emerging markets and even less into developing countries situated in Europe, the Middle East, Africa and Latin America. Furthermore, research often focuses on the relationship between corporate governance and the economic development of countries and bank performance and not on the decomposed measures of environmental, social and governance, as well as the sensitivity of the environment and social indicators. More importantly, we assess the interaction effect of ESG indicators and firm leverage. This is against the backdrop that studying the interaction effect between ESG indicators, and the debt-to-asset ratio is essential for holistic risk assessment, understanding financial performance drivers, meeting stakeholder expectations, making strategic decisions and ensuring compliance with regulatory requirements in an increasingly complex business environment (Nirino et al., 2021). The purpose of this paper is to fill these gaps. Second, we utilise econometric techniques to mitigate biases arising from the joint endogeneity of explanatory variables and address issues related to unobserved country-specific effects. Additionally, we account for cross-country heterogeneity, distributional effects, and cross-sectional dependence; this is scant in the ESG-financial performance literature. Particularly, we use the Dynamic Common Correlated Effect Mean Group by Pesaran (2006), and Panel Generalized Quantile Regression estimators initiated by Powell (2020). This approach is robust to common shocks like global crises, offering insights into both the long-run effects of our ESG disclosure and performance measures on the financial performances of public companies in Europe, the Middle East, Africa and Latin America (Chudik et al., 2013; Chudik & Pesaran, 2015; Ditzen, 2022).
We organise our study into seven sections; introduction, theoretical underpinning, literature of relevant and related studies, empirical strategy which encompasses the empirical model and methodology, results and findings discussion, conclusion and policy implications and future research direction.
Theoretical Underpinning
We premise our empirical study against the backdrop of stakeholder theory. The stakeholder theory demonstrates that the market value of a company is primarily determined by its capacity to fulfil the demands of its stakeholders (Argandoña, 1998; Friedman, 1984; Gibson, 2000; Stieb, 2009). Institutional investors, being significant stakeholders in businesses, prioritise policy direction and public demands, which encompass quality products and social needs (Waddock et al., 2002; Whitehouse, 2006). The unprecedented occurrence of COVID-19 has prompted investors to reassess the anticipated impact of environmental and ethical factors on business growth; see Cho et al. (2022) and Atkins et al. (2023). Investors evaluate risks and predict returns by analysing non-financial data provided by businesses. Traditional economic theory posits that rational investors, who are limited by their willingness to take risks and financial limitations, select investment portfolios that optimise expected returns (Ackert, 2014; Curcuru et al., 2010). Investors who have specific preferences and modify the original utility function may exhibit a greater willingness to take on risk (Barberis et al., 2006; Rabin & Thaler, 2001) and have more flexible financial constraints when dealing with companies that disclose environmental, social, and governance (ESG) information (Santamaria et al., 2021; Xie et al., 2019).
Literature Review
Firms voluntarily disclose ESG information for a variety of reasons (Darnall et al., 2022). According to legitimacy theory, ESG disclosure is intended to gain social legitimacy for the environmental or social impacts of a company’s operations; see Lokuwaduge and Heenetigala (2017) and Seow (2024). Another factor driving voluntary disclosure is information asymmetry between managers and external investors (Hickman, 2020; Zamil et al., 2023).
The lemon problem stems from a lack of information, which causes good-performing companies to be undervalued and bad-performing companies to be overvalued (Ali, 2020). Socially responsible investment has increased globally, making corporations more likely to disclose ESG information. Corporate information disclosure is at the discretion of managers, who decide how much to disclose in order to value the company in a rational market; see Blankespoor et al. (2020). Ching et al. (2017) reveals no clear correlation between financial performance and sustainability performance, with no association between accounting and market-based variables and reporting quality, despite improving quality disclosure over time. Their study explored ISE listed firms from 2008 to 2014 using a linear regression model. Meanwhile, Shakil et al. (2019) suggest that there is a positive relationship between the environmental and social performance of emerging market banks and their financial performance. However, there is no impact of governance performance on financial performance. Similarly, Xie et al. (2019) find that ESG have a positive impact on corporate financial performance. Among the ESG dimensions, governance disclosure has a more noticeable and strong impact than social and environmental disclosures. Shakil et al. (2019) and Xie et al. (2019) used Difference GMM, system GMM and piecewise linear fitting from 2015 to 2018 for emerging banks and listed firms from United States, Europe, Japan and China, respectively. By studying 22 Asian countries from 2014 to 2018, Melinda and Wardhani (2020) concluded that a firm’s value is impacted by ESG factors (environmental, social and governance), and disclosure is essential for both increased value and sustainability. Transparency and accountability are signalled by the positive relationship between the ESG controversy score and company value. Clearly, the existing literature has suggested ESG having favourable impact on market variables despite some studies showing otherwise. Bahadori et al. (2021) contend that higher ESG scores tend to increase profitability of firms in emerging markets. Their study explored 24 emerging markets from 2014 to 2018 using multiple estimators such as OLS, fixed effects and random effects.
In a different context, Nirino et al. (2021) argue that there is a substantial and adverse link between financial performance and corporate controversies. The beneficial moderating effect of ESG practices on the association between financial performance and controversies, however, could not be verified. Qureshi et al. (2021) analysed firms’ environmental, social, and overall ESG performances of 100 best companies in the United States. Their findings suggest that ESG are fairly good indicators for potential corporate financial performance in the market. These results implies that companies can achieve better financial performance by actively pursuing ESG initiatives. The issue of heterogeneity became apparent from the studies conducted by Bruna et al. (2022) for 350 European listed firms and Chen and Xie (2022) for Chinese listed companies. They concluded that impact of ESG activities on financial performance are considerably heterogeneous and may differ in terms of ESG performance and disclosure. Additionally, ESG disclosure improves corporate financial performance, with a greater impact in companies with ESG investors, longer establishment, high publicity, and high agency costs. Investors with ESG preferences influence the relationship between ESG disclosure and financial performance. Interestingly, Kahloul et al. (2022) reveals a neutral effect of CSR reporting on performance, while a negative effect on ROA, and a positive moderating role of gender diversity on board. While social issues and corporate financial performance (CFP) have a positive relationship in high-innovation companies, but the associations between environmental indicators and CFP are weaker. Governance issues have a negative impact on the CFP. Innovation is the main factor that drives corporate sustainability. Investments in new product development, adherence to environmental laws and corporate decisions about brands and communication channels all have an impact on ESG policies (Doni & Fiameni, 2024).
ESG disclosure can provide firms with a competitive advantage in a rational market. However, previous studies have found mixed relationships between corporate governance plans and ESG disclosure; see, for example, Huang (2021), Qureshi et al. (2021), Alkaraan et al. (2022) and Doni and Fiameni (2024). Environmental disclosure can lead to precise earnings forecasts, while governance disclosure benefits principals. Larger firms with more stringent disclosure regimes employ more capable managers, leading to better financial performance. ESG transparency boosts firm value and market valuation. Previous studies have rarely investigated the linear relationship between corporate efficiency and ESG disclosure (Bofinger et al., 2022; Bruna et al., 2022; Ellili, 2022). ESG activities, including managerial discretion and compulsory obligations, have a significant impact on corporate financial performance (Chen & Xie, 2022; Nirino et al., 2021). Traditional views suggest environmental regulations reduce profitability and efficiency, while the Porter hypothesis suggests that stringent, flexible regulations can stimulate innovation and generate more revenue (Fabrizi et al., 2024; D. Zhang, 2021). However, the effectiveness of environmental regulations and the potential for firms to merely conform to policies without actual efforts to pursue them remain uncertain (Aragòn-Correa et al., 2020; Qiu et al., 2020). In high growth industries, positive links between environmental performance and profitability are strengthened; see Noordewier and Lucas (2020). Social activities, such as corporate charitable giving, can have a long-term positive effect on financial performance but also bring additional costs (Barauskaite & Streimikiene, 2021; DesJardine & Durand, 2020). Governance activities, such as board structure and gender diversity, have been found to positively impact corporate financial performance (Hosny & Elgharbawy, 2022; Kahloul et al., 2022).
Upon careful review of relevant and related studies, a notable gap was identified and this present study aims to fill it. The gaps ranging from scope of study (Europe, the Middle East, Africa and Latin America) to variables (institutional effectiveness, macroeconomic conditions and stability, and the interaction effect of ESG and leverage) and methodology (Cross-sectional heterogeneity, cross-sectional dependence and distributional effects) have been identified. For this reason, we aim to investigate the relationship between ESG indicators and corporate financial performance, with a focus on resolving econometric issues such as cross-sectional dependence, cross-sectional heterogeneity, and distributional effects while accounting for endogeneity.
Empirical Strategy
Empirical Model
We follow Atan et al. (2018), Bahadori et al. (2021) and Chen and Xie (2022) to build our empirical model and, by extension, include other institutional effectiveness variables such as corruption control and regulatory quality, which are scant in the ESG-corporate financial performance literature. We assume that corporate financial performance is a function of environmental, social and governance (ESG) indicators and other potential ESG and corporate financial performance determinants. We express this equation as:

Where Z denotes potential determinants of corporate financial performance and ESG indicators for firm

where
Our model, incorporating return on assets (ROA) and return on equity (ROE) as dependent variables with ESG disclosure and performance indicators as independent variables, provides a comprehensive financial performance assessment. This approach captures the holistic impact of sustainability practices on financial outcomes, allowing stakeholders to understand the broader implications of ESG initiatives on corporate value creation. ROA and ROE are widely used financial performance metrics that provide insights into a company’s profitability and efficiency; see Shakil et al. (2019), Melinda and Wardhani (2020), Bahadori et al. (2021), Chen and Xie (2022) among many others. Control variables such as rule of law, regulatory quality, government effectiveness, corruption control and consumer price index account for external factors that may influence financial performance independently of ESG indicators. Institutional effectiveness variables function as important control variables when examining the relationship between ESG indicators and financial performance. They help to reduce the impact of external factors, consider regulatory environments, manage operational risks, address stakeholder trust, account for contextual differences and improve the reliability of the model; see Nirino et al. (2021) and Gebhardt et al. (2023). Incorporating these variables into the analysis allows for a more thorough evaluation of how environmental, social, and governance (ESG) practices affect financial performance within the larger institutional framework. Additionally, including the consumer price index as a control variable in a model that investigates the relationship between ESG indicators and financial performance allows for the consideration of inflationary impacts, macroeconomic stability, consumer behaviour, nominal versus real financial performance, and enables comparisons across different countries or time periods (Barattieri et al., 2021; Palmieri et al., 2024). This model also provides insights into the financial market response to sustainability initiatives and practices, enabling investors, regulators and policymakers to promote sustainable investment practices (Chen & Xie, 2022; A. C. Ng & Rezaee, 2015).
Econometric Methods
This section sets out the empirical methods adopted in this paper. We seek to operationalise Equation 2 as a profitability regression to examine the importance of ESG indicators for corporate financial performance. This model assumes parameter homogeneity and cross-section independence of stochastic error. These include parameter heterogeneity, spillovers and endogeneity. We seek to account for these in what follows. Firstly, we test for firm homogeneity in the
Panel Cross Sectional Dependency Test
If cross-sectional errors are not independent, and when cross-sectional unit interdependence is ignored, the error term in a regression exhibits cross-sectional dependence. The correlation between units violates the fundamental OLS assumption that the error term is independent and identically distributed (see Chudik & Pesaran, 2013, 2015). Cross-sectional dependence in the error term can lead to omitted variable bias or endogeneity, resulting in estimation inconsistencies; see also Pesaran (2015). Cross-sectional dependence can be calculated using the correlation between units. For example, unit
According to Ditzen (2021), the magnitude of common factors can be quantified by a constant ranging from 0 to 1, known as the exponent of cross-sectional dependence. Chudik et al. (2011) categorise CD into four types based on its limiting behaviour: strong
Panel Slope Heterogeneity
We also seek to account for parameter heterogeneity in our empirical modelling. Pesaran and Yamagata (2008) proposed the test for slope heterogeneity, which standardises Swamey’s test for slope homogeneity under the assumption that all slope coefficients across cross-sectional units are identical. However, if the homogeneous assumption is present in the proposed model, the test for slope heterogeneity appears to be reliable but may produce inefficient estimates. In contrast, if the proposed model contains slope heterogeneity, the homogeneous assumption may also result in biased and inconsistent estimates. In this context, the test for slope heterogeneity performs plausible and implicit estimates for the two hypotheses and compares them to determine the best option. Given that the unrestricted model relies on a cross-sectional unit-specific OLS regression model, that is, the model under the alternative assumption and the restricted model relies on a weighted fixed effects method that supports the homogeneous slope. The test is predicated on the disparity between the two models. The null hypothesis of slope homogeneity can be rejected when the test statistic has a high p-value, which means that estimates of fixed effects and estimates of unit-specific effects are not consistent with each other.
Panel Unit Root Tests
We test for unit root in the series used in modelling the relationship between ESG indicators and corporate financial performance with the Fisher unit root test. Fisher-type tests are statistical methods used in meta-analysis to determine the presence of unit roots in panel data. The tests are run on each panel separately before aggregating the p-values to produce an overall test result. The Fisher unit root function supports ADF and Phillips-Perron tests. It does not require the use of strongly balanced data. These tests assume that
Panel Generalised Quantile Regression IV Method
We formulate a simplified model for our panel generalised quantile regression as follows:

Where
Powell (2020) developed the generalised quantile regression estimator. The generalised quantile estimator solves a key issue presented by conventional quantile estimators: the incorporation of more covariates changes the meaning of the estimated coefficient on the treatment variable. Powell (2020) explains that the generalised quantile estimator effectively deals with this issue by generating unconditional quantile treatment effects, even when additional control variables are present. Quantile regression with panel data is a specific instance of generalised quantile regression, as discussed in Powell (2022). To address endogeneity, which may introduce bias to the estimated coefficients, Powell (2020) recommends including all exogenous and explanatory variables as well as any additional instrumental variables in the model; see also Chernozhukov and Hansen (2008). Generalised Quantile Regression (GQR) is an extension of linear regression that estimates quantiles of the conditional distribution of a response variable. It offers several advantages, including robustness to outliers, comprehensive distribution information, handling skewed distributions, flexibility in modelling, inference across the distribution and effective handling of heteroscedasticity. GQR is less sensitive to extreme values and can capture the conditional distribution of the dependent variable at various quantiles, providing a more nuanced analysis. It also allows for inference across the distribution and captures heteroscedasticity more effectively than traditional regression models. Overall, GQR offers a more comprehensive and robust analysis of the conditional distribution of the response variable.
Common Correlated Effect Mean Group Estimator
Following Chudik et al. (2013) and Ditzen (2021), we formulate the panel model with heterogeneous coefficients below:

where
The omission of the common factor in Equation 4 results in an omitted variable bias, which in turn causes ordinary least squares estimation to become inconsistent, see Everaert and De Groote (2016). Pesaran (2006) and Chudik and Pesaran (2015) have developed the mean group estimator that aims to consistently estimate Equation 4 by employing cross-sectional averages as an approximation for the common factors. The cross-sectional averages are augmented with a lagged floor of
Data
This section sets out the data used in our study. The key variable of interest when examining the impact of environmental, social, and governance factors on the financial performance of 249 public companies in Europe, the Middle East, Africa (EMEA) and Latin America from 2010 to 2020. The data were obtained from MSCI, World Development Indicators (World Bank) and Worldwide Governance Indicators (World Bank) data, originally compiled by Eremina (2021). Supplemental Table A1 in the Appendix describes the variables used in the study.
Results
Descriptive Statistics
The descriptive statistics of our selected variables for the study are presented in Table 1. Evidence from the table with respect to the dependent variables, indicates that return on assets had the least average value of 0.06 with a standard deviation of 0.09 whereas return on equity had a mean value of 0.13 and standard deviation of 0.23. This implies that over the sample period the sampled firms have had higher fluctuations in their return on equity more than their return on assets. Information on the ESG variables indicate that ESG performance outweighs ESG disclosure on the average, but the standard deviation values suggest that ESG performance has not been consistent with higher fluctuations over ESG disclosure. This suggests that while firms may have more stable returns on assets and prioritise ESG performance over disclosure, there are fluctuations and inconsistencies in both ROE and ESG performance that need to be considered for a comprehensive analysis.
Descriptive statistics.

Note. ROE it = return on equity; ROA it = return on assets; ESGDit = ESG disclosure; ESGPit = ESG performance; EDit = environmental disclosure; EPit = environmental performance; SDit = social disclosure; SP it = social performance; GDit = governance disclosure; GPit = governance performance; SSit = social sensitivity; ESit = environmental sensitivity; LAit = log of total assets; DA it = total debt to total asset ratio; RLit = rule of law; GE it = government effectiveness; CCit = corruption control; RQ it = regulatory quality; CPI it = consumer price index.
Pre-Diagnostic Tests
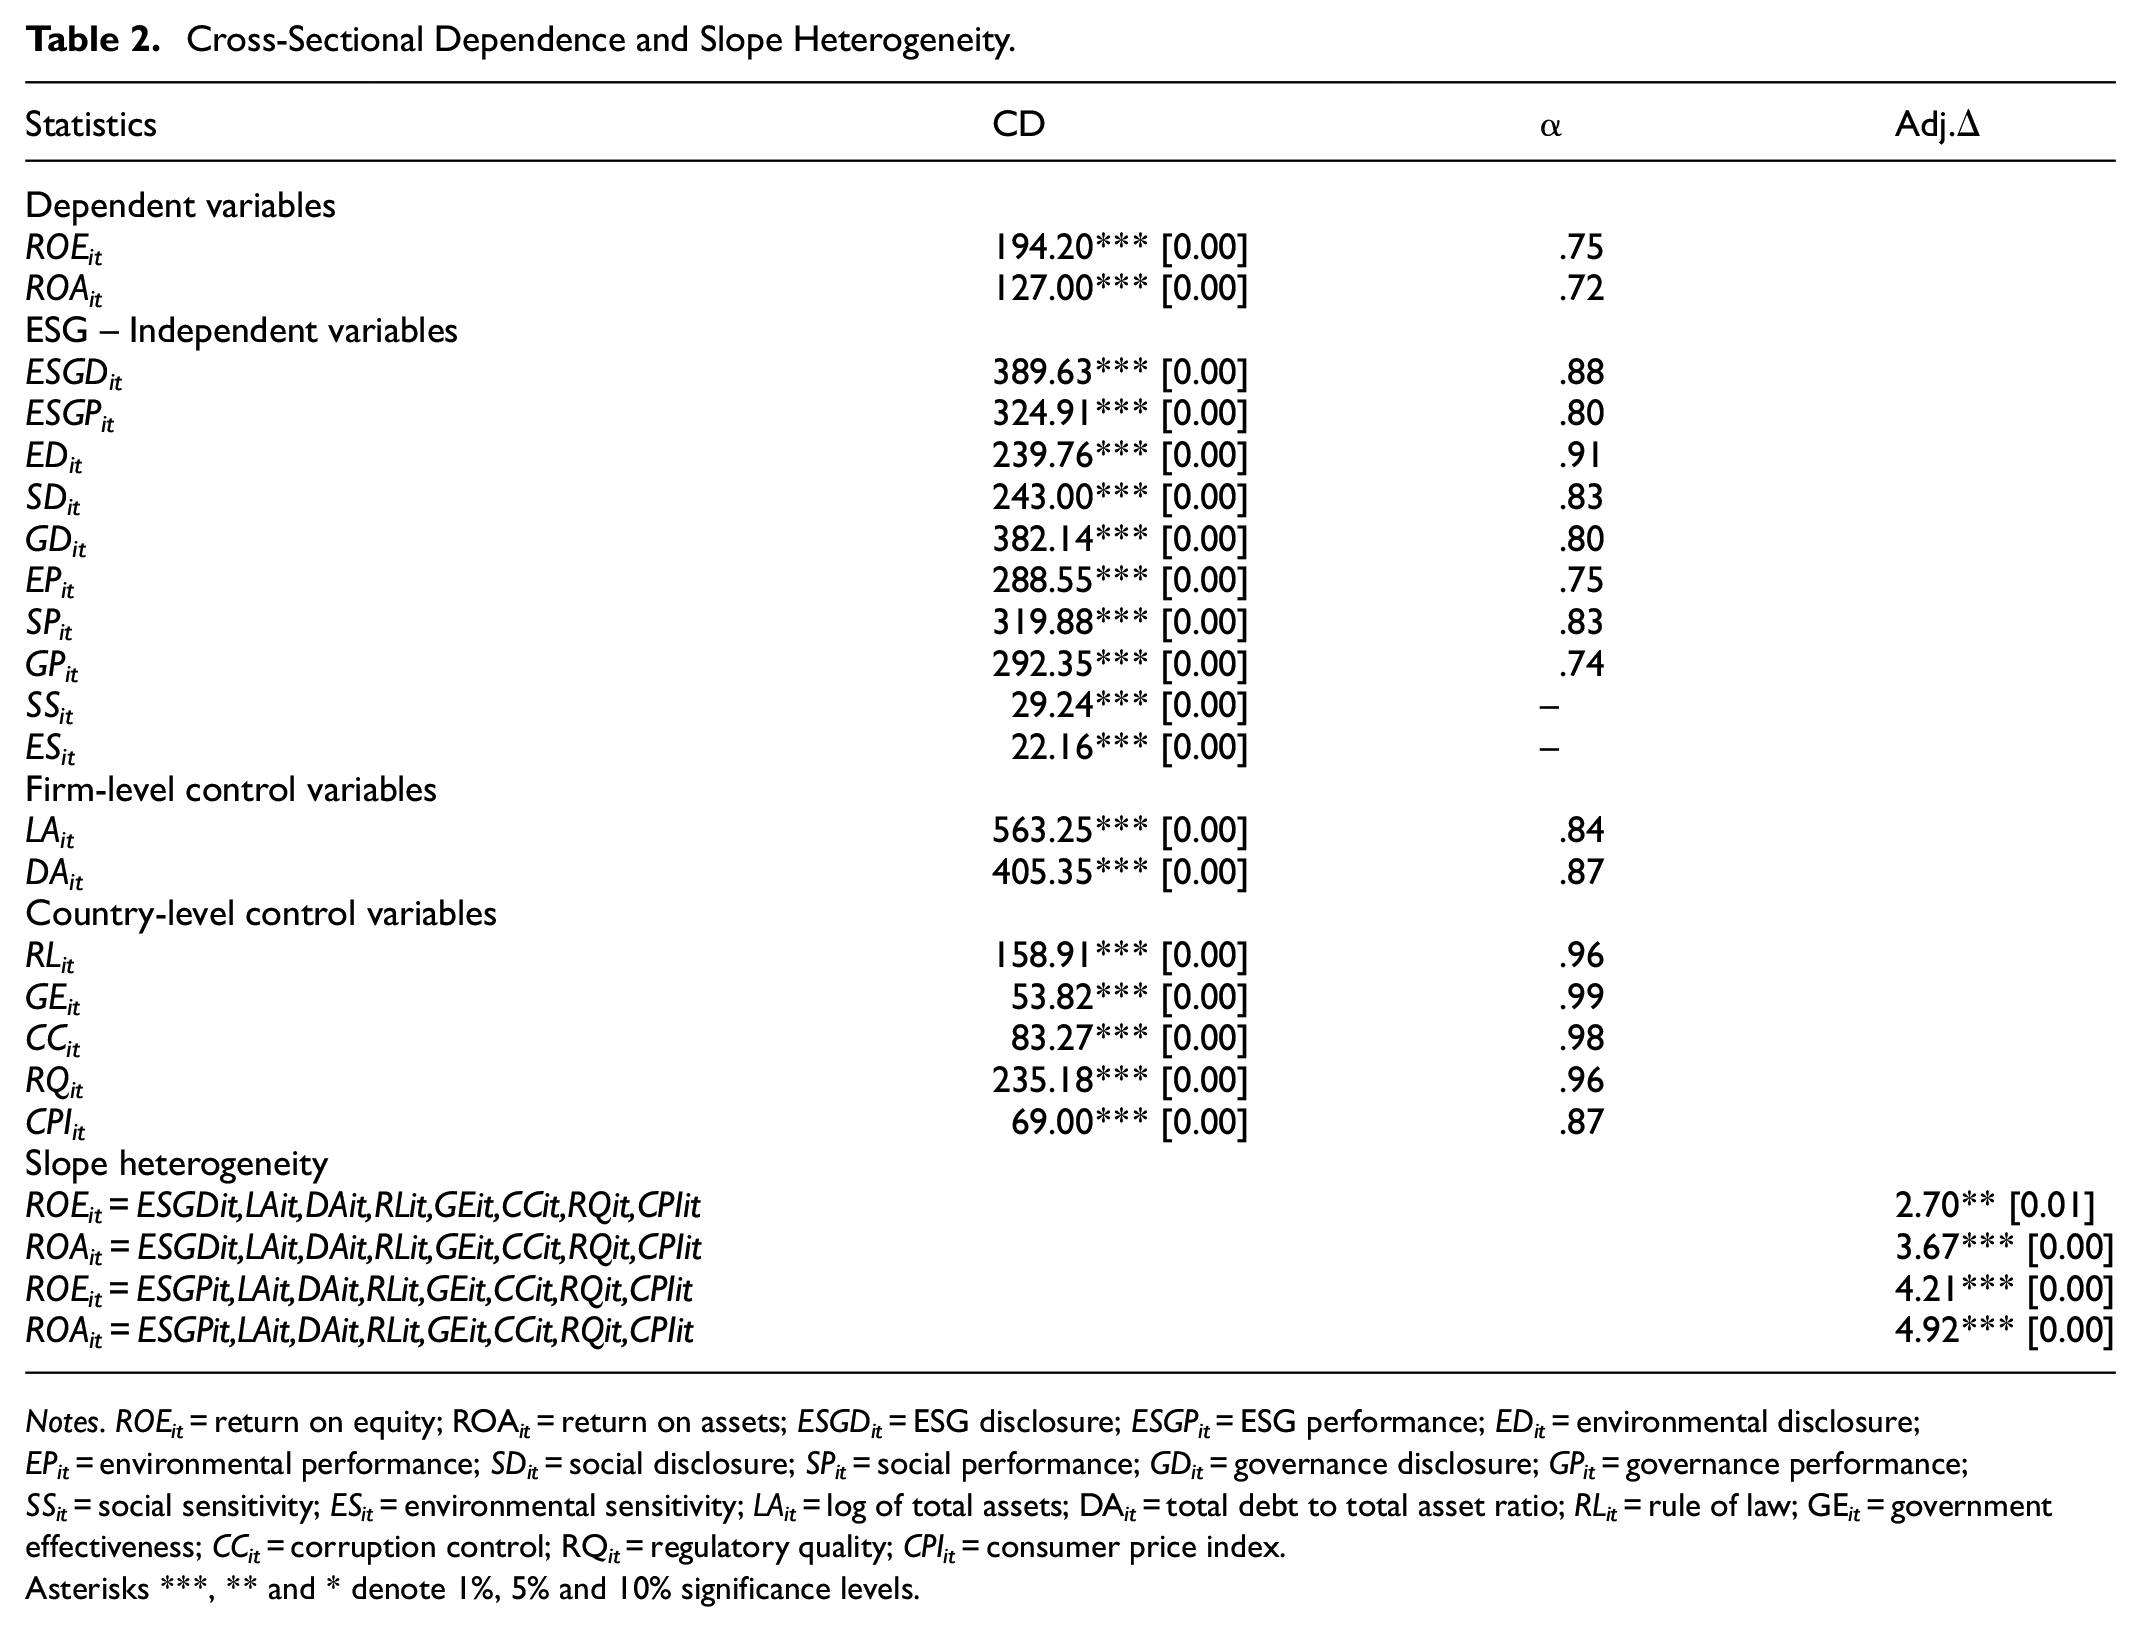
In the initial stage, we assessed the presence of cross-sectional dependency (CD) and slope heterogeneity within our sample. If the test statistic (α) exceeds 0.5 and the CD statistics show significance with a p-value < .05, the null hypothesis is rejected. This indicates cross-sectional dependence; see Pesaran (2015, 2021). Our results in Table 2 for the full sample indicate that α exceeds .5 for all series, hence there is semi-strong and strong cross-sectional dependence.
Cross-Sectional Dependence and Slope Heterogeneity.
Notes. ROEit = return on equity; ROA it = return on assets; ESGDit = ESG disclosure; ESGPit = ESG performance; EDit = environmental disclosure; EPit = environmental performance; SDit = social disclosure; SPit = social performance; GDit = governance disclosure; GPit = governance performance; SSit = social sensitivity; ESit = environmental sensitivity; LAit = log of total assets; DA it = total debt to total asset ratio; RLit = rule of law; GE it = government effectiveness; CCit = corruption control; RQ it = regulatory quality; CPIit = consumer price index.
Asterisks ***, ** and * denote 1%, 5% and 10% significance levels.
The identified cross-sectional dependencies necessitate the use of econometric techniques that can produce accurate results even in the presence of such dependencies. It was observed that the parameters depicted slope heterogeneity for all the proposed models; see Table 2. Using Choi (2001) unit root tests, we observed that all the panel time series are stationary. That is, we are able to reject the null hypothesis of panel unit root against an alternative of no panel unit root at 1% statistical significance level. We can therefore assume that our data is stationary and will not be susceptible to a spurious regression problem. The results are presented in Table 3.
Panel Unit Root Tests.

Note. ROEit = return on equity; ROAit = return on assets; ESGDit = ESG disclosure; ESGPit = ESG performance; EDit = environmental disclosure; EPit = environmental performance; SDit = social disclosure; SPit = social performance; GDit = governance disclosure; GPit = governance performance; SSit = social sensitivity; ESit = Environmental sensitivity; LAit = log of total assets; DA it = total debt to total asset ratio; RLit = rule of law; GE it = government effectiveness; CCit = corruption control; RQ it = regulatory quality; CPIit = consumer price index; P = inverse ch2, Z = inverse normal; L* = inverse logit; Pm = modified inverse ch2 ADF fisher type unit root tests by Choi (2001).
Asterisks ***, ** and * denote 1%, 5% and 10% significance levels.
Long-Run Estimations
Benchmark Model: Return on Equity as Dependent Variable
We begin our long run estimations by first looking at the overall environmental, social and governance (ESG) disclosure (ESGDit) and performance (ESGPit) indexes impact on corporate financial performance as measured by return on equity (ROEit) and return on asset (ROAit), respectively. We denote these estimations as our benchmark models and are presented in Table 4 for the ESG disclosure index and Table 5 for ESG performance index. The rationale behind this approach to understand the right measure of ESG and its association with corporate financial performance. We assess these relationships with a panel generalised quantile regression instrumental variable estimator. Here, we aim to understand the distributional effect of corporate financial performance taking into account cross-sectional heterogeneity and endogeneity issues. As shown in Table 4, it is evident that ESGDit exhibited a significant relationship with ROEit for the 95th quantile only. This implies that from the 10th quantile to the 90th quantile of firms’ returns on equity, ESG disclosure is not likely to have a significant impact on their financial performance and perhaps firms with higher return on equity as the top performers are likely to experience significant impact of ESG disclosure. This is apparent while controlling for firm size (LAit), leverage (DAit), regulatory quality (RQit), government effectiveness (GEit), rule of law (RLit), corruption control (CCit), and consumer price index (CPIit) as a measure of country-level macroeconomic stability.
Benchmark Model: ESG Disclosure and Return on Equity.

Note. ROEit = return on equity; ESGDit = ESG disclosure; LAit = log of total assets; DA it = total debt to total asset ratio; RLit = rule of law; GE it = government effectiveness; CCit = corruption control; RQ it = regulatory quality; CPIit = consumer price index.
Asterisks ***, ** and * denote 1%, 5% and 10% significance levels. q10–q95 represent 10th to 95th quantiles.
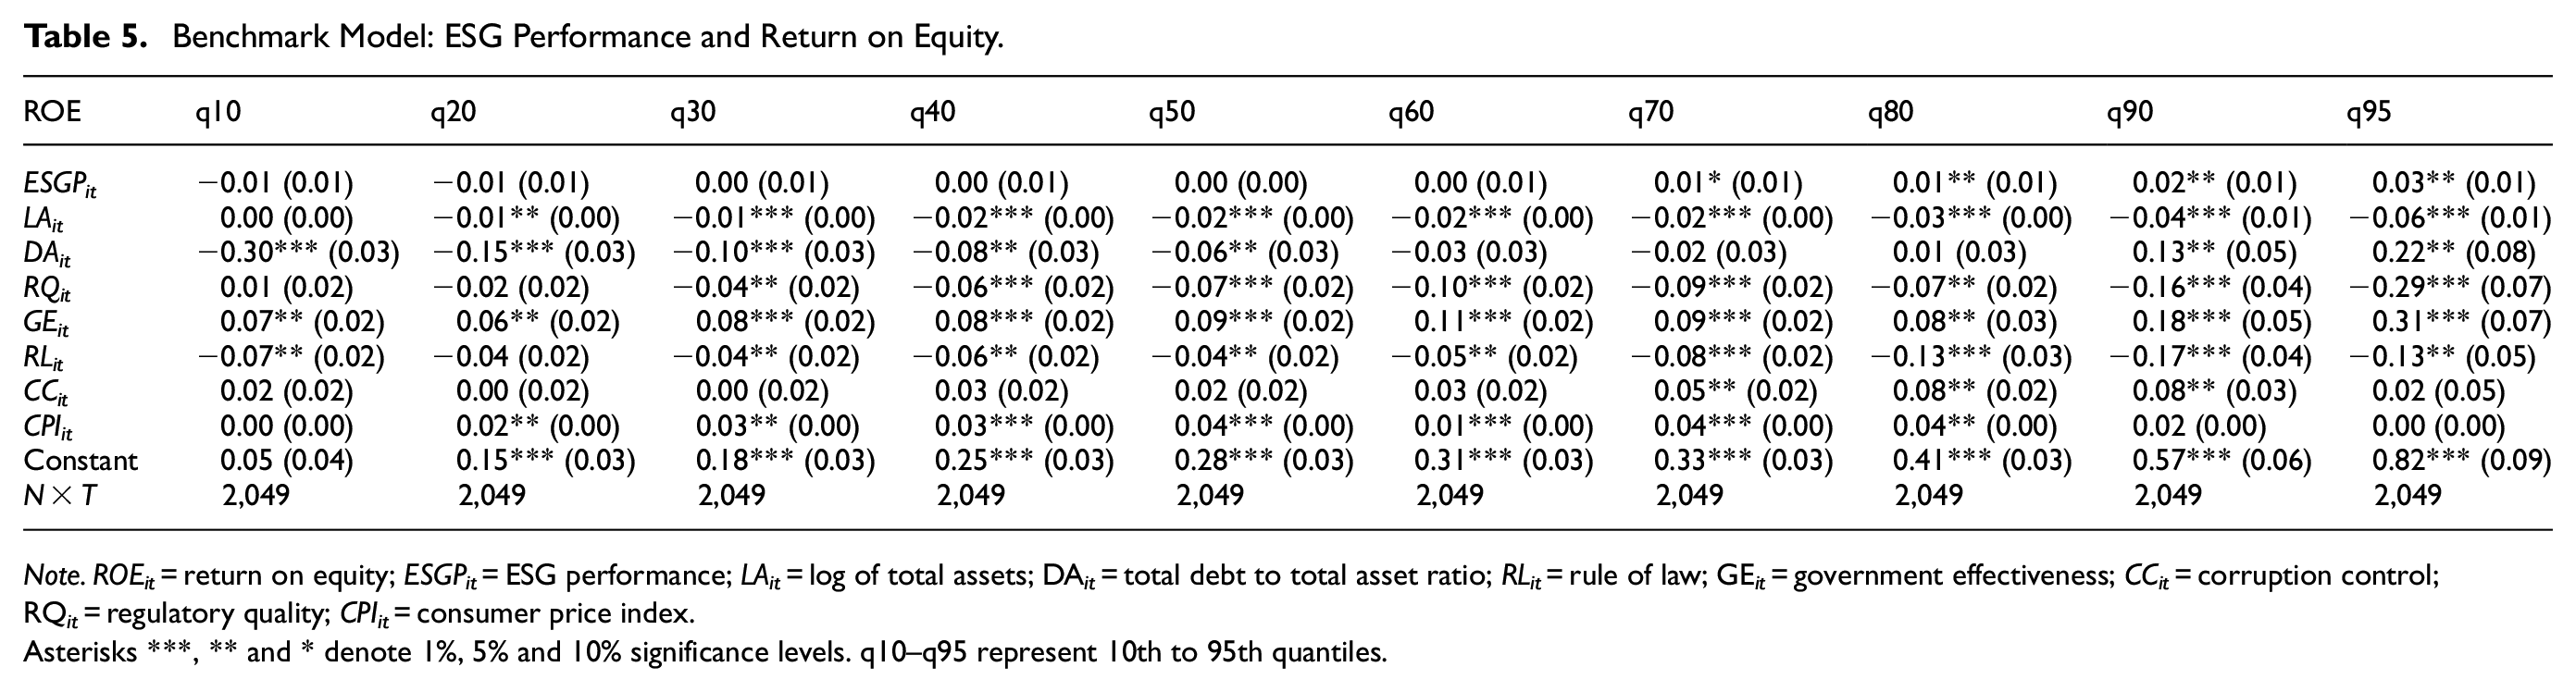
Benchmark Model: ESG Performance and Return on Equity.
Note. ROEit = return on equity; ESGPit = ESG performance; LAit = log of total assets; DA it = total debt to total asset ratio; RLit = rule of law; GE it = government effectiveness; CCit = corruption control; RQ it = regulatory quality; CPIit = consumer price index.
Asterisks ***, ** and * denote 1%, 5% and 10% significance levels. q10–q95 represent 10th to 95th quantiles.
Subsequently, we replace ESG performance index (ESGPit) with ESG disclosure index (ESGDit) as depicted in Table 5. The findings from this approach suggest that ESGPit has an important, positive, and significant relationship with ROEit from the 70th quantile to the 95th quantile. We find strong evidence with the ESG performance index more than the ESG disclosure despite all of them suggesting that higher performing firms tend to experience positive impact of ESG policies. Numerous studies have documented a positive and significant relationship between ESG activities and return on equity; the findings suggest heterogeneous effect as firms with longer age of establishment, high media publicity, higher agency cost and higher level of innovation are more likely to experience this effect (Bruna et al., 2022; Chen & Xie, 2022). Could the relationship between ESG indicators and corporate financial performance be contingent on the measure of financial performance? In the next section, we delve into this phenomenon considering return on asset as the dependent variable.
Benchmark Model: Return on Assets as Dependent Variable
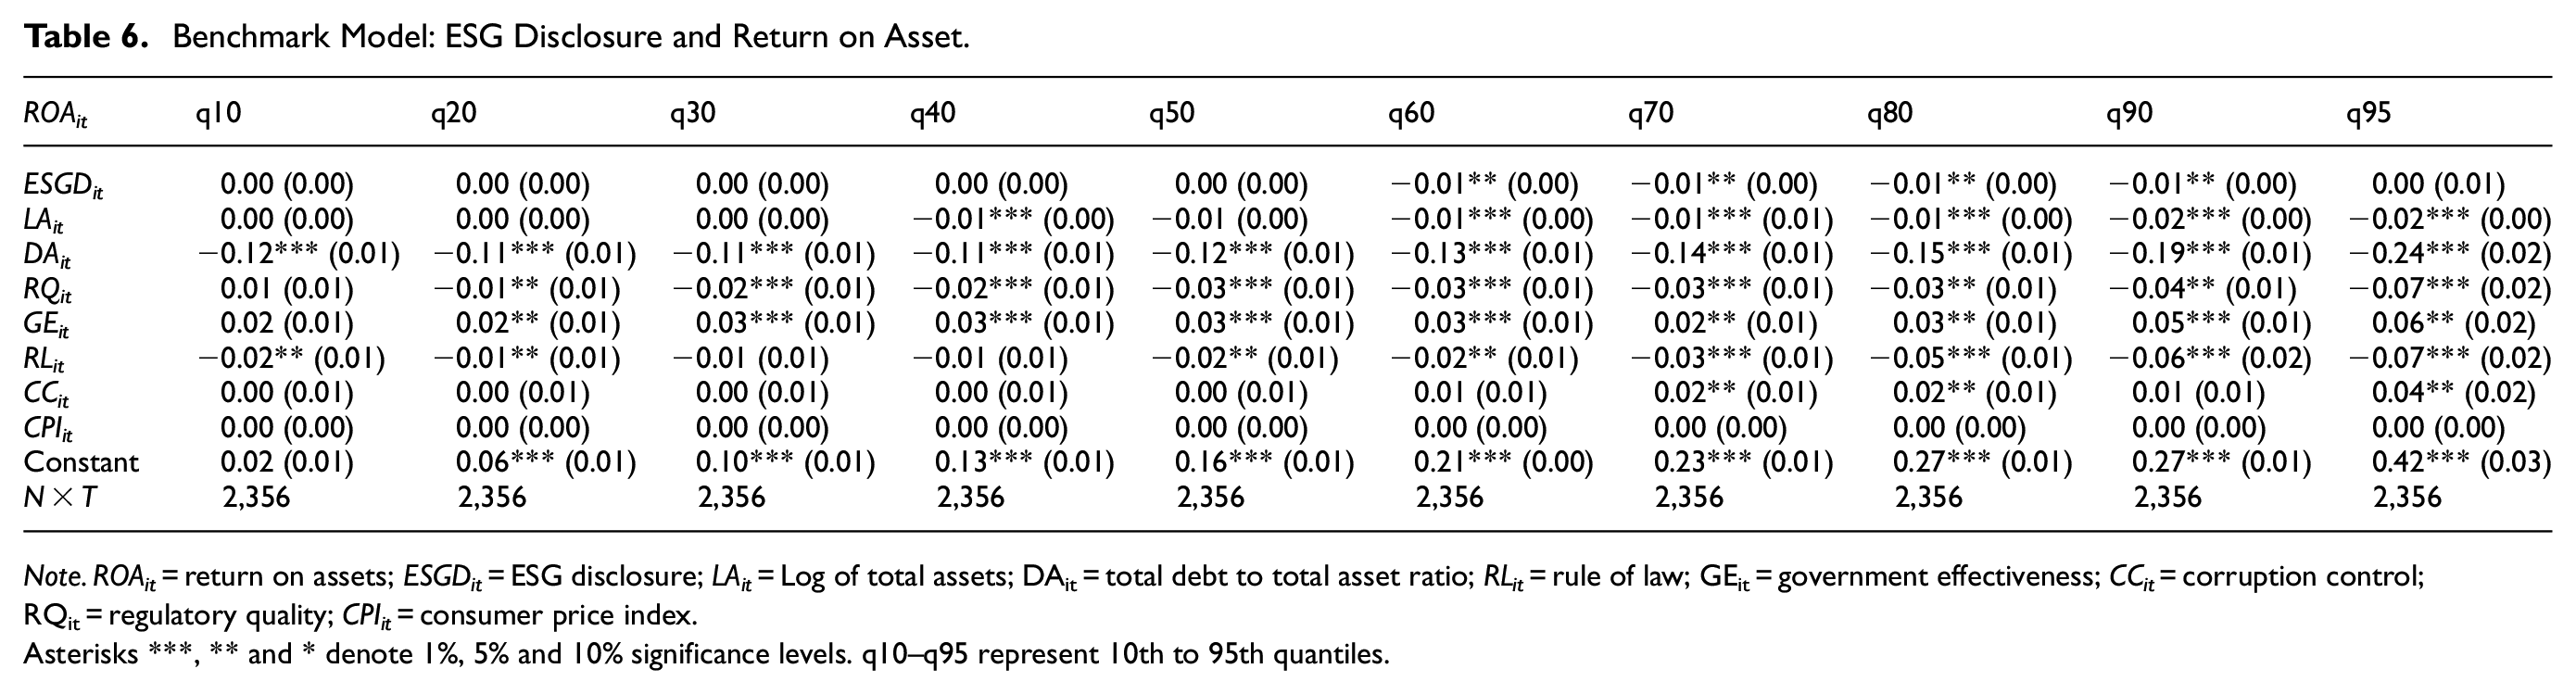
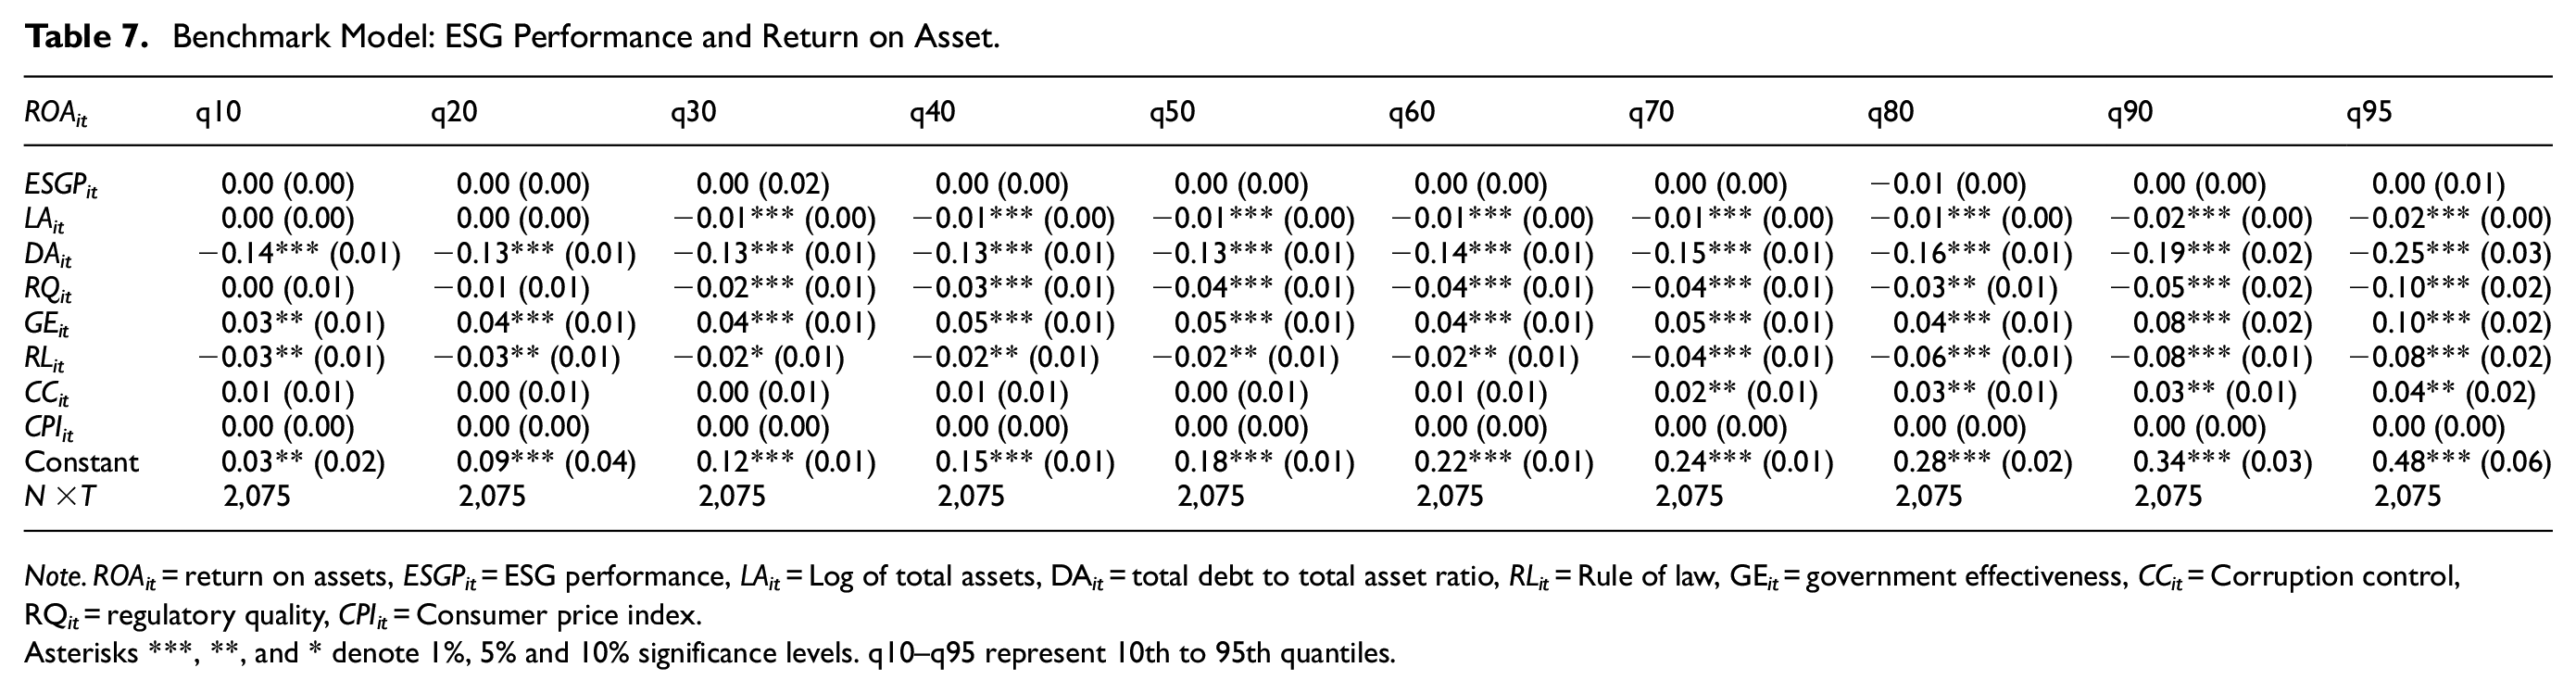
We look at measuring corporate financial performance with return on asset (ROAit) instead of return on equity (ROEit) to comprehend the dynamics with ESG disclosure and performance indexes. The outcome of the findings is presented in Table 6 for ESG disclosure (ESGDit) and Table 7 for ESG performance (ESGPit). Our evidence suggests that ESGDit has a negative and significant relationship with ROAit whereas ESGPit has an insignificant relationship with ROAit. Given that from the 10th quantile to the 95th quantile, environmental, social and governance performance exhibited insignificant coefficients throughout. We observed that from the 60th quantile to the 90th quantile, environmental, social and governance disclosure is likely to have a negative impact on return on asset. This implies that firms with higher return of asset are more likely to experience negative impact of their environmental, social and governance policies’ disclosure while the performance of these policies do not matter for their return on assets. Kahloul et al. (2022) argues that ESG disclosure is strongly associated with return on assets and could perhaps be linked with the trade-off hypothesis. We further find that return on assets is socially sensitive than environmentally. Moreover, firms in the lower quantile are more likely to benefit from corporate social responsibility than those in the upper quantile in support of Nirino et al. (2021); see Supplemental Tables A8 and A9, respectively.
Benchmark Model: ESG Disclosure and Return on Asset.
Note. ROAit = return on assets; ESGDit = ESG disclosure; LAit = Log of total assets; DAit = total debt to total asset ratio; RLit = rule of law; GEit = government effectiveness; CCit = corruption control; RQit = regulatory quality; CPIit = consumer price index.
Asterisks ***, ** and * denote 1%, 5% and 10% significance levels. q10–q95 represent 10th to 95th quantiles.
Benchmark Model: ESG Performance and Return on Asset.
Note. ROAit = return on assets, ESGPit = ESG performance, LAit = Log of total assets, DA it = total debt to total asset ratio, RLit = Rule of law, GE it = government effectiveness, CCit = Corruption control, RQ it = regulatory quality, CPIit = Consumer price index.
Asterisks ***, **, and * denote 1%, 5% and 10% significance levels. q10–q95 represent 10th to 95th quantiles.
Specifically, firms with return on assets in the 10th to 50th quantiles are more prone to positive impact of social sensitivity. This implies that corporate social responsibility is enabler of lower performing firms and perhaps if they intend to improve on their financial performances then they ought to be socially responsible with their stakeholders. All this evidence is apparent while controlling for firm size (LAit), leverage (DAit), regulatory quality (RQit), government effectiveness (GEit), rule of law (RLit), corruption control (CCit), and consumer price index (CPIit) as a measure of country-level macroeconomic stability.
Benchmark Model: Decomposition of ESG Index
We now turn to decomposing the ESG disclosure and performance indexes into their individual dimensions, that is, environmental, social and governance indicators for both disclosure and performance. The findings are presented in Supplemental Table A2 for environmental disclosure, Supplemental Table A3 for environmental performance, Supplemental Table A4 for social disclosure, Supplemental Table A5 for social performance, Supplemental Table A6 for governance disclosure and Supplemental Table A7 for governance performance as presented in the Supplemental Appendix.
The outcome of these findings suggests that firms with higher return on equity are more likely to experience positive impact of environmental, social and governance disclosure as well as performance. In particular, we find that from the 80th quantile to the 95th quantile, environmental disclosure is likely to have a positive and significant impact on return on equity. This implies that high financial performing firms could potentially increase their return on equity even further if they intend to improve their environmental policy disclosure. Similarly, we also find that an increase in environmental performance measures is likely to increase the return on equity of high performing firms in the 70th to 95th quantiles. In addition, social disclosure and performance tends to benefit high performing firms than low performing ones. As we find that from the 80th to the 95th quantiles for both social disclosure and social performance, an increase in these indicators could potentially increase the return on equity of firms in that quantile. The evidence observed for environmental and social indicators differ somewhat as we only find a positive and significant relationship for both governance disclosure and performance with return on equity in the 95th quantile. Despite small variations of the decomposed measures of ESG and their impact on return on equity, we find strong evidence that environmental, social and governance disclosure and performance could likely improve the financial performance of high performing firms which is similar to what we observed for the overall ESG indexes, as presented in Tables 4 and 5 shown in section 5.3.1.
Similarly, Shakil et al. (2019) found that there is a positive relationship between the environmental and social performance of emerging market banks and their financial performance. However, there is no impact of governance performance on financial performance. Contrary to this argument, Doni and Fiameni (2024) also document that social indicators and corporate financial performance have a positive relationship in high-innovation companies, but the associations between environmental indicators and corporate financial performance are weaker. On the other hand, governance indicators may likely have a negative impact on corporate financial performance. In view of these arguments, there is consistency with our findings that social and environmental indicators have a positive impact on corporate financial performance.
Extended Model: Interaction Effect of ESG Indicators and Corporate Leverage
Here, we extend our benchmark model by including the interaction effect of ESG indicators and corporate leverage (debt to asset ratio) and consequently assessing its relationship with return on equity and return on asset alongside the overall measure of ESG disclosure and performance. Understanding the interaction effect between ESG indicators and the debt-to-asset ratio is critical for holistic risk assessment, assessing financial performance drivers and ensuring regulatory compliance in an increasingly complex business environment. The findings are presented in Tables 8 to 11. We find that the interaction effect between a company’s debt-to-asset ratio and its ESG (Environmental, Social, and Governance) indicators can have a positive impact on return on equity (ROE) and return on assets (ROA). It is evident that only high-performing firms are likely to experience the positive impact of the interaction between leverage and ESG indicators. Meanwhile, it is more likely that the overall ESG indicator – both disclosure and performance – could have an adverse impact on the financial performance of high-performing firms. Moreover, the impact on return on equity is more pronounced than the impact on return on asset. Conversely, it’s important to note that the direct impact of ESG indicators on return on equity may be negative due to short-term costs associated with implementing sustainable. The interaction between debt-to-asset ratio and ESG indicators can positively impact a company’s return on equity (ROE) and return on assets (ROA). This is due to risk mitigation, lower cost of capital, increased stakeholder trust and increased innovation and efficiency; see Nirino et al. (2021). High debt-to-asset ratios may signal financial risk, but when combined with strong ESG indicators, they can enhance financial performance by mitigating risks, lowering capital costs, building stakeholder trust and driving innovation and efficiency; see, for example Economidou et al. (2023) and Alves and Meneses (2024). The long-term benefits of sustainable practices, especially when combined with efficient financial management.
Interaction Effect of ESG Disclosure and Leverage: Return on Equity.

Note. ROEit = return on equity; ESGDit = ESG disclosure; ESGD∗DA it = interaction between ESG disclosure and leverage; LAit = log of total assets; DA it = total debt to total asset ratio; RLit = rule of law; GE it = government effectiveness; CCit = corruption control; RQ it = regulatory quality; CPIit = consumer price index.
Asterisks ***, **, and * denote 1%, 5% and 10% significance levels. q10–q95 represent 10th to 95th quantiles.
Interaction Effect of ESG Performance and Leverage: Return on Equity.

Note. ROEit = return on equity; ESGPit = ESG performance; ESGP × DA it = interaction between ESG performance and leverage; LAit = log of total assets; DA it = total debt to total asset ratio; RLit = rule of law; GE it = government effectiveness; CCit = corruption control; RQ it = regulatory quality; CPIit = consumer price index.
Asterisks ***, ** and * denote 1%, 5% and 10% significance levels. q10–q95 represent 10th to 95th quantiles.
Interaction Effect of ESG Disclosure and Leverage: Return on Assets.

Note. ROAit = return on assets; ESGDit = ESG disclosure; ESGD × DA it = interaction between ESG disclosure and leverage; LAit = log of total assets; DA it = total debt to total asset ratio; RLit = rule of law; GE it = government effectiveness; CCit = corruption control; RQ it = regulatory quality; CPIit = consumer price index.
Asterisks ***, ** and * denote 1%, 5% and 10% significance levels. q10–q95 represent 10th to 95th quantiles.
Interaction Effect of ESG Performance and Leverage: Return on Assets.

Note. ROAit = return on assets; ESGPit = ESG performance; ESGP × DA it = interaction between ESG performance and leverage; LAit = log of total assets; DA it = total debt to total asset ratio; RLit = rule of law; GE it = government effectiveness; CC it = Corruption control; RQ it = regulatory quality; CPIit = consumer price index.
Asterisks ***, ** and * denote 1%, 5% and 10% significance levels. q10–q95 represent 10th to 95th quantiles.
Robustness: Addressing Cross-Sectional Dependence
In order to ensure the reliability of our results, we utilise an additional estimator that is capable of addressing the issue of cross-sectional dependence. This is important because our benchmark estimator, the panel generalised quantile regression estimator, has statistical properties that allow it to handle endogeneity and cross-sectional heterogeneity- but not cross-sectional dependence as our pretest suggests that the series used in this study have cross-sectional dependence; see Table 2. If this is avoided, our findings may be biased due to the presence of unobserved common factors that could cause omitted variable bias. Therefore, we use the common correlated effect mean group estimator for robustness checks to understand whether our findings are sensitive to cross-sectional dependence. The findings are presented in Table 12. Column 1 and 2 for Table 12 account for the overall ESG disclosure and performance indexes, respectively whereas column 3 and 4 includes the interaction effects of ESG disclosure and performance with leverage, respectively.
Common Correlated Effect Mean Group.

Note. ROEit = return on equity; ROA it = return on assets; ESGDit = ESG disclosure; ESGD × DA it = interaction between ESG disclosure and leverage; ESGPit = ESG performance; ESGP × DA it = interaction between ESG performance and leverage; LAit = log of total assets; DA it = total debt to total asset ratio; RLit = Rule of law; GE it = government effectiveness; CCit = corruption control; RQ it = regulatory quality; CPIit = consumer price index.
Asterisks ***, ** and * denote 1%, 5% and 10% significance levels. p-Value > .05 for the CD stat suggests no or weak cross-sectional dependence. p-Value < .05 for the F-stat suggests model fit to goodness.
Our evidence suggests that ESG disclosure has a positive and significant impact on return on equity but does not have a similar impact on return on assets. Even with the inclusion of the interaction effect, we still could not find a substantial relationship. Moreover, with the inclusion of the interaction effect to assess the relationship between ESG indicators on return on equity, we could not find any important and substantial impact. We assume that the relationship between ESG indicators and financial performance may be sensitive to outliers and heteroscedasticity as well as endogeneity which the common correlated effect mean group may not be capable of handling. Moreover, the distribution may be skewed, and perhaps extreme values could be captured based on the conditional distribution of return on equity and return on assets at different quantiles to provide a more perspective analysis.
In order not to bias our estimations due to cross-sectional dependence, we follow Ditzen and Reese (2023) and Ditzen (2021) to estimate the unobserved common factors and include them in the respective models by applying the panel generalised quantile regression estimator. We present these findings in Supplemental Tables A10 to A17.
Based on the findings, it is important to emphasise that, overall, ESG is a substantial driver of corporate financial performance. Here, we observed that the impact of ESG on the return on assets of low-performing firms is substantial and positive when the interaction between ESG disclosure and leverage is accounted for. Despite the positive impact of ESG disclosure on the return on assets of firms in the lower quantiles, specifically 10th to 30th, the interaction effect was negative and substantial. Meanwhile, we observed negative coefficients of ESG disclosure with return on assets from the 70th quantile to the 95th quantile. By contrast, the interaction effect showed positive and significant coefficients for return on assets. Similarly, we observed positive coefficients of the direct impact of ESG performance on return on equity, whereas the interaction effect with leverage showed negative coefficients from the 10th quantile to the 60th quantile. Most often, the immediate effect of ESG indicators on financial performance could be adverse because of the immediate expenses linked to adopting sustainable practices or meeting regulatory requirements (T.-H. Ng et al., 2020; Singhania & Saini, 2023). The adverse consequences of sustainable practices can be counterbalanced by their enduring advantages, particularly when coupled with effective financial administration, resulting in a favourable synergistic outcome. Consistent with our findings, Chen and Xie (2022) find a positive and significant but heterogeneous relationship between ESG disclosure and corporate financial performance for China listed companies. The findings are in support of the stakeholder theory, which suggests that when making business decisions, management should consider the benefits of different stakeholders (Argandoña, 1998; Friedman, 1984; Gibson, 2000; Stieb, 2009). Stakeholder theory guides management to focus on business operations that enhance the long-term value of the company and voluntary actions that result in sustainable performance in environmental, social, and governance (ESG) aspects, which are important to all stakeholders (Santamaria et al., 2021; Xie et al., 2019).
Conclusion
The rise in the interest in ESG-Financial performance nexus has brought with it both opportunities and challenges for companies managing their risk-return dynamics with shareholders and other stakeholders. This paper investigates the impact of environmental, social, and governance indicators on the corporate financial performance of 249 public companies selected from Europe, the Middle East and Africa (EMEA) and the Latin American economic regions from 2010 to 2020. We apply the panel generalised quantile instrumental variable and common correlated effect mean group estimators with objective of addressing cross-sectional heterogeneity, endogeneity and cross-sectional dependence issues that might bias the estimated coefficients.
In general, it is evident that ESG plays a significant role in influencing the financial performance of companies. According to our benchmark results, it appears that high-performing firms tend to see positive effects from ESG indicators, while low-performing firms may benefit from corporate social responsibility. By incorporating unobserved common factors to account for potential cross-sectional dependence, we found that the financial performance of firms in the lower and middle quantiles could be significantly enhanced through improved ESG disclosure and performance. In addition, the relationship between ESG indicators and leverage tends to favour high-performing firms over lower-performing ones. The relationship between ESG indicators and financial performance is considerably contingent on institutional effectiveness through corruption control and governments’ effectiveness in enacting proactive and pragmatic policies that are financial and economically induced. We confirm that the relationship between ESG indicators and corporate financial performance is heterogeneous, and there are possible unobserved common factors that could potentially bias the estimated coefficients. However, our econometric methods are robust and flexible enough to address these econometric issues.
Practical Implications and Future Research Direction
The study explores the relationship between environmental, social, and governance (ESG) indicators and corporate financial performance in emerging markets like Emerging Asia and Latin America. It suggests that companies in these regions can benefit from improving their ESG performance, as it can positively influence financial performance. Investors can use the findings to inform their investment decisions, as companies with strong ESG performance may be viewed more favourably. Firms can use the insights to develop or enhance their ESG strategies, with high-performing firms focusing on maintaining ESG performance to maintain their competitive advantage and lower-performing firms prioritising initiatives related to corporate social responsibility. The findings can also inform strategic decision-making, identify areas for improvement and enhance overall business sustainability. Future research could explore longitudinal analysis, sectoral analysis and more recent data to better understand the long-term effects of ESG initiatives on corporate outcomes.
Specifically, the study on the ESG-financial performance nexus suggests several practical implications for companies, regulators, and stakeholders. It recommends incentives for ESG disclosures and reporting, support for low-performing firms and integration of ESG considerations into risk management. It also suggests developing sector-specific ESG guidelines to address unique challenges and opportunities in different industries. It advocates for stronger governance mechanisms to ensure ESG compliance, including board oversight and executive accountability for ESG targets. It recommends regional collaboration on ESG standards to harmonise regulations and share best practices. It also encourages financial institutions to support ESG initiatives, launching education and capacity-building programmes to help firms understand the financial benefits of ESG investments. It also recommends monitoring and addressing unobserved common factors to ensure more accurate evaluations of ESG strategies and their financial impact. Policymakers should prioritise measures that improve ESG adoption, particularly for low and middle-performing firms, while ensuring robust frameworks to address cross-sectional dependence and heterogeneity.
Supplemental Material
sj-docx-1-sgo-10.1177_21582440251367906 – Supplemental material for Assessing the Impact of Environmental, Social and Governance Indicators on Corporate Financial Performance
Supplemental material, sj-docx-1-sgo-10.1177_21582440251367906 for Assessing the Impact of Environmental, Social and Governance Indicators on Corporate Financial Performance by Zhu Jiang and Prince Asare Vitenu-Sackey in SAGE Open
Footnotes
Ethical Considerations
This article does not contain any studies with human or animal participants.
Funding
The author(s) received no financial support for the research, authorship, and/or publication of this article.
Declaration of Conflicting Interests
The author(s) declared no potential conflicts of interest with respect to the research, authorship, and/or publication of this article.
Data Availability Statement
The data used in this study has been stored in Mendeley Data with DOI: 10.17632/cg356nh4vm.2
Supplemental Material
Supplemental material for this article is available online.
References
Supplementary Material
Please find the following supplemental material available below.
For Open Access articles published under a Creative Commons License, all supplemental material carries the same license as the article it is associated with.
For non-Open Access articles published, all supplemental material carries a non-exclusive license, and permission requests for re-use of supplemental material or any part of supplemental material shall be sent directly to the copyright owner as specified in the copyright notice associated with the article.