
Abstract
Increasing interest in sustainability performance (environmental, social, and governance pillar performance [ESGP]) and corporate financial performance (CFP) is noteworthy. However, we do not find any all-inclusive study that employs both individual components of environmental, social, and governance pillars (ESG) as well as the cumulative ESG score on both the accounting and market performance of firms. Furthermore, we do not find any study that puts forth “best practices” in the ESGP-CFP nexus. Therefore, our study intends to provide additional empirical evidence in this debate by including all three pillars of ESG as well as the overall ESG score by employing a unique sample of “100 best corporate citizens” in the United States declared by 3BL Media during 2009 to 2018. For this purpose, we employ panel vector auto regression (PVAR) that allows us to overcome the methodological challenges faced by some earlier empirical studies. The core findings are: (a) for market-based financial performance (market-to-book ratio [MTB] and Tobin’s Q), our results only confirm ESGP–CFP relationship and suggest that sustained higher commitment to the environmental pillar, consistent socially responsible conduct, and rationalized governance mechanism of the sampled firms are perceived value additive by the market players. (b) For accounting-based financial performance (return on equity [ROE] and return on assets [ROA]), we find a mix of ESGP–CFP and CFP–ESGP relationship for ROE only. Furthermore, factor error variance decomposition (FEVD) analysis reveals that environmental, social, and overall ESG performances of the sampled firms are quite good predictors of future CFP in the market. These findings assert that actively pursuing ESG endeavors can assist firms in achieving superior financial performance.
Introduction
Intertwining and interdependence of resources across time and space and consequent short-term versus long-term trade-offs experienced by the firms and the societies have forced their policymakers to devise sustainable practices without forgoing the core corporate objective of value maximization. However, starting with “use of corporate resources for any cause other than profit maximization would constitute a form of theft” (Friedman, 1962) to “creating a shared value” (M.E. Porter & Kramer, 2011), it is a roller-coaster journey wherein a multitude of managers continue to ignore the dynamic interactions of their businesses with a variety of different parameters surrounding their corporate ecosystem. Consequently, ESG (Environmental, Social, and Governance pillars) has emerged as a meta-construct (Orlitzky et al., 2003), and investigation about the relationship between ESG performance (ESGP) and corporate financial performance (CFP) is still inconclusive (Q. Wang et al., 2016).
Diverse theoretical underpinnings provide explanations for the ESGP–CFP nexus. The stakeholder theory advocates a positive ESGP–CFP relationship, whereas the trade-off theory posits a negative ESGP–CFP relationship. Alternatively, the slack resources theory suggests a positive CFP–ESGP relationship, and conversely, the managerial opportunism hypothesis postulates a negative CFP–ESGP relationship. Taking a holistic view to incorporate all four theoretical considerations, the positive/negative synergy hypothesis proposes a bidirectional causal relationship leading to “virtuous cycle” or “vicious cycle” (Lin et al., 2019). We find conflicts and inconsistencies not only in the theoretical grounding of this relationship but also in empirical studies investigating this relationship. Consequently, the theoretical and empirical research surrounding this relationship remains inconclusive but highlights the nonstatic nature of this relationship (Brammer & Millington, 2008; Lu et al., 2014; Margolis & Walsh, 2003).
Two meta-analytic findings report positive ESGP–CFP correlation (Friede et al., 2015; Orlitzky et al., 2003) having relatively high correlation with the accounting-based measures of CFP than with the market-based indicators, and this “virtuous cycle” is bidirectional and simultaneous (Orlitzky et al., 2003). Nevertheless, some challenge this very notion of bidirectional relationship and argue that “so far, there been no sufficient investigation on the bidirectional relationship between economic performance and CSR investment” (Lin et al., 2019). Quite intriguingly, the studies included in the two meta-analytic studies (Friede et al., 2015; Orlitzky et al., 2003) generally overlook the governance pillar of ESG. Among these two studies, there is no empirical study that focuses on governance, whereas there are only two vote-count studies that focus on governance (Gillan & Starks, 2007; Love, 2011), and two studies focus on all three pillars of ESG (Clark et al., 2015; Kleine et al., 2013). Nevertheless, these studies report a generally positive governance–CFP relationship, and a nominal percentage report a negative governance–CFP relationship. Besides, we do not find any study that employs both individual components of ESG as well as the cumulative ESG score on both the accounting and market performance of firms. Therefore, our study intends to provide additional empirical evidence in this ESGP–CFP debate by including all three pillars of ESG as well as the overall ESG score of 100 best corporate citizens.
This study makes the following contributions toward the extant literature. First, we investigate the ESGP–CFP association in “100 best corporate citizens” to observe whether ambitious ESGP endeavors of such firms have economic payoffs. Empirical results confirm that, overall, better ESGP leads to improved CFP of sample firms. Second, we employ both individual components as well as the cumulative score of ESG to take a holistic impact of ESGP on both accounting-based and market-based measures of firm performance. Contrary to Orlitzky et al. (2003), the results of this study depict a relatively high correlation with the market-based measures of firm performance than with the accounting-based measures. The results for market-based measures of financial performance (market-to-book ratio [MTB] and Tobin’s Q [TQ]) confirm the ESGP–CFP relationship and suggest that sustained higher commitment to ESG pillars by the sampled firms are perceived value additive by the market players. However, the results for accounting-based financial performance (return on equity [ROE] and return on assets [ROA]) suggest a mix of ESGP–CFP and CFP–ESGP relationship for ROE only. Third, we make full use of a recently developed panel vector auto regression (PVAR) model in a generalized method of moments (GMM)-based setting to uncover the perceived bidirectional association between corporate social performance (CSP) and CFP.
1. We organize the rest of the article as follows. Section “Literature Review and Hypothesis Development” develops the theoretical framework for this study and section “Data and Methods” describes the method and the data. Section “Results and Discussion” presents the results and their discussions and finally, section “Conclusions and Policy Implications” puts forward conclusions and policy implications. We provide references at the end.
Literature Review and Hypothesis Development
Environmental quality has a profound influence on the quality of living and life expectancy in a society (Shah et al., 2020). Since the work of Carroll (1979), which categorizes corporate social responsibility (CSR) investments into environmental, social, and governance constructs, the terms CSR and ESG have been used synonymously in the literature. Perhaps the pioneering proposition on ESG and CFP often referred to as trade-off theory dates back to the neoclassical researchers (Friedman, 1970; Vance, 1975; Wright & Ferris, 1997). They argue that a firm’s sole social responsibility is to maximize economic benefits for its shareholders, whereas the funds directed toward ESG activities pointlessly aggravate operating costs, thus lead to a decline in profitability. On the contrary, proponents of stakeholder theory (Freeman, 1984; Jones, 1995) assert that besides firm owners, other stakeholders are equally essential to an enterprise’s success for more beneficial contracting that opens new avenues of growth and stability (A. M. Fatemi & Fooladi, 2013).
Hence, from a strategic management viewpoint, good performance on various dimensions of ESG can have a much wider connotation (Waddock & Graves, 1997) than a cost, a restriction, or a donation. Besides, it can serve as a major source of innovation and competitive advantage (Michael E Porter & Kramer, 2006) which shall lead to improved CFP in the future (McGuire et al., 1990). Likewise, legitimacy theory (Scherer & Palazzo, 2007) also claims that an enterprise’s right to operate is granted by the stakeholders as a social contract that must be reaffirmed continuously. Hence, from this standpoint, the firm’s ESG practices are indispensable to provide a moral claim for the underlying social contract.
Firms have limited financial resources which need to be allocated efficiently in various investment activities (Ahmed et al., 2021). The empirical studies have well recognized the unidirectional impact of investments in ESG-related activities on the CFP. Nevertheless, the findings of these studies which examine the “doing well by doing good” hypothesis are rather contradictory and inconclusive (Krüger, 2015; Margolis & Walsh, 2003). Numerous studies point to both positive and negative linkages between ESGP and CFP. For instance, some observed a positive association between environmental performance and CFP (King & Lenox, 2002; Lee et al., 2016; Stanwick & Stanwick, 1998), while others found that CSR dimensions of society, environment, and employment practices have a negative influence on CFP (Brammer et al., 2006). Excess funds stuck in working capital accounts of firms negatively affect investments in long-term value maximizing projects (A. Akbar et al., 2020a). From China’s context, Yang et al. (2019) studied the impact of CSR performance on the financial performance of Chinese Pharmaceutical firms. Their results implore that the overall CSR rating of a firm has positive impact on its financial performance. Likewise, Wu and Shen (2013) observe a positive influence of CSR policies on a firm’s accounting-based performance proxies. Similarly, Zhao et al. (2018) explored this phenomenon in the energy and power generation sector of China. The results of panel-based regression assert that a superior ESG performance indeed spurs CFP of Chinese firms. Therefore, firms have an incentive of investing in environmental, social, and governance endeavors.
In a more recent study, A. Fatemi et al. (2015) employed simulation analysis and demonstrate positive effects of CSR on firm value. Likewise, using the quantile regression researchers found positive effects of brand equity and CSR on firm performance (D. H.-M. Wang et al., 2015). Furthermore, Z. Wang and Sarkis (2017) examine aggregate ESG scores of top 500 green U.S. firms and reveal that CSR governance leads to enhanced financial outcomes through improved CSR outcomes. However, Ching et al. (2017) found no significant association between a firm’s sustainability reporting and the financial performance of listed firms on the corporate sustainability index.
From the perspective of a strong corporate governance mechanism and resulting firm value, Achim et al. (2016) investigated a sample of firms listed on the Bucharest stock exchange. Their findings juxtapose a positive association between the quality of corporate governance and the market value of the sample firms. Hence, a high score on corporate governance indicators can optimize firm value. In the banking industry, a higher score on corporate governance and employee dimensions led to a higher CFP, whereas product responsibility and society dimensions do not show any positive effects on CFP (Esteban-Sanchez et al., 2017). Although the definition and methodological approach to examine ESG and firm performance vary substantially in the existing studies (Nelling & Webb, 2009; Peloza & Papania, 2008; Surroca et al., 2010), there is, however, a consensus that ESG-related investments do affect the financial performance of a firm (Xie et al., 2019; Yu et al., 2018).
Female corporate executives are deemed to be good corporate citizens as they make considerably higher environmental investments than their male counterparts (Jiang & Akbar, 2018). Notwithstanding, being a good corporate citizen comes at a cost, requiring firms to actively develop and sustain their social image which might have intangible gains, whereas ESG activities have a tangible cost. As a result, stakeholders may find it difficult to assess this long-run value proposition (Broadstock et al., 2019). Therefore, a handful of studies also present a negative relationship between ESG performance and firm performance. For example, Garcia et al. (2017) examined companies from BRICS countries and concluded a negative association between profitability and environmental performance. However, the study used linear regressions for the empirical investigation that might raise the issue of endogeneity. Similarly, Jain et al. (2017) indicate a negative link between a firm’s ESG score and corresponding CFP. Nevertheless, Achim and Borlea (2014) studied the impact of environmental investment on the accounting performance of the listed Romanian firms measured by ROA. Their results corroborate that environmental investments considerably escalate a firm’s internal financial burden thus leading to a decrease in its financial performance. However, corporate environmental investments positively influence the market indicator of TQ. These diverse outcomes are attributed to the fact that investors favorably perceive a firm’s environmental initiative, which is reflected in the stock prices.
It is interesting to note that institutional investors and sovereign funds positively value ESG performers to generate long-term financial returns on their investment portfolios along with limiting risk (Kapoor, 2017). Similarly, Miralles-Quirós et al. (2018) found that environmental, social, and governance performance was positively valued by the Brazilian investors. Likewise, Auer and Schuhmacher (2016) examined the impact of investing in the stocks of pro-ESG firms on the respective portfolio returns in the United States, Europe, and the Asia Pacific. Their findings reveal that in the United States and Asia Pacific region, ESG-driven investments get similar returns to the broad market. However, in the context of Europe, investors have to pay a price for investing in socially responsible firms as their portfolio returns fall short of the market returns. This evidence conjectures regional disparities in the performance of ESG top performers. To sum up this sprawling discussion, Friede et al. (2015) conducted an extensive systematic literature review and found that the relationship between ESGP and CFP is well-founded. Nearly 90% of the researchers reported a non-negative association, and a vast majority of studies reveal a positive ESGP–CFP relation. Furthermore, using a large global data set, a recent study found a non-negative relationship of most of the ESG activities with CFP (Xie et al., 2019). Therefore, in light of the above discussion and consistent with the stakeholder theory, we propose our first hypothesis as follows:
Hypothesis 1 (H1): Better performance on ESG indicators lead to improved accounting and market performance of firms.
The slack resource theory, however, proposes that instead of firms’ ESG influencing CFP, it is the better CFP that leads to an enhanced ESG performance (Waddock & Graves, 1997). Improved financial standing enables firms to deploy more financial resources in socially responsible activities such as employee relations, society, and the environment (Preston & O’Bannon, 1997). Waddock and Graves (1997) further conjecture that a bidirectional causality may exist whereby not only ESG influences CFP but also CFP affects ESG simultaneously, which is termed as positive/negative synergy hypothesis. We argue that if such a scenario exists, one needs to control for the endogeneity between ESG and CSP constructs. However, the majority of the aforementioned studies fail to take account of this situation casting doubt on the robustness of such findings. For example, while examining the causal relation, Siegel and Vitaliano (2007) and Surroca et al. (2010) do not take into consideration the possibility of a simultaneous association between ESG and CFP. Consequently, we observe a dearth of studies that investigate a two-way relationship between ESG and firm financial performance.
To overcome this weakness, Lin et al. (2019) assess the bidirectional association between ESG scores and CFP. Their findings posit that better financial performance leads to improved ESG engagement. While better ESG engagement does not necessarily lead to superior financial performance. However, the scope of their work is limited to the overall ESG rating score and accounting-based performance measures only. Endorsing positive/negative synergy theory as a relevant theoretical lens, Nakamura (2015) found that environmental and social performance has a bidirectional relationship with firm performance. Similarly, recent studies such as (Anderson et al., 2014; Chollet & Sandwidi, 2018; Kang et al., 2016) also found a bidirectional association between corporate social conduct and firm performance. However, Q. Wang et al. (2016) conclude that the association between ESGP and CFP is significantly influenced by contextual factors such as the sample, empirical method, and the measures used to proxy ESG and firm performance. Therefore, this study investigates this bidirectional relationship in the context of firms designated as “100 best corporate citizens,” and to overcome the weakness of Lin et al. (2019), it uses market-based and accounting-based measures of firm performance. We put forward the following hypotheses for empirical exploration:
Hypothesis 2 (H2): There exists a bidirectional association between ESG performance and accounting performance of sample firms.
Hypothesis 3 (H3): There exists a bidirectional association between ESG performance and market performance of sample firms.
Data and Methods
Sample and Data Collection
This study is based on the data of “100 best corporate citizens” of the United States declared by 3BL Media during the last 10 years (2009–2018) extracted from their Corporate Responsibility (Cremers and Ferrell) magazine that ranks the companies in this list based on outstanding ESG transparency and performance among Russell 1000, United States’ 1,000 largest and publicly traded companies.
For ESG being a meta-construct (Orlitzky et al., 2003), there are seven pillars: environment (28 factors), climate change (27 factors), governance (12 factors), employee relations (24 factors), human rights (17 factors), philanthropy (18 factors), and financial (8 factors). In this study, we employed environmental (environment and climate change pillars), social (employee relations, human rights, and philanthropy pillars), and corporate governance (governance and financial pillars) indices to proxy ESGP and examined their relationship with the firm’s market-based (MTB and TQ) and accounting-based (ROA and ROE) measures of CFP considering different correlations found in earlier studies (Orlitzky et al., 2003). We obtained the ESG data from the 3BL website and the data for CFP measures from Thomson Reuters® Eikon® for 2009 to 2018 of all “100 best corporate citizens” declared during 2009 to 2018 (firms that remain a part of “100 best corporate citizens” only for 1 year are excluded from the analysis as lag 1 value for these firms was unavailable).
Measurement of Variables
Firm performance
Traditionally, studies use accounting-based ROE and ROA to measure CFP (A. Akbar, 2014b; M. Akbar & Akbar, 2016; M. Akbar et al., 2020b). However, some researchers argue that these proxies do not reflect the real value of a firm and necessitate the inclusion of other measures to capture the firm value (Coluccia et al., 2019). Consequently, we use four different proxies to measure CFP: two future-oriented measures (MTB and TQ) and two past-oriented measures (ROE and ROA). It is worth mentioning that although both ROE and ROA are measures of a firm’s accounting performance, they are not a perfect substitute for each other rather they are just alternatives (A. Akbar, 2014a; Z. Wang et al., 2020). A firm could increase its ROE by issuing more debt; nonetheless, this practice would not increase the firm’s ROA. Similarly, MTB and TQ are also just two alternatives to measure the market performance of a firm wherein both use the market value of the firm as a numerator but use different denominators (see Table 1 for the definition of all four measures).
Variables and Their Proxies.

Source. Authors’ calculation 2019. PCA = principal component analysis.
ESG performance
For ESG measures, we apply principal component analysis (PCA) with the core objective of parsimony to condense a large number of correlated factors included in different pillars into a small number of uncorrelated variables that retain as much information as possible in the original bucket of variables. Using PCA, our E-Index is a condensed form of all factors included in the environment and climate change pillars; S-Index abridged from all factors included in three social pillars, namely employee relations, human rights, and philanthropy; finally, our G&F-Index is an abstraction of factors included in governance and financial pillar (see Table 1 for the definition of all three measures).
Method
We used a recently developed econometric technique PVAR based on GMM (Abrigo & Love, 2016) to address the challenges such as causality factor and simultaneity encountered in the past literature.
Traditionally, researchers have used time-series VAR models as an alternate to multivariate simultaneous equation models developed by Sims (1980). However, since its introduction, PVAR model has been widely used in the literature of finance and economics (e.g., Love & Ariss, 2014; Love & Zicchino, 2006). By treating all the variables in the VAR system as endogenous, PVAR combines the VAR approach with panel data technique that allows for unobserved individual heterogeneity inherited in the panel data (Love & Zicchino, 2006). However, unlike basic panel data techniques (random effects and fixed effects), this technique employs a time lag, which is a sophisticated way to address the issue of simultaneity and/or reverse causality. Besides, when compared with the standard VAR models, Panel VAR has the ability to (a) account for cross-sectional dimensions, (b) treat links through units in an unrestricted way, and (c) capture both static and dynamic interdependencies (Canova & Ciccarelli, 2013).
Therefore, there are several motivations to use this approach in this study. First, all lagged dependent variables help control the causality that is unable to run against time. Furthermore, the PVAR approach generates the efficient estimations of coefficients in the system with endogenous variables (Jouida, 2018). Second, PVAR allows us to examine the lagged effects of ESG on firm financial performance and to check whether the feedback from financial performance to ESG has been realized. Third, our focus is on the orthogonal impulse response function (IRF) that examines the response of one variable of interest (e.g., E-Index) to an orthogonal shock in other variables of interest (e.g., MTB). By doing so, we can realize the effect of one shock at a time while holding other shocks equal to zero. Fourth, we demonstrate the magnitude of total effect by variance decomposition analysis that shows the percentage of variation in one variable caused by the shock to other variables aggregated over time. Fifth, PVAR is a powerful technique for analysis because it adds the structural-time disparity and cross-section dimensions in the standard VAR model (M. Akbar et al., 2020c; Andrews & Lu, 2001). Finally, this study is different from earlier studies in a way that it emphasizes controlling unobserved individual heterogeneity to give a bidirectional relationship a limit.
We specify our econometric models as follows:


where CFP represents MTB, TQ, ROE, or ROA, and ESGP denotes E-Index, S-Index, G&F-Index, and ESG-Index. Whereas, µi and eit are vectors of E-Index, S-Index, G&F-Index, and ESG-Index as dependent variable-specific fixed-effects and idiosyncratic errors, respectively.
Descriptive Statistics
We present descriptive statistics of all variables in Table 2. The mean values of market performance measures (MTB and TQ) are fairly higher than one. This indicates that selected firms have healthy value projections, and therefore investors are paying a premium for that possibility. Similarly, the average ROA and ROE of the sampled firms are also quite high which shows that these firms have managed their business efficiently. Interestingly, the average ROE of the sampled firms is around five times higher than that of ROA. One possible reason for this substantial gap could be that these firms are generously using debt financing.
Descriptive Statistics.
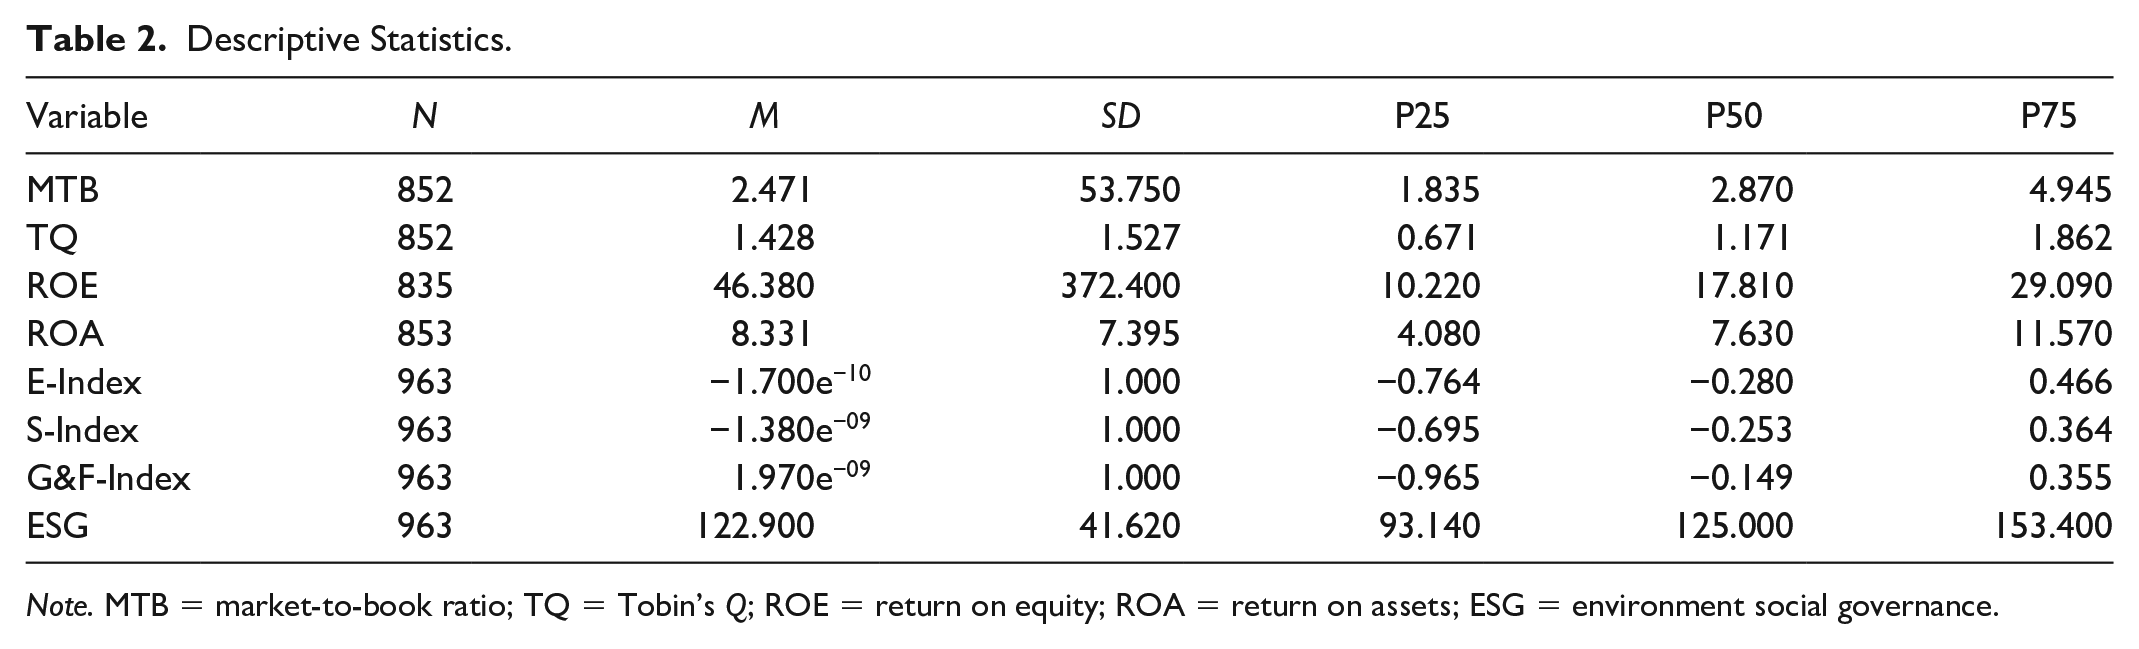
Note. MTB = market-to-book ratio; TQ = Tobin’s Q; ROE = return on equity; ROA = return on assets; ESG = environment social governance.
Model Selection Procedure
Specification of econometric models such as dynamic panel data models and other macroeconomic models through moment conditions instead of complete distributional assumptions estimated through GMM is quite common. To achieve consistency and asymptotic normality, GMM relies on the correct specification of the model and the moment conditions (Andrews & Lu, 2001). To ensure this in this study, we follow the three model selection criteria proposed by Andrews and Lu (2001), which resemble extensively used likelihood-based selection criteria, namely Bayesian information criteria (BIC; Coluccia et al., 2019), Akaike information criteria (AIC), and Hannan–Quinn information criteria (HQIC). We employ first-to-third-order lags of ESG and CFP measures, as depicted in Table 3. The results reported in Table 3 show that first-order PVAR is more appropriate among all the three models because it has the smallest BIC, HQIC, and AIC values (Andrews & Lu, 2001). Based on these selection criteria, we fit a first-order PVAR model with the same specification of instruments as presented in Table 3 using GMM estimation implemented by PVAR.
Panel VAR Lag-Order Selection.

Note. Selection measures are calculated using first- to third-order PVAR sets of ESG and CFP. The reported smallest BIC, HQIC, and AIC values for first-order PVAR makes it most appropriate model among all the three models, criteria established by Andrews and Lu (2001). VAR = vector auto regression; CD = carbon disclosure; BIC = Bayesian information criterion; AIC = Akaike information criterion; HQIC = Hannan–Quinn information criterion; MTB = market-to-book ratio; TQ = Tobin’s Q; ROE = return on equity; ROA = return on assets.
Stability of PVAR Model
To examine the stability of our PVAR models, we calculated the eigenvalues. The results in Table 4 show that each modulus value is less than 1 suggesting VAR stability for all four models (Brüggemann & Lütkepohl, 2006).
Eigenvalue and Model Stability.
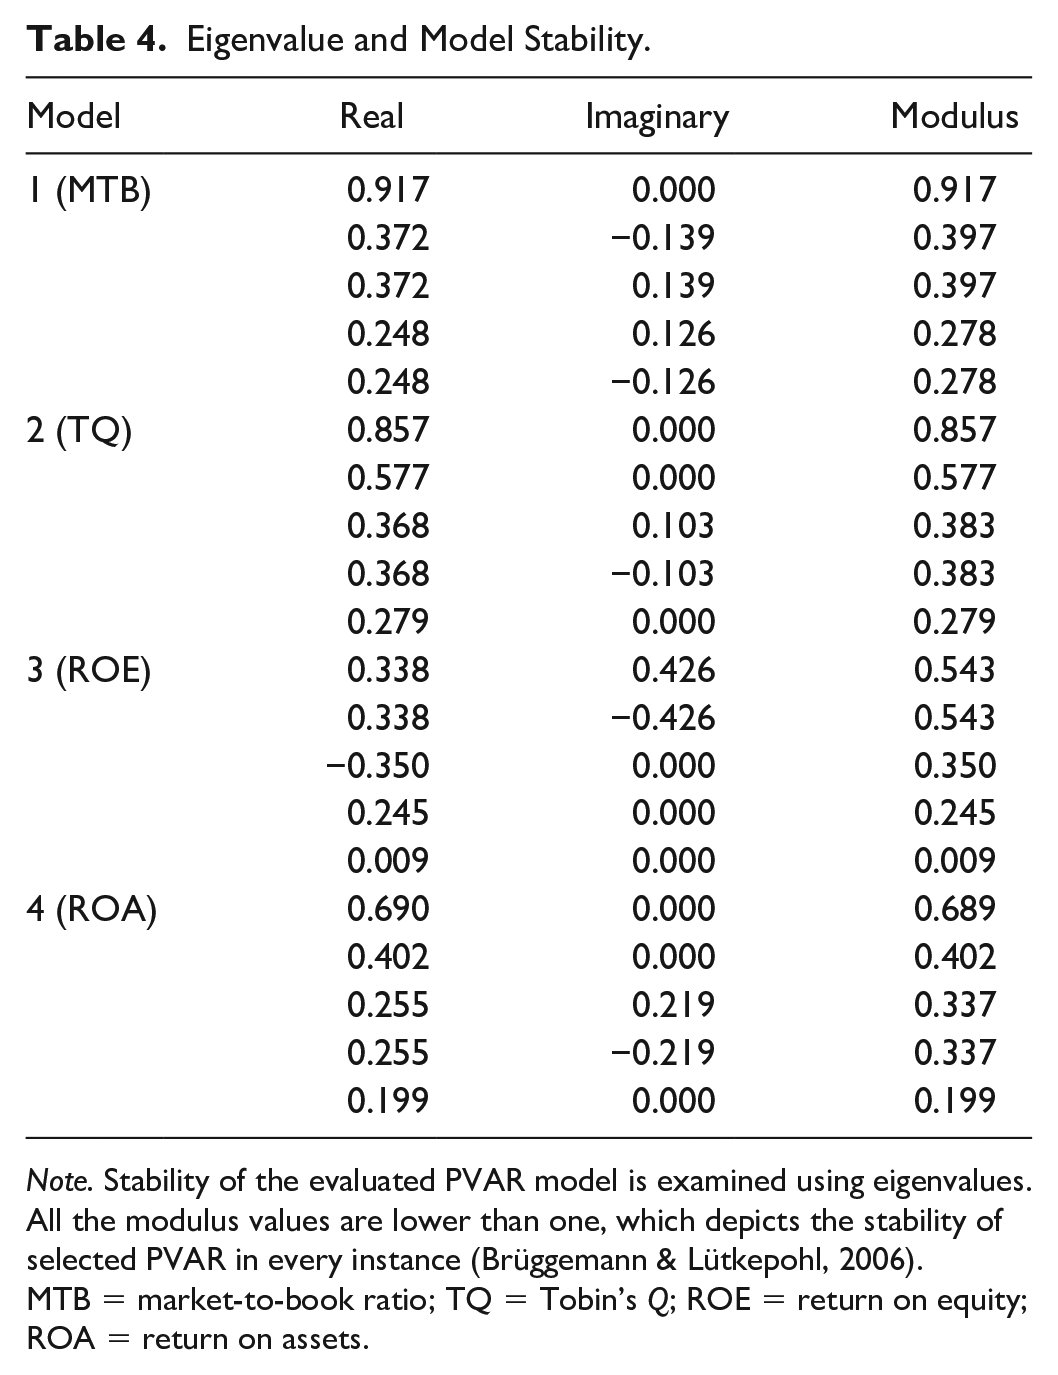
Note. Stability of the evaluated PVAR model is examined using eigenvalues. All the modulus values are lower than one, which depicts the stability of selected PVAR in every instance (Brüggemann & Lütkepohl, 2006). MTB = market-to-book ratio; TQ = Tobin’s Q; ROE = return on equity; ROA = return on assets.
Besides, Figure 1 shows that all the eigenvalues are within the unit circle, and it further confirms the stability condition for our ESGP and CFP panel.
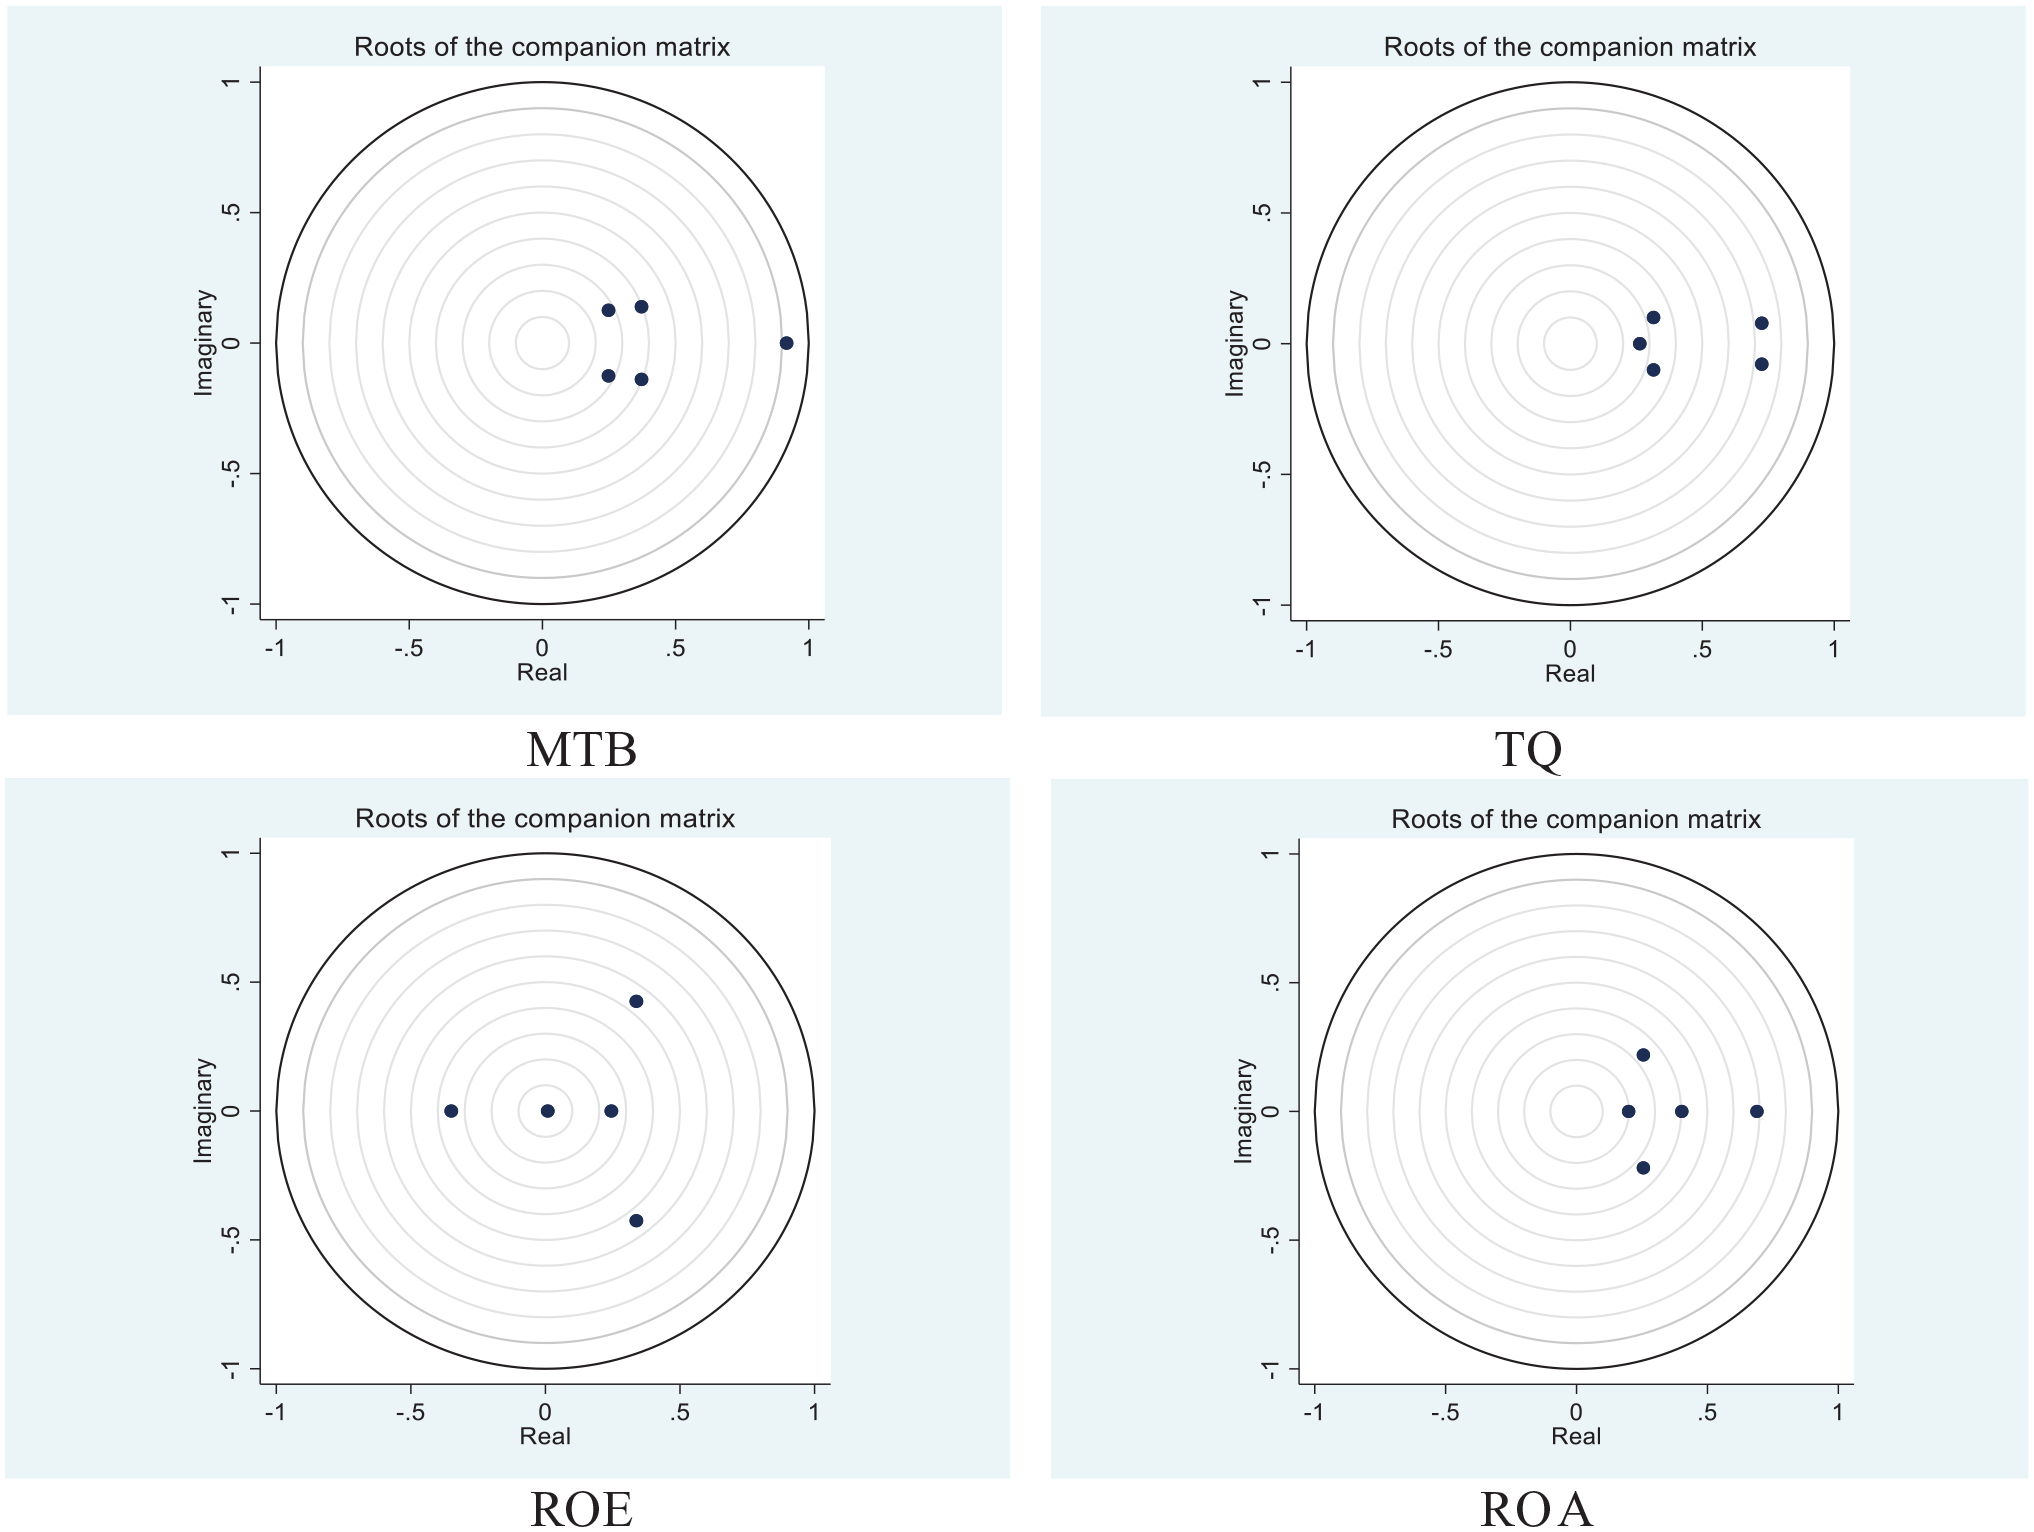
Graph of eigenvalues within the unit circle.
Results and Discussion
This section entails our empirical strategy and discussion of the results of PVAR, factor error variance decomposition (FEVD), and IRF. Besides, to ensure econometric rigor, we also employ the Granger causality analysis as a robustness check.
We do not find any two-way causal relationship between the proxy of ESGP and market-based CFP measures (MTB and TQ). This finding suggests irrelevance of the positive/negative synergy hypothesis (Preston & O’Bannon, 1997; Waddock & Graves, 1997) to explain the market response to our sampled “best corporate citizens.” However, we do find a bidirectional relationship between ESGP and accounting-based CFP measure (ROE), supporting the negative synergy hypothesis.
Panel Vector Auto-Regression
We present our results for the association between market-based CFP measures and ESGP in Tables 5 to 8. These results suggest that there exists an ESGP-CFP relationship whereas there is no CFP–ESGP relationship for our market-based measure MTB, indicating the relevance of the stakeholder, and irrelevance of the slack resources theory and the managerial opportunism hypothesis to explain the behavior of the sampled firms. We find a significant positive association of E-Index with market-based CFP measures (MTB and TQ) suggesting that better environmental performance of the firms helps improve their financial performance in the market. These results are consistent with the results and conclusions of Kapoor (2017) and Miralles-Quirós et al. (2018) to put forward a powerful message for the corporate managers and potential investors.
Results of Two-Variable VAR With MTB.

Note. Two-variable panel VAR model is estimated by GMM. Reported numbers show the coefficients of regressing the row variables on lags of the column variables. t-statistics are in parentheses. MTB = market-to-book ratio; TQ = Tobin’s Q; ROE = return on equity; ROA = return on assets; ESG = environment social governance.
Indicates significance at 1% level.
Results of Four-Variable VAR With MTB.

Note. Four-variable panel VAR model is estimated by GMM. Reported numbers show the coefficients of regressing the row variables on lags of the column variables. t-statistics are in parentheses. VAR = vector auto regression; MTB = market-to-book ratio.
Indicates significance at 10% level.
Indicates significance at 5% level.
Indicates significance at 1% level.
Results of 2-Variable VAR With TQ.

Note. Two-variable panel VAR model is estimated by GMM. Reported numbers show the coefficients of regressing the row variables on lags of the column variables. t-statistics are in parentheses. VAR = vector auto regression; TQ = Tobin’s Q; ESG = environment social governance.
Indicates significance at 5% level.
Indicates significance at 1% level.
Results of Four-Variable VAR With TQ.
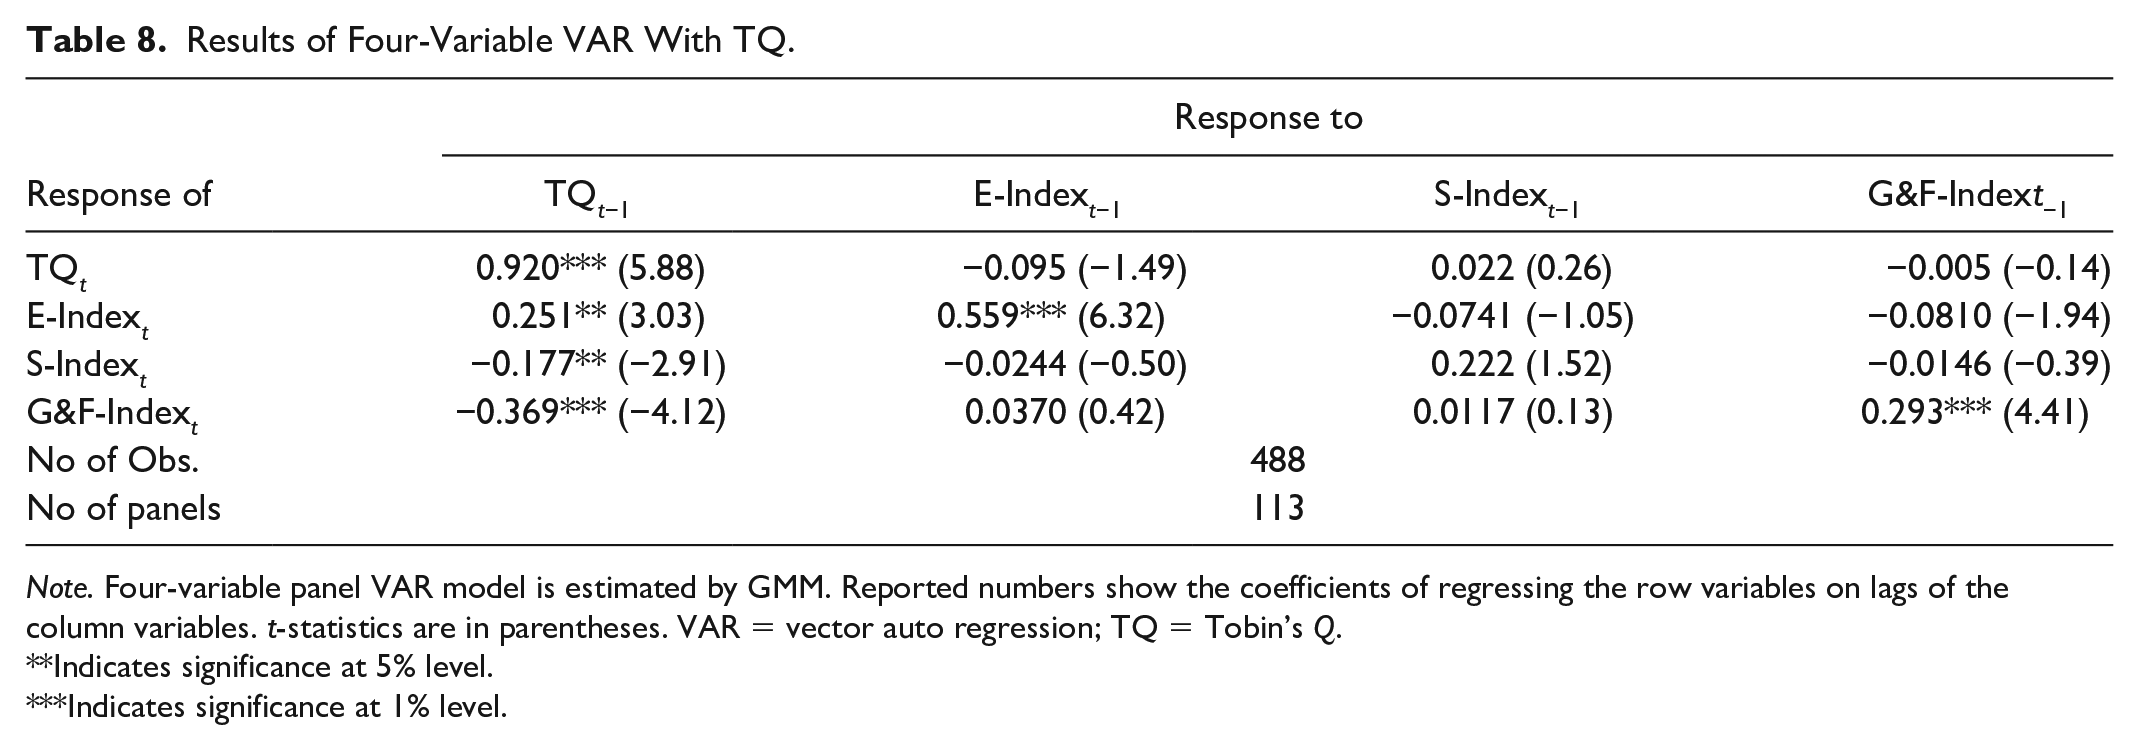
Note. Four-variable panel VAR model is estimated by GMM. Reported numbers show the coefficients of regressing the row variables on lags of the column variables. t-statistics are in parentheses. VAR = vector auto regression; TQ = Tobin’s Q.
Indicates significance at 5% level.
Indicates significance at 1% level.
To be in the list of “best corporate citizens” superior financial performance in the marketplace is not a necessary precondition, rather investing in environmental activities and consequent “shared value” created shall help generate superior financial performance in the marketplace. Furthermore, a significant positive association of E-Index with its lag suggests reinforcing path-dependent behavior of environmental investments. This means once these firms embark upon the environmentally responsible path, they sustain continuous improvement in their environmental efforts, and the market rewards these efforts quite well. This finding has a strong message for the public policymakers and the regulators that is, develop and implement effective regulatory frameworks that require the corporate entities to take care of their surrounding environment and report their environmental efforts. Once they start investing and reporting their environmental activities, the shared value they create and the positive image they build in the society shall trigger a “virtuous cycle” that shall sustain them on this environment-friendly path.
Contrarily, we find a significant negative association of S-Index with market-based CFP measures (MTB and TQ), suggesting that increased social performance of the firms leads to deterioration of their financial performance in the marketplace. This finding suggests that in the eyes of the market, the marginal costs of further improving socially dependable conduct of the firms outweigh its potential marginal benefits, and consequently improved social conduct has negative implications for a firm’s financial performance in the market. Moreover, a significant positive association of S-Index with its lag (for TQ) suggests continued social conduct of the sampled firms, whereas an insignificant association of S-Index with its lag (for MTB) suggests inconsistent social conduct of the sampled firms. The results indicate that market players discount mixed signals of the corporate social conduct as value decreasing.
Furthermore, a significant negative association of G&F-Index with TQ (and insignificant association with MTB) yields an exciting result that improved governance and financial performance of the “best corporate citizens” leads to deterioration in the firm’s financial performance in the market. Furthermore, a significant positive association of G&F-Index with its lag suggests sustained effort of these firms to improve their governance practices; however, the market participants seemingly believe that the “best corporate citizens” have already achieved governance excellence and any additional investment in governance is value decreasing.
Finally, there is a significant association of overall index ESG with MTB (and insignificant association with TQ) suggesting that market players appreciate (via MTB) superior overall ESGP. Consequently, sustained higher commitment to the environmental pillar, consistent and efficient socially responsible conduct, along with a balanced and rationalized governance mechanism of the sampled firms are perceived value additive by the market players. Quite interestingly, our first finding of positive environment ESGP–CFP relationship lends empirical support to the stakeholder theory (Donaldson & Preston, 1995) but contradicts the trade-off theory (Friedman, 1962; Waddock & Graves, 1997). Our second finding of negative social and governance ESGP–CFP relationship contradicts the stakeholder theory (Donaldson & Preston, 1995) but lends empirical support to the trade-off theory (Friedman, 1962; Waddock & Graves, 1997). Furthermore, a significant positive association of MTB and TQ with their respective lag along with very high coefficients suggest consistency of market financial performance of the “best corporate citizens,” and their past performance is a strong predictor of their future market financial performance.
We present our results for the association between accounting-based CFP measures (ROE and ROA) and ESGP in Tables 9 to 12. Our results suggest a mix of ESGP–CFP and CFP–ESGP relationship for ROE and no relationship for ROA. The insignificant association for ROA is justified on the ground that the sample firms are consistently increasing their asset base to support sales growth. Thus, an increase in the income level of firms does not affect their ROA because of a parallel increase in the assets. These findings indicate that to explain accounting-based financial performance ROE of the sample firms the negative synergy theory is relevant. Besides, we find a significant association of ROE with its lag suggesting that past accounting-based financial performance of firms is a predictor of their future accounting-based financial performance. However, the small coefficients suggest that past performance provides only a nominal explanation of future financial performance. Our results in Table 10 indicate a significant negative effect of E-Index and S-Index on accounting-based CFP measures (ROE) suggests that spending on environmental and social endeavors decreases the current profitability of the firms, in line with the trade-off theory. Combining this with our results for market-based financial performance that support the stakeholder theory, we can state that the sampled firms continued their ESG endeavors even though they experienced the short-term versus long-term trade-off, and the market appreciates their continued commitment to ESG endeavors. Moreover, an association of S-Index with ROA is insignificant, suggesting that increased social performance of the firm has no impact on the accounting-based financial performance of the firm.
Results of Two-Variable VAR With ROE.

Note. Two-variable panel VAR model is estimated by GMM. Reported numbers show the coefficients of regressing the row variables on lags of the column variables. t-statistics are in parentheses. VAR = vector auto regression; ROE = return on equity; ESG = environment social governance.
Indicates significance at 10% level.
Indicates significance at 5% level.
Indicates significance at 1% level.
Results of Four-Variable VAR With ROE.

Note. Four-variable panel VAR model is estimated by GMM. Reported numbers show the coefficients of regressing the row variables on lags of the column variables. t-statistics are in parentheses. VAR = vector auto regression; ROE = return on equity.
Indicates significance at 10% level.
Indicates significance at 5% level.
Indicates significance at 1% level.
Results of Two-Variable VAR With ROA.

Note. Two-variable panel VAR model is estimated by GMM. Reported numbers show the coefficients of regressing the row variables on lags of the column variables. t-statistics are in parentheses. VAR = vector auto regression; ROA = return on assets; ESG = environment social governance.
Indicates significance at 1% level.
Results of Four-Variable VAR With ROA.

Note. Four-variable Panel VAR model is estimated by GMM. Reported numbers show the coefficients of regressing the row variables on lags of the column variables. t-statistics are in parentheses. VAR = vector auto regression; ROA = return on assets.
Indicates significance at 5% level.
Indicates significance at 1% level.
Overall, following negative synergy theory, Table 9 indicates a significant negative effect of ESG on CFP measure of ROE and vice versa. It suggests that although improved ESG performance has a positive association with firm market performance (MTB); however, the opposite is true for the accounting-based financial measure. These results are consistent with Achim and Borlea (2014) who postulate that environmental investments escalate the firms’ financing burden hence leading to a decline in the accounting-based performance. Yet, investors favorably perceive ESG investments due to being a good corporate citizen which in turn boost the stock market performance indicators of firms. Thus we conclude that instead of short-term in nature and past-oriented financial performance measures (ROA and ROE), the impact of ESGP is a long-term market value relevant, and future-oriented performance measures (MTB, TQ), and the market players value corporate sustainable practices in a market economy.
FEVD
We present the results of FEVD analysis in Table 13 based on 2,000 Monte Carlo simulations. We do not present standard error and confidence interval in the table for brevity. The results show that MTB explains only a nominal variation (below 0.23%) in future ESG performance. However, E-Index explains 31% to 48%, S-Index explicates 49% to 58%, G&F-Index elucidates only 6% to 7%, and overall ESG explains 26% to 38% of variation in future MTB (5 and 10 periods ahead, respectively).
Factor Error Variance Decomposition Analysis (FEVD)..

Note. Percent of variation in the row variable (5 and 10 periods ahead) explained by column variable. Whereas, panels A, B, C, and D refer to the model with MTB, TQ, ROE, and ROA, respectively. MTB = market-to-book ratio; ESG = environment social governance; TQ = Tobin’s Q; ROE = return on equity; ROA = return on assets.
Furthermore, the results for TQ show that TQ explains only a nominal variation (below 0.27%) in future ESG performance. Whereas E-Index expounds 31% to 48%, S-Index explains only 0.02% to 0.01%, G&F-Index explicates only 2% to 1%, and overall ESG elucidates a nominal 1% to 0.8% of variation in future TQ (5 and 10 periods ahead, respectively). We observe that these findings of FEVD are in line with the results of PVAR and argue that results reflect the long-term association between ESG and CFP.
These results provide a basis for joint ownership of the regulators and the policymakers in the corporate arena to develop an inclusive policy to create and sustain “shared value” as well as to sustain environmental and social capital for posterity. These results suggest that instead of financial ratios benchmarks, the financial market players should use ESG-based indices as new benchmarks to build “green investment” and “sustainable finance” portfolios to create and sustain long-term “shared value.”
IRFs
As a postestimation test, we calculate and plots the orthogonalized impulse response functions (OIRF) a variant of IRF that also takes into consideration the contemporaneous correlation between the variables (Brandt & Williams, 2006). The confidence bands of OIRF are estimated using Gaussian approximation based on Monte Carlo draws from our estimated PVAR model. Moreover, to apply OIRF, it is important to determine the order of variables in the system (Hamilton, 1994). The fundamental rule is the more exogenous variables should appear earlier in the system while the more endogenous variables should appear later (Love & Zicchino, 2006). As a customary practice, we assume that CFP is more exogenous than ESG and its components. In the extant literature, it is evident that CFP measures (MTB, TQ, ROA, and ROE) are more prone to shocks from outside the system and therefore are considered more exogenous. On the contrary, shocks to CFP can produce an effect on E-Index, S-Index, G&F-Index, and consequently on ESGP as a whole. Studies by Lin et al. (2019) and Waddock and Graves (1997) suggest that shocks to firms’ social performance (ESGP) create an effect on CFP in the future (year t+1). Therefore, in the current model, CFP appears before ESGP and its components.
In terms of levels, OIRF in Figure 2 (A, B, C, and D) shows the response of one variable to one standard deviation change in another variable. The results demonstrate that a positive shock on MTB and TQ leads to a slight increase in ESG, followed by a slight decrease until the effect dies out after 6 to 7 periods. The effect of current shock in ESG has a positive impact on MTB; however, this impact tends to decrease over time. Unlike ESG and market-based performance nexus, the IRF graphs for accounting-based CFP measures have different results. Here, one standard deviation change in ESG brings a sudden hike in ROE, followed by a sharp decrease, and then effect normalizes after roughly six periods. On the contrary, a positive change in ROE leads to a sharp decrease in ESG, then a slight increase, and finally effect dies out after four periods.

(A) Impulse responses for 1 lag panel VAR of MTB, ESG, E-Index, S-Index, and G&F-Index. (B) Impulse responses for 1 lag panel VAR of TQ, ESG, E-Index, S-Index, and G&F-Index. (C) Impulse responses for 1 lag panel VAR of ROE, ESG, E-Index, S-Index, and G&F-Index. (D) Impulse responses for 1 lag panel VAR of ROA, ESG, E-Index, S-Index, and G&F-Index.
Robustness Check (Granger Causality Analysis)
As a robustness check, we employ Granger causality analysis on our proposed empirical models. Results in Table 14 show that ESG does Granger cause MTB; however, MTB does not Granger cause ESG (stakeholder theory). In the context of accounting-based measure of firm performance, we find a two-way causality, as ESG Granger causes ROE. Similarly, ROE also Granger causes ESG (negative synergy theory). Concisely, the findings of the Granger causality analysis are in line with the findings of our baseline panel VAR regressions, suggesting that model specification is reasonable.
Bivariate Granger Causality Test.

Note. We present the overall results obtained with the Granger Causality Wald Test. The findings indicate that at 95% confidence interval, ESG does Granger cause MTB whereas, MTB does not Granger cause ESG. Similarly, at 95% confidence interval, ESG does Granger cause ROE and vice versa. MTB = market-to-book ratio; ESG = environment social governance; TQ = Tobin’s Q; ROE = return on equity; ROA = return on assets.
To conclude, PVAR results confirm the unidirectional relationship between ESG and the firm’s market-based performance measure while, bidirectional relationship for ESG and accounting-based financial performance. The FEVD analysis supports the results of PVAR and suggests a long-run relationship between ESG and CFP. The IRF graphs show that this long-run relationship is not static rather it is dynamic over time. Finally, as a robustness test, we applied the Granger causality test and found similar results.
Conclusions and Policy Implications
The interdependence of corporate and societal resources across time and space, and consequent trade-offs experienced by the firms and the societies have forced the policymakers to devise sustainable practices without forgoing the core corporate objective of value maximization. During the decades of this dynamic journey, a variety of different theoretical frameworks evolved that explicate the relationship between ESGP and CFP and a plethora of empirical studies investigating CFP-ESGP nexus. However, the conflicts and inconsistencies observed in theoretical grounding and empirical studies render the research carried out so far inconclusive but highlight the nonstatic nature of this relationship. This study employs a unique data set of “100 best corporate citizens” declared by 3BL Media during the last 10 years (2009–2018) to investigate the causal nexus between ESGP and CFP. The motivation to choose this sample is to ascertain whether being a top performer on the CSR front translates to financial payoffs for such firms. Besides, we use a recently developed econometric technique called PVAR based on GMM to overcome the methodological challenges faced by earlier empirical studies,
In line with the stakeholder theory, the study findings confirm that there exists an ESGP–CFP relationship, while there is no CFP–ESGP relationship that indicates the irrelevance of positive/negative synergy theory in the context of market-based firm performance measures MTB and TQ. These findings assert that such firm’s superior performance on environment and society dimensions mainly stem from managerial consciousness and continued commitment toward its stakeholders. These findings have a powerful policy implication for corporate managers, that is, investment in environmental activities and striving to become a good corporate citizen shall create “shared value” that shall help sustain superior financial performance in the marketplace. Our results also suggest that once the firms embark upon the environmental preservation path, the market appreciates their environmental efforts; consequently, it initiates and sustains the “virtuous cycle” of environmental investments and “shared value” creation. The policy implication is that developing and implementing effective regulatory frameworks that require the corporate entities to take care of their surrounding environment is a win–win solution for the enterprise and the society.
Interestingly, our results indicate that the marginal cost of further improving socially dependable conduct of the firms outweighs its potential marginal benefit and consequently has negative implications for the firm’s financial performance in the market. Results also suggest that sampled firms have sustained their efforts to improve their governance practices. However, the market participants seemingly believe that these firms have already achieved governance excellence and any additional investment in governance is value decreasing. Based on these findings, we can conclude that continued commitment to the environmental pillar, consistent socially responsible conduct, and rationalized governance mechanism of the sampled firms are perceived value additive by the market players.
Results for accounting-based CFP measures of ROE and ROA suggest a mix of ESGP–CFP and CFP–ESGP relationship for ROE (negative synergy theory) and no association for ROA.
Results of FEVD analysis suggest that environmental, social, and overall ESG performances of the sampled firms are quite good predictors of future CFP in the market. These results postulate that culmination of CSR best practices is a strategic undertaking that can lead to future value maximization for the firm by creating a favorable corporate image in the eyes of its stakeholders. From an international stand point, our findings assert that firms that strive to be an industry leader must optimize their score on ESG indicators so as to portray a favorable image in the minds of corporate stakeholders which will ultimately lead to enhanced operating and market performance for such firms. Conversely, firms that perform poorly in corporate social and environmental responsibility domains are penalized by the customers and investors which results in a negative brand image and lower share price in the stock market. Moreover, the findings suggest the utility of using ESG-based indices instead of financial ratios as benchmarks to build “green investment” and “sustainable finance” portfolios to create and sustain long-term “shared value.” We believe that this is our major contribution to the existing academic and practitioners’ literature.
However, the study is not without limitations. First, we only analyzed 100 best corporate citizen firms in the United States that perform very well in the environment, social, and governance domains. The future studies in this area can investigate the firms that have poor ESG performance to observe whether a low score on environment, social, and governance indicators translate to decreased corporate accounting and market performance for such firms. Furthermore, our sample is limited to the U.S. firms only therefore the results of this study can only be generalized to firms in countries with similar stage of economic development. Future studies can explore how the ESG and CFP nexus prevails in firms operating in developing and emerging economies. Nevertheless, it will be interesting to use an international sample of firms to examine the association between ESG performance and CFP.