
Abstract
Air pollution poses significant health and environmental challenges. This study estimates the determinants of PM2.5 air pollution across 31 European countries using a range of econometric techniques, including fixed effects, random effects, system GMM, SAR, SDM, SAR-GMM, and SDM-GMM models. Understanding how various socio-economic and environmental factors interact to influence PM2.5 levels is crucial for effective policymaking. The findings indicate that economic growth, renewable energy, environmental taxes, and research and development expenditures contribute to reducing PM2.5 levels. Conversely, urban population growth is associated with increased PM2.5, highlighting the need for improved urban planning. Spatial econometric models reveal a positive spillover effect, where pollution in one region can significantly impact neighboring areas. Additionally, the regressors exhibit important spatial effects on PM2.5 levels. Univariate analysis of Moran’s I reveals positive spatial autocorrelation in air pollution, while bivariate Moran’s I shows a clear spatial linkage between regressors and PM2.5 levels. Policy recommendations include promoting sustainable economic growth, investing in renewable energy, implementing environmental taxes, enhancing urban planning, increasing research and development, fostering international cooperation, and strengthening regulation.
Plain language summary
Air pollution is a serious issue. This study examines what causes PM2.5 pollution in 31 European countries. Economic growth, renewable energy, environmental taxes, and research help reduce PM2.5, while urban growth increases it, highlighting the need for better city planning.
Introduction
Air pollution through PM2.5 continues to be a serious challenge to the quality of the environment and human health (Abbas et al., 2024). Despite major regulatory drives and massive technological improvements aimed at reduction, PM2.5 is causing the highest health burden (Xu et al., 2025). It has major adverse health effects on both the respiratory and cardiovascular systems, leading to premature mortality (Brunekreef & Holgate, 2002). This chronic problem warrants an in-depth study to establish the elements driving PM2.5 pollution to design mitigation strategies (Lelieveld et al., 2015).
This study aims to provide actionable insights into how various socio-economic and environmental factors impact pollution levels across European countries, which is crucial for developing policies that not only reduce PM2.5 levels but also promote sustainable development. While much research has been conducted on the causes of air pollution, a more comprehensive perspective that incorporates economic activities, environmental policies, and spatial dimensions is still needed. The European Environment Agency (2019) highlights persisting air quality challenges across Europe despite existing policies, and the World Health Organization (2016) emphasizes the need for integrated solutions based on environmental and health data. This study seeks to fill this gap by analyzing the determinants of PM2.5 pollution, focusing on factors such as economic growth, renewable energy consumption, environmental taxes, and research and development expenditures.
Economic growth is typically linked to higher production and use of energy from factories, leading to increased greenhouse gas emissions (Grossman & Krueger, 1995; Stern, 2004). However, the nature of energy sources and the level of adoption of environmental regulations can influence this relationship. For instance, renewable energy can mitigate the environmental degradation associated with economic growth by reducing reliance on fossil fuels (Jiang et al., 2022). According to the International Energy Agency (2020), accelerating renewable deployment is central to reducing air pollutants, and the International Renewable Energy Agency (2019) reports significant cost reductions in clean energy, encouraging broader adoption. Environmental taxes are designed to reduce pollution by increasing the cost of polluting activities (Fullerton & Metcalf, 1997). These taxes lead industries to use more environmentally friendly technologies (OECD, 2010).
The relationship of time-averaged PM2.5 levels to research and development expenditures (RD), along with renewable energy consumption (REN) across 31 countries from the years 2005 through 2022, is illustrated visually in Figure 1. The levels of PM2.5 are plotted against the expenditures on RD on the y-axis and x-axis, respectively; the bubble sizes denote the share of REN, with larger ones indicating higher REN. Such data reveal that the average expenditure on RD is higher for Sweden and Finland, and the level of PM2.5 is low in these countries. In the case of PM2.5, it is found to be higher in those countries where an average lower expenditure on RD is prevalent. Again, the bubble size also identifies that REN is highest in Norway, Sweden, and Finland.

Average PM 2.5, RD, and Renewable Energy Consumption in Europe.
Yet another factor of importance in this analysis is urbanization. As the world’s population continues to urbanize, there will be an increase in PM2.5 emissions in cities due to the clustering of more vehicles and industries into the cities at a fast rate (Campos et al., 2007). Such an understanding of the link between urbanization and air pollution is important in the formulation of effective urban planning and pollution control measures that can manage and reduce pollution effectively in densely populated areas (United Nations, 2018).
RD investment is also a key driver of innovation in pollution control technology and practices (OECD, 2015; Popp, 2005). Greater expenditure on such investment can create new types of emissions abatement techniques, which may be adopted and help improve air quality. The present study uses an analytical framework, encompassing several non-spatial and spatial models. These advanced econometric techniques used in research enable the complicated interplay of different factors and their spatial and temporal spillover effects. It thus allows not just a detailed comprehension of how each factor can affect PM2.5 concentrations, but also captures a way in which nations are interdependent on one another (Anselin, 1988; Imbens & Manski, 2004).
This study makes a novel contribution by integrating spatial econometric techniques, specifically SAR, SDM, and spatial GMM models, with environmental and economic determinants of PM2.5 air pollution. Unlike earlier studies limited to one nation or non-spatial models, this research maps the spread of effects and spatial dependencies in 31 European countries, providing advice for concrete policy decisions. By identifying effective strategies to reduce air pollution, this research aims to inform policy design that balances economic growth with environmental sustainability. It also highlights the importance of regional collaborations and coordinated efforts to combat transboundary air pollution, ultimately contributing to better air quality and public health outcomes (Miller et al., 2007; World Health Organization, 2018). This study provides an in-depth analysis of the determinants of PM2.5 pollution and their spatial implications, offering valuable insights for policymakers. The spatial econometric models and Moran’s I analysis have brought useful insights into the effectiveness of policy and the challenges associated with different contributing factors. This is an essential contribution to what can be done in the policy that will improve air quality and protect public health.
Literature Review
The linkage between economic growth and PM2.5 has been thoroughly investigated. Most researchers agreed that it may exert a positive or negative influence on the quality of the air. For example, Stern (2004) studied the Environmental Kuznets Curve (EKC) theory, according to which the level of pollution is likely to increase at early stages of economic growth but start decreasing as countries become wealthy enough to invest in cleaner technologies and enforce more stringent regulations on the environment. The following non-linear relationship can be used to prove that, although the early periods of economic growth may only heighten problems such as air pollution, continued economic growth is met with improvement in the quality of air, which is typical of developed countries. In a related study, by Grossman and Krueger (1995), economic growth was also found to generate betterment in the environment; thus, above the threshold level of income confirms the EKC hypothesis. Moreover, Panayotou (1997) stated that economic growth can be decoupled from environmental degradation by policy intervention and technological development, meaning that precautionary action can reduce the detrimental effects of economic expansion on air quality.
Renewable energy sources are seen as a key factor in reducing PM2.5 emissions. Marques and Fuinhas (2012) found that countries with higher proportions of REN record dramatic decreases in levels of air pollution as reliance on fossil fuels diminishes. From the same point of view, Sovacool (2009) discussed the environmental benefits to be accrued from REN, saying that it lowers the amount of greenhouse gases being emitted into the atmosphere at the same time as it reduces particulate matter emissions. Y. J. Zhang et al. (2017) also confirmed that the use of REN is positively correlated with lower PM2.5 concentrations in China, and they emphasized the potential for similar impacts in Europe.
Environmental taxes can be used as an effective policy tool that can reduce air pollution through economic incentives for emission cuts. Fullerton and Metcalf (1997) made use of the double-dividend hypothesis, which states that environmental taxes reduce pollution and can be used to lower other taxes or fund public goods. Their study was able to derive much evidence in this regard, whereby it brings out environmental taxes as an effective means to reduce air pollution. Moreover, Wagner (2001) demonstrated that in Europe, these environmental taxes, through their tendencies to cause cleaner production technology and more energy-efficient use, have induced large drops in emissions of pollution other than CO2, such as PM2.5. Greenaway (1991) further pointed out that the system of environmental taxes helps internalize the external costs of pollution, therefore inducing environment-friendly behavior while lowering aggregate emissions.
Urbanization is known to increase PM2.5 levels significantly because of the increased concentrations of vehicles, industrial activities, and energy consumption in urban areas. Campos et al. (2007) showed that within-urban variability of air pollution levels may be great; in general, higher pollution concentrations are observed in densely populated urban centers. K. Zhang and Batterman (2013) showed that urban transportation policies also played important roles in shaping the air quality outcomes in urban areas, indicating that good policy design could offset the adverse impact of urbanization on air pollution.
RD is an important element that mitigates PM2.5 pollution by promoting innovations in clean technologies. Popp (2005) found that RD investments have effects on technological development, which reduces emissions of harmful pollutants, including PM2.5. According to that study, nations with high levels of RD spending tend to benefit much faster in the reduction of air quality. Aghion et al. (2016) elicited evidence regarding the increase in RD spending on green technologies associated with considerable decreases in pollution, since it offers a high incentive for innovation and adoption of green innovations. Horbach et al. (2012) highlighted the importance of eco-innovation that results from RD activity and leads to sustainable environmental outcomes over the long run. They observed that investment in RD can help achieve the key but very challenging environmental problems, such as air pollution.
While prior studies have explored the determinants of PM2.5 pollution, most are limited to single-country analyses or employ non-spatial econometric models that overlook geographic interdependencies. Few studies have systematically examined the role of spatial spillovers in PM2.5 pollution, especially considering multiple policy-relevant factors such as environmental taxes and research and development expenditure. This study fills this gap by applying advanced spatial econometric models, namely SAR, SDM, SAR-GMM, and SDM-GMM, to investigate both direct and indirect effects of these determinants in 31 European countries. By integrating spatial autocorrelation measures (univariate and bivariate Moran’s I) with spatial panel models, this research provides new insights into how national and neighboring country policies jointly influence air quality. This multi-dimensional approach not only extends the empirical literature on air pollution but also offers regionally tailored policy guidance for addressing transboundary pollution challenges in Europe.
Theoretical Framework
The theoretical framework of this study is based on environmental economics and spatial econometrics. It is thus an analysis of the determinants of PM2.5 air pollution in European nations. This section discusses theories and models underpinning the analysis, drawing from the EKC hypothesis, theories of innovation, and technological change.
The EKC theory indicates a nonlinear relationship between economic growth and environmental degradation. With the growth in the economy, countries may find that an increased level of environmental degradation is linked with growing industrial activity and the use of energy. After a threshold level of income is achieved, further growth in income levels enhances environmental quality because economies start spending more on clean technology and strengthening environmental policies (Abbas et al., 2022; Grossman & Krueger, 1995). This study considers the theory of EKC to verify how economic growth affects PM2.5 pollution. This hypothesis opines that an increase in the GDP may first increase pollution and later contribute to a decrease in pollution as countries invest in cleaner technologies.
Cross-border environmental cooperation is better captured when we apply SAR and SDM models in spatial econometrics. According to the models, pollution improvement in one nation can be affected by what happens in nearby countries, which makes it difficult to view each nation’s path alone. In the same way, environmental taxes may influence companies that trade, causing pollution changes in countries other than their own. When urban growth occurs, spatial models explain how another country’s rise in pollution can occur due to more transportation, energy needed, or nearby industrial activities. That’s why SAR and SDM provide a better way to assess how policies perform in linked regional economies.
Improvements in technological factors can reduce environmental pollution. The theory holds that firms react to environmental and regulatory binding constraints by innovating new technologies that reduce emissions (Popp, 2005). This study checks how RD investment contributes to the stimulation of technological changes that have an impact on reducing PM2.5. More RD means cleaner production and more efficient pollution control technologies (Aghion et al., 2016).
Another argument is that environmental taxation relies on the Pigovian tax theory, which posits that activities producing negative externalities must be taxed to correct market outcomes (Pigou, 1920). As such, environmental taxes make the external costs of pollution internal; thus, emitting pollutants becomes quite expensive. This gives firms and people the incentives to undertake more sustainable behavior and reduce pollution. This work investigates the effect of environmental tax on PM2.5 pollution by coming up with the hypothesis that increased rates of environmental taxes lead to significantly less pollution, because this is what gives people and firms the incentives to use cleaner technology and methods (Fullerton & Metcalf, 1997; Wagner, 2001).
Urbanization, reflected in the increasing size of cities and the movement of residents from rural to urban areas, has a clear effect on air pollution levels. Urban population density is higher; this increases the number of sources of vehicular emissions, industrial activities, and energy consumption, which contributes to PM2.5 increases in concentration (Campos et al., 2007). Urbanization is considered to impact PM2.5 pollution: greater urbanization would translate into increased pollution levels. The theoretical frameworks concerned with urban environmental management in the context of urbanization point toward the fact that strong urban planning and pollution control policies should work efficiently to reduce the adverse effects of urban expansion on air quality (K. Zhang & Batterman, 2013).
Air pollution varies geographically, so we need to understand how environmental results are influenced by connections between different areas. According to Tobler’s First Law of Geography, things near each other tend to be more related than those that are far apart (Tobler, 1970). The main idea in spatial analysis explains that pollution levels typically show autocorrelation because regions close to each other often have similar environmental circumstances and pollution exposure. According to the extended model by Baumol and Oates (1988), pollution leads to costs for others apart from the pollutants and their victims. When these consequences cross borders and impact other countries, they are known as spatial spillovers. The research model is reinforced by these theories, allowing the use of spatial econometric techniques to examine the factors causing air pollution.
Spatial econometrics allows for a methodological framework useful in analyzing spatial dependencies and spillover effects on air pollution across countries. A spatial econometric model allows for the fact that air pollution in one region may influence the neighboring regions’ air quality. This results from transboundary pollution and other spatial interactions. Such models provide the spatial dimensions of PM2.5 pollution; therefore, policy choices and factors influencing air quality in one country have consequences for its neighbors (Abbas et al., 2023). Using spatial econometrics, this study provides an in-depth analysis of what drives PM2.5 pollution and the effectiveness of different policy interventions.
This theoretical framework lays the foundation for an understanding of complicated interactions between economic growth, REN, environmental taxation, urbanization, RD, and spatial dependencies in the context of PM2.5 air pollution. It is only if these theories and models are integrated into a study that they would be able to shed light on the comprehensive determinants and spatial spillovers of air pollution, and consequently be in a position to design appropriate policy measures aimed at improving air quality.
Data Sources
This analysis is grounded in empirical research and makes use of a dataset that was gathered between 2005 and 2022 from the Organization for Economic Co-operation and Development (OECD) and the World Bank. The dataset is essential to the study’s analytical methodology because it contains data from 31 European nations. The selection of these European countries is based on the availability of data for the variables used in this study. Other European countries were excluded due to insufficient data for some of the variables. To ensure the accuracy and trustworthiness of the data, missing observations were accurately interpolated. All the variables involved in the study are described in Table 1.
Variable Details.
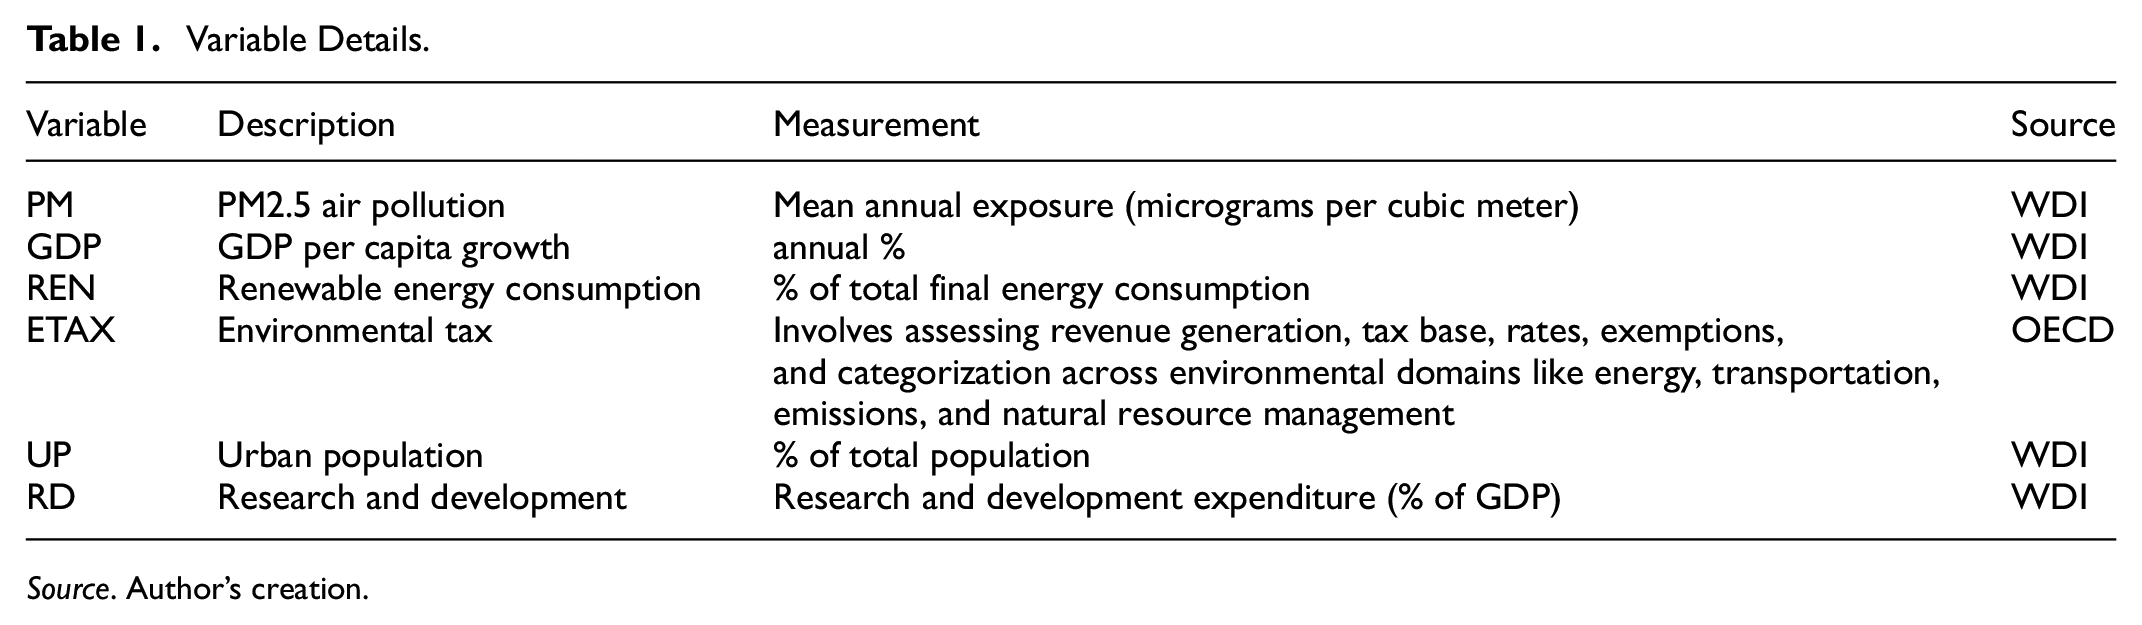
Source. Author’s creation.
Figure 2 clearly illustrates the disparities in average PM2.5 levels among European countries. It indicates that Bulgaria, Croatia, the Slovak Republic, Poland, Serbia, and Turkiye have higher PM2.5 levels compared to other countries. Conversely, Ireland, Finland, Norway, Portugal, and Sweden have the lowest PM2.5 levels. Such differences occur because of both industrial activities and the kinds of energy sources used. Regions with less PM2.5 concentrate on sustainability and are more likely to switch to cleaner energy than those with much higher air pollution. Addressing these issues is vital for both regional and global climate initiatives.

Average PM2.5 in 31 European Countries.
Methodology
Prior studies have investigated the factors that impact PM2.5 in several geographic regions. However, in the European context, there is a noticeable lack of systematic research specifically examining the PM2.5 creating impacts beyond the source environment. This study addresses this gap by analyzing the impact of GDP, REN, environmental tax, urbanization, and RD on PM2.5 levels in 31 European countries.
To ensure reliable findings, the research used balanced panel data, which is consistent from one time period to another and from one country to another. The assessment of variables influencing PM2.5 was done using different model specifications: non-spatial and spatial models. First, a non-spatial analysis was estimated with cross-section fixed effect (CFE), random effect (RE), and system generalized method of moments (GMM) models.
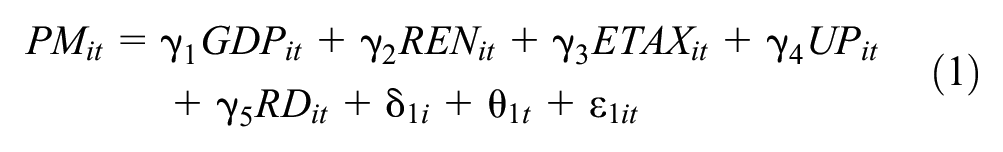
where Equation 1 presents the specification form of the non-spatial models estimated in this study. The coefficients γ’s represent the slopes of the regressors, while δ1i and θ1t denote the cross-section and time-fixed effects, respectively. The stochastic component ε1it is an error term assumed to be independently and identically distributed from the independent variables. As an extension to the above non-spatial analysis, this study further incorporates the Spatial Autoregressive (SAR) model and the Spatial Durbin Model (SDM) to test the spatial spillover effects of PM2.5 in Europe. Specifications of SDM and SAR models for this research are based on work by LeSage and Pace (2009). Some of the recent studies that used these models for spillover analysis in similar contexts include Abbas et al. (2023) and Cao et al. (2022).

where Equation 2 represents the SAR model’s specification used to estimate the components and spatial spillover effects of PM2.5. The spatial interdependence of PM2.5 across 31 European countries is indicated by Rho (ρ1). In the SAR model, δ2i denotes the cross-section fixed effects, while θ2t denotes the time-fixed effects. The term ε2it represents the error component. Equation 2 clearly illustrates that the slope coefficients of the independent variables are denoted by β’s.
The spatial spillover effects of PM2.5 are estimated by using the SDM specifications in addition to the SAR model. The SDM not only checks the spillover effect of the dependent variable but also examines the spillovers of the regressors. It reveals how the regressors in one country affect the PM2.5 levels of neighboring nations.

where Equation 3 shows the specification form of the SDM. The parameter Rho (ρ2) indicates the spatial spillovers of PM2.5. Here α coefficients of the weighted regressors reflect the spatial spillover effects of the regressors. In the SDM, δ3i represents the cross-section fixed effects, and θ3t denotes the time-fixed effects. The term ε3it represents the error component. The equation illustrated above shows that the slope coefficients of the regressors are denoted by α’s. To address potential endogeneity issues, this study also used System-GMM specifications for all the models.
This explanation clarifies that the 31 × 31 matrix W represents the geographical distances, measured in kilometers, between the 31 European countries. Additionally, W is normalized as suggested by Elhorst (2001). The assessment of spatial spillovers between neighboring countries is calculated by multiplying the variable’s parameter by the weight indicated as W. The Hausman Specification Test (HST) is employed to determine the optimal model for analysis when comparing CFE and RE models. The non-spatial models (CFE, RE, and GMM) are estimated to serve as robustness checks for additional models that account for connections between countries (SAR and SDM).
Local Moran’s I
This study employs Local Moran’s I (LMI), a fundamental statistic for measuring spatial autocorrelation, to evaluate the geographical interdependencies of PM2.5 in 31 European nations. Many studies have used LMI to analyze patterns of geographical clustering (Abbas & Iqbal, 2024a, 2024b). Initially, a kilometer-based weights matrix with dimensions of 31 × 31 is created to establish the spatial interconnections between observations. Subsequently, spatially lagged values are computed by calculating the average value of neighboring observations for each country.
The computation of LMI involves using standardized values, spatial weights, and the average PM2.5 levels across all 31 nations. It is essential to interpret LMI statistic accurately when evaluating spatial autocorrelation. A positive LMI value indicates the presence of spatial interdependencies, while a negative value suggests dispersion. Values close to zero imply the absence of significant spatial autocorrelation.

where Equation 4 represents the formula for LMI, where n denotes the number of observations, W represents the sum of spatial weights, wij represents the spatial weight between country i and j, xi, and xj denote the values of PM2.5 at country i and j, respectively, and
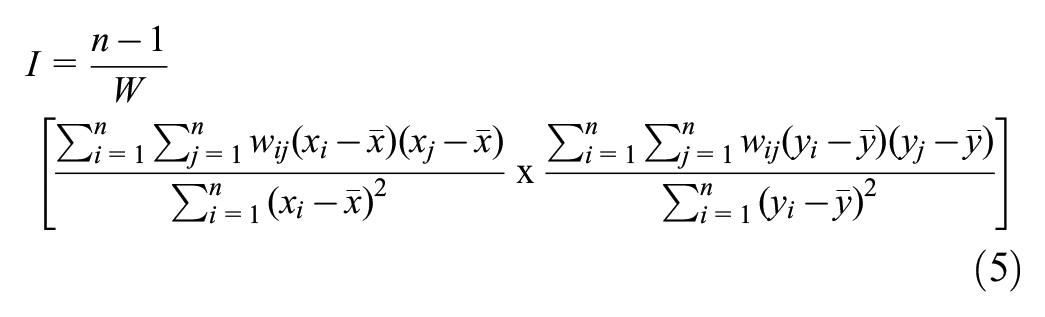
where Equation 5 demonstrates the bivariate LMI formula. Here, n represents the total number of countries, W is the sum of spatial weights, and wij is the spatial weight between countries i and j. Here xi and yi represent the values of two variables (e.g., PM2.5 and RD) at country i, while
Results and Interpretation
Table 2 displays the descriptive statistics of the variables investigated in this study, all of which influence PM2.5. These statistics offer a thorough summary of the average values and spread of the data, providing valuable insights into the patterns and connections between the variables.
Descriptive Statistics.

Source. Author’s estimation.
Additional analysis is conducted to assess multicollinearity by examining the variance inflation factors (VIFs), as presented in Table 3. Multicollinearity occurs when predictor variables in a regression model are highly correlated, which can compromise the reliability of regression coefficients and affect the interpretation of results. Generally, VIF values exceeding 10 indicate significant multicollinearity, while values below 5 are considered acceptable. The analysis revealed that all VIF values are below the critical threshold of 5, indicating the absence of substantial multicollinearity and confirming the robustness of the regression model.
Variance Inflation Factor.
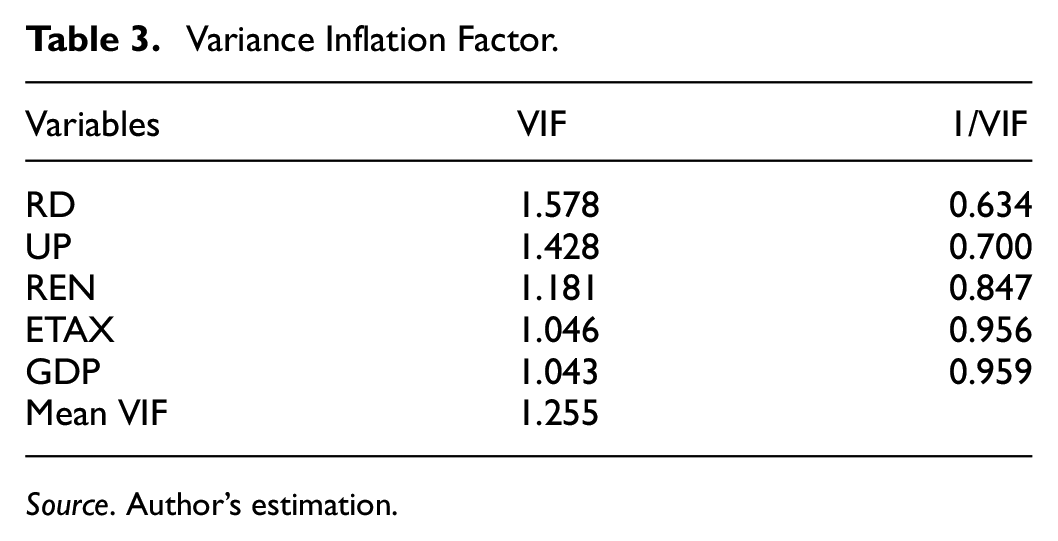
Source. Author’s estimation.
Table 4 presents the results of the non-spatial models for determining the factors influencing PM2.5, considering three specifications: CFE, RE, and GMM. The HST result (68.82***) indicates a preference for the CFE model over the RE model due to significant differences between the models’ estimates.
Determination of PM2.5 Air Pollution through Non-Spatial Models.

Source. Author’s estimation.
**p < .01, **p < .05, *p < .1 (Standard Error values are in parentheses).
GDP is negatively associated with PM2.5 levels, with coefficients of −0.028**, suggesting that higher economic growth contributes to lower PM2.5 levels. However, this relationship is not significant in the System GMM model. As GDP increases, economies can afford cleaner technologies and better pollution control mechanisms, leading to lower pollution levels. This aligns with the EKC theory, which holds that pollution first rises with economic development but finally falls as nations get richer and fund greener technologies (Stern & Dijk, 2016).
REN consistently shows a significant negative impact on PM2.5 levels across all models. The coefficients are −0.211*** in the CFE model and −0.042*** in the System GMM model. Increased use of renewable energy reduces dependence on fossil fuels, thereby lowering emissions of pollutants such as PM2.5 (Rathod et al., 2022).
Environmental tax exhibits a significant negative impact on PM2.5 levels in all three models. The coefficients are −1.034*** for the CFE model and −0.193** for the System GMM. Environmental taxes offer incentives to firms and individuals by internalizing the externality of environmental damage costs through reducing pollution (Li, 2023).
In the CFE model, the urban population is negatively related to PM2.5 with coefficients of −0.230***, but it becomes insignificant in the System GMM model. The possible reason is that an urban area may have better infrastructural and regulatory institutions for controlling pollution as compared to a rural one. Besides, according to Wang et al. (2023), urbanization may generate economies of scale in pollution control and set up more efficient public transport systems, which would lead to an overall cut in pollution.
RD has a significant negative effect on PM2.5, with coefficients of −1.526*** in the CFE model and −0.543*** in the System GMM model. While RD is rising, it will prompt the development of cleaner technology and more productive processes to reduce pollution (Petrović & Lobanov, 2020). This is in line with endogenous growth theory, which emphasizes the promoting role of technological innovation in sustainable growth. Similar results are found to exist in the study by Xiong et al. (2020). The R-squared values indicate a good fit. The F-test and Wald Chi-square statistics are highly significant, confirming the overall robustness and explanatory power of the models.
Table 5 presents the estimation results of the SAR models to find out which are the influencing factors of PM2.5 air pollution. From the HST, the preferred model can be chosen as the SAR-CFE model over the SAR-RE model. In the SAR-System GMM model, the lagged PM2.5 has a highly significant positive effect (0.816***), indicating that previous levels of PM2.5 strongly influence current levels. The coefficient for the spatial lag of PM2.5 (rho) is also significant and positive (0.850***), demonstrating that PM2.5 pollution in one country is significantly affected by PM2.5 levels in neighboring countries. This indicates the persistence of PM2.5 pollution over time and the spatial spillover effect, where pollution in one region affects neighboring regions. This highlights the importance of regional cooperation and policies targeting air pollution, as localized efforts may not be sufficient to mitigate pollution effectively. The spatial dependency suggests that air pollution control measures should consider transboundary pollution and involve collaborative strategies.
Determination of PM2.5 Air Pollution Through Spatial Autoregressive Models.

Source: Author’s Estimation.
**p < .01, **p < .05, *p < .1 (Robust Standard Error in parentheses).
In the SAR-CFE model, GDP is negatively associated with PM2.5 levels, with a coefficient of −0.012*, suggesting that higher economic growth contributes to lower PM2.5 levels. This linkage is insignificant in the SAR-GMM model. An augmenting GDP might help reduce PM2.5 air pollution by being able to invest in cleaner technologies and having stricter regulations, as proved by the hypothesis of EKC in developed countries (Nigatu, 2015). REN exerts a significant negative effect on PM2.5 in the SAR-CFE model, with its coefficient being −0.050***. Increased REN will further reduce PM2.5 emissions by decreasing the dependence on fossil fuel power because wind and solar power produce very minimal air pollution, one of the key factors in sustainable development (Abbas et al., 2024; Koengkan et al., 2021).
In the SAR-CFE model, environmental tax turned out to exert a significant negative influence on PM2.5 levels with a coefficient of −0.738***. Internalizing environmental costs through environmental taxation gives incentives for pollution reduction since that makes the case for cleaner technologies very clear and is in line with Pigovian tax theory to correct market failures (Han & Li, 2020). The urban population does not indicate any significant association with levels of PM2.5. The linkage of urbanization with air pollution can become very complex. Better infrastructure may reduce pollution, but higher population density and more industries may increase it, hence requiring specific urban planning and control measures (Kim et al., 2021).
RD shows a significant negative impact on PM2.5 levels in the SAR-CFE model, with a coefficient of −0.702**, and in the SAR-System GMM model, with a coefficient of −0.331**. Increased RD expenditure develops cleaner technologies and efficient processes, reducing pollution and supporting sustainable growth through innovation (Fernández et al., 2018).
The spatial lag of PM2.5 (rho) is significant and positive in both the SAR-CFE (0.850***) and SAR-GMM (0.136***) models, indicating that PM2.5 pollution in one country is significantly affected by PM2.5 levels in neighboring countries. It suggests that air pollution control measures need to consider transboundary pollution. Policies should not only focus on reducing local emissions but also collaborate with neighboring countries to effectively mitigate air pollution. This emphasizes the importance of regional cooperation and integrated approaches to environmental management.
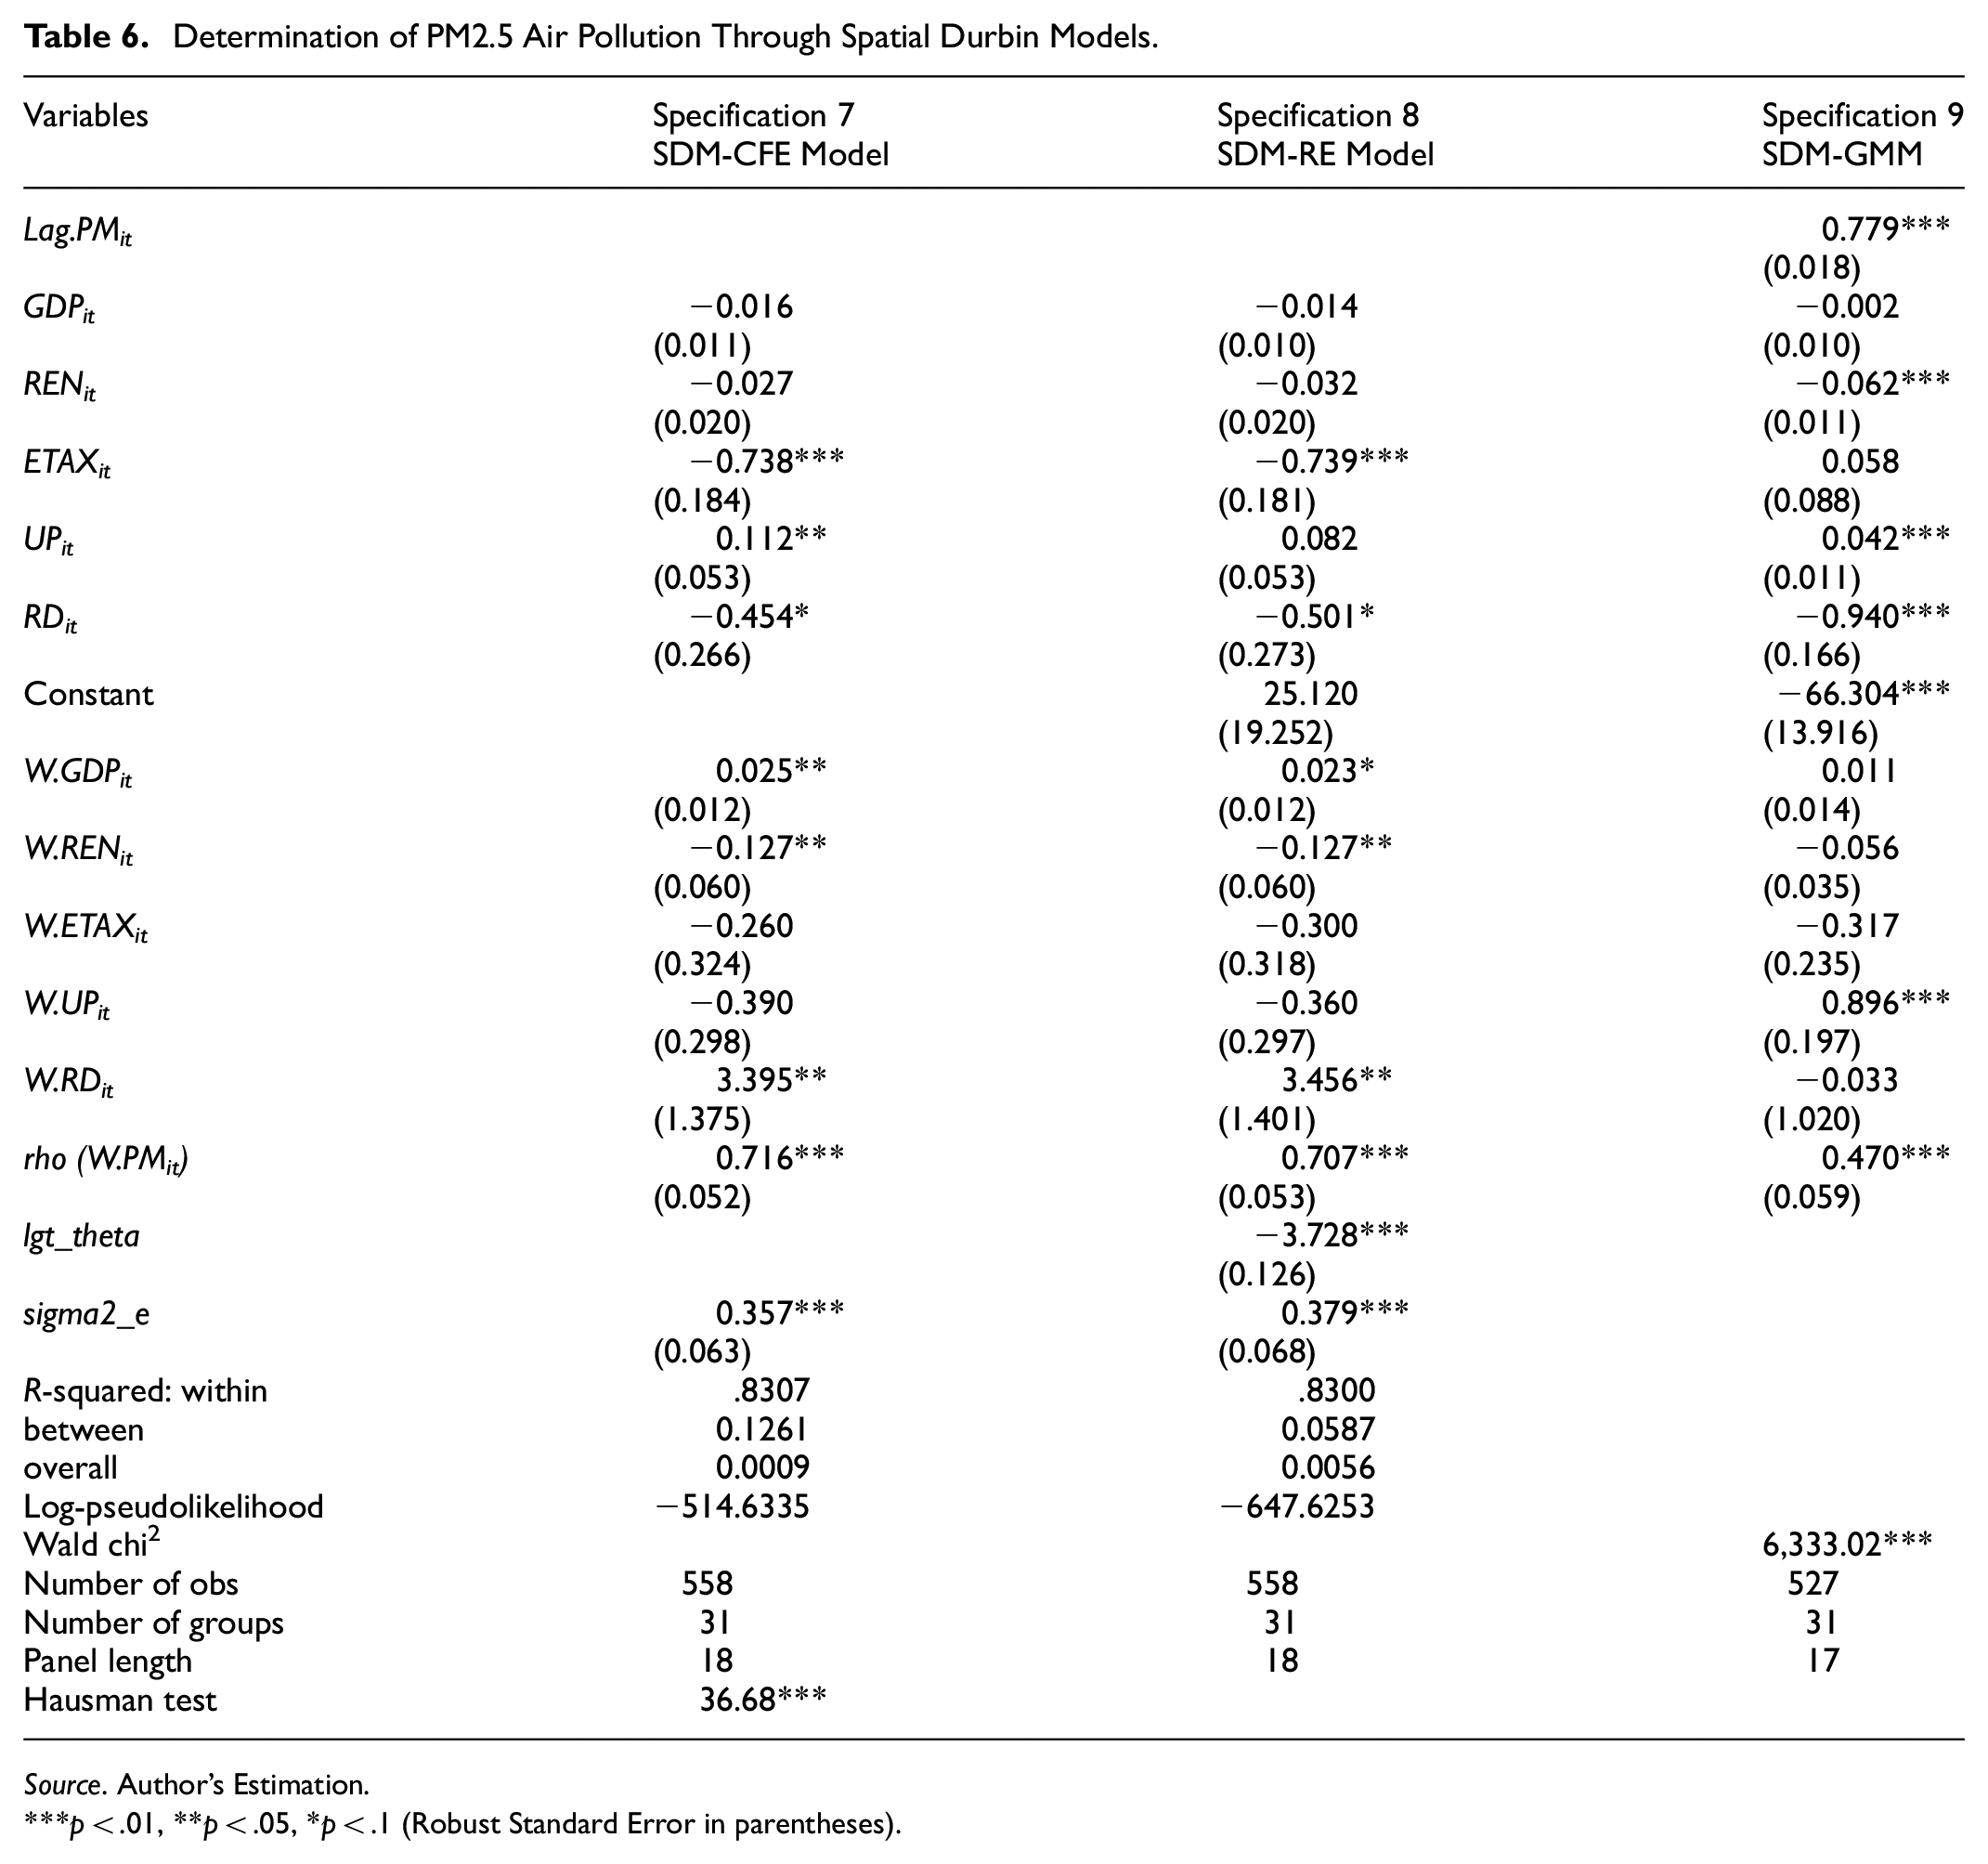
Table 6 presents the results of the SDM for determining the factors influencing PM2.5 air pollution. The HST indicates that the SDM-CFE model is preferred over the SDM-RE model. In the SDM-GMM model, the lagged PM2.5 has a highly significant positive effect (0.779***), indicating that previous levels of PM2.5 strongly influence current levels. The coefficient for the spatial lag of PM2.5 (rho) is also significant and positive (0.716***), demonstrating that PM2.5 pollution in one country is significantly affected by PM2.5 levels in neighboring countries. This persistence of PM2.5 pollution over time and its spatial spillover effect emphasize the need for regional cooperation and policies targeting air pollution. It highlights that localized efforts may not be sufficient to mitigate pollution effectively, and collaborative strategies involving multiple regions are crucial.
Determination of PM2.5 Air Pollution Through Spatial Durbin Models.
Source. Author’s Estimation.
**p < .01, **p < .05, *p < .1 (Robust Standard Error in parentheses).
In the SDM-CFE model, GDP is negatively related to PM2.5 levels. This result echoes the fact that economic growth will ensure an improvement in environmental quality and more investment of resources in pollution control on a corresponding basis. In general, a country usually enforces more difficult environmental standards and applies cleaner technology while becoming wealthier, which then results in lower pollution levels (Meng et al., 2019).
REN shows a significant negative impact on PM2.5, with a coefficient of −0.062*** in SDM-GMM. Renewable energy ushers in a switch to clean sources of energy, reducing over-reliance on fossil fuels. This appreciably reduces pollution due to enhanced energy efficiency. (Abbas et al., 2023). The environmental tax coefficient is −0.738***, indicating that there is a significant negative impact of environmental tax on PM2.5 within the framework of the SDM-CFE model. This is because environmental taxes make companies and individuals pay for pollution, finance green technologies and initiatives, and promote cleaner production and energy use through their collections (Krass et al., 2013).
Under the SDM-CFE model, the urban population has a positive linkage with PM2.5 levels: 0.112**, and it is also significant within the SDM-GMM model: 0.042***. Urban areas most often have higher levels of PM2.5 because of increased industrial activity, increased traffic of vehicles, and high consumption of energy. In contrast, well-planned urbanization with due consideration for pollution control measures might reduce these impacts (Luo et al., 2021).
RD has a significant negative effect on PM2.5 under the SDM-CFE model, whose coefficient is -0.454*, and in the SDM-GMM model, the coefficient is −0.940***. Investing in research and development fosters innovative technologies that significantly lower PM2.5 levels. Over time, this progress is driven by advancements in clean energy, enhanced pollution control measures, and the adoption of sustainable practices (Xiong et al., 2020).
The spatial lag of GDP (W.GDPit) is significantly positive in the SDM-CFE model: 0.025**. This result suggests that higher GDP in neighboring countries exerts a positive influence on PM2.5 locally. Since there are supposed to be cross-border environmental impacts through trade and industrial linkages, economic activities in neighboring countries are likely to raise local environmental pollution. High economic growth in one country may stimulate demand for goods produced in the neighboring country, leading to an increase in the latter’s production, probably raising emissions. The interconnectedness of these issues underlines the need for regional economic and environmental policy (Abbas et al., 2023).
The spatial lag of REN (W.RENit) shows a significant negative impact in the SDM-CFE model (−0.127**), suggesting that higher REN in neighboring countries reduces local PM2.5 levels. The REN technologies and practices across borders can lead to broader regional benefits. Neighboring countries adopting renewable energy can share best practices, technologies, and policies, leading to a collective reduction in emissions. It demonstrates that partnership and exchanging information between countries help encourage the use of renewable energy and lower pollution (Mahmood, 2022).
The spatial lag of urban population (W.UPit) is significantly positive in the SDM-GMM model, with a coefficient of 0.896***, showing that higher urbanization in neighbors leads to a higher local PM2.5 level. Urbanization in one country may influence the level of pollution in neighboring countries through regional economic integration and shared infrastructure. High urbanization is followed by tall heights of industries, traffic, and energy consumption. All these can overflow into affecting air quality in neighboring regions, bringing out the need for coordinated planning at a regional level when it comes to urban planning and pollution control measures (Du et al., 2018).
Figure 3 represents the Univariate LMI analysis of the average PM2.5 levels of 31 European countries. Panel A indicates the statistical significance of LMI values for PM2.5. Different shades of green indicate different degrees of significance: dark green areas with p = .001 have a very significant LMI value. Grey areas stand for the regions where the LMI values are not statistically significant.

Univariate LMI analysis of average PM2.5.
The Univariate LMI analysis of average PM2.5 levels across 31 European countries is depicted in Figure 3, which consists of three panels: a significance map (Panel A), a cluster map (Panel B), and a Moran scatter plot (Panel C). Panel A illustrates the statistical significance of LMI values for PM2.5 levels. Different shades of green indicate varying levels of significance, with dark green areas (p = .001) denoting regions with highly significant LMI value, medium green areas (p = .01) indicating moderate significance, and light green areas (p = .05) reflecting relatively less significance. Grey areas represent regions where the LMI values are not statistically significant. This map highlights regions with significant clusters of high or low PM2.5 levels, indicating spatial autocorrelation.
Panel B categorizes regions into different types of spatial clusters based on the LMI analysis. Red areas represent “High-High” clusters, where regions with high PM2.5 levels are surrounded by other regions with high PM2.5 levels. This indicates that PM2.5 levels in one country tend to spill over into neighboring regions. Blue areas indicate “Low-Low” clusters, where regions with low PM2.5 levels are surrounded by other regions with low PM2.5 levels. Light blue areas denote “Low-High” clusters, where regions with low PM2.5 levels are surrounded by regions with high PM2.5 levels. Grey areas represent regions where the clustering is not significant. This clustering helps identify areas with similar PM2.5 pollution levels and potential spatial dependencies.
Panel C, the Moran Scatter Plot, plots the average PM2.5 levels against their spatially lagged values, providing a visual representation of spatial autocorrelation. The slope of the trend line indicates the strength and direction of this spatial relationship, with a positive slope suggesting positive spatial autocorrelation. The LMI value of 0.302 signifies positive spatial autocorrelation, meaning that regions with high (or low) PM2.5 levels tend to be near other regions with similar levels.
Figure 4 presents a bivariate LMI analysis of average PM2.5 and GDP across 31 European countries. Panel A illustrates the statistical significance of LMI values for the relationship between PM2.5 levels and GDP. Different shades of green represent varying levels of statistical significance. This map highlights areas where the correlation between PM2.5 and GDP is significant, indicating potential spatial dependencies.

Bivariate LMI analysis of average GDP and PM2.5.
Panel B categorizes regions into different types of spatial clusters based on the LMI analysis of PM2.5 and GDP. Red areas represent “High-High” clusters, where regions with high GDP are surrounded by other regions with high PM2.5 levels. The “High-High” PM2.5 and GDP clusters suggest industrial hubs with shared pollution burdens. Blue areas indicate “Low-Low” clusters, where regions with low GDP are surrounded by other regions with low PM2.5 levels. Light blue areas denote “Low-High” clusters, where regions with low GDP are surrounded by regions with high PM2.5. Light red areas represent “High-Low” clusters, where regions with high GDP are surrounded by regions with low PM2.5. This clustering helps identify areas with spatially correlated patterns of GDP and PM2.5 pollution.
Panel C plots the average GDP against the lagged average PM2.5 levels, providing a visual representation of their spatial autocorrelation. The LMI value of 0.076 signifies positive spatial autocorrelation, meaning that regions with high (or low) GDP levels tend to be near other regions with similar PM2.5 levels, but the relationship is not very strong.
Figure 5 presents a bivariate LMI analysis of average REN and PM2.5. Panel A illustrates the statistical significance of LMI values for the relationship between REN and PM2.5 levels. Different shades of green represent varying levels of statistical significance. This map highlights areas where the link between REN and PM2.5 is spatially significant, indicating potential spatial dependencies.

Bivariate LMI analysis of average REN and PM2.5.
Panel B categorizes regions into different types of spatial clusters based on the LMI analysis of REN and PM2.5. Red areas represent “High-High” clusters, where regions with high REN are surrounded by other regions with high PM2.5 levels. Blue areas indicate “Low-Low” clusters, where regions with low REN are surrounded by other regions with low PM2.5 levels. Light blue areas denote “Low-High” clusters, where regions with low REN are surrounded by regions with high PM2.5. Light red areas represent “High-Low” clusters, where regions with high REN are surrounded by regions with low PM2.5. This indicates that when countries adopt renewable energy, its beneficial effects spill over into neighboring regions. This clustering helps identify areas with spatially correlated patterns of REN and PM2.5 pollution.
Panel C plots the average REN against the lagged average PM2.5 levels, providing a visual representation of their spatial autocorrelation. The slope of the trend line indicates the strength and direction of this spatial relationship, with a negative slope suggesting negative spatial autocorrelation. The LMI value of −0.131 signifies negative spatial autocorrelation, meaning that regions with high REN levels tend to be near other regions with low levels of PM2.5. This relationship suggests that higher REN in one region is associated with lower PM2.5 levels in neighboring regions.
Figure 6 presents a bivariate LMI analysis of average ETAX and PM2.5 levels. Panel A illustrates the statistical significance of LMI values for the relationship between ETAX and PM2.5 levels. This map highlights areas where the link between ETAX and PM2.5 is spatially significant, indicating potential spatial dependencies.

Bivariate LMI analysis of average ETAX and PM2.5.
Panel B categorizes regions into different types of spatial clusters based on the LMI analysis of ETAX and PM2.5. Red areas represent “High-High” clusters, where regions with high ETAX are surrounded by other regions with high PM2.5 levels. Blue areas indicate “Low-Low” clusters, where regions with low ETAX are surrounded by other regions with low PM2.5 levels. Light blue areas denote “Low-High” clusters, where regions with low ETAX are surrounded by regions with high PM2.5. Light red areas represent “High-Low” clusters, where regions with high ETAX are surrounded by regions with low PM2.5.
Panel C plots the average ETAX against the lagged average PM2.5 levels, providing a visual representation of their spatial autocorrelation. The positively sloped scatter plot suggests positive spatial autocorrelation. The LMI value of 0.074 signifies weak positive spatial autocorrelation, meaning that regions with high ETAX levels tend to be near other regions with high PM2.5 levels, but the relationship is not very strong.
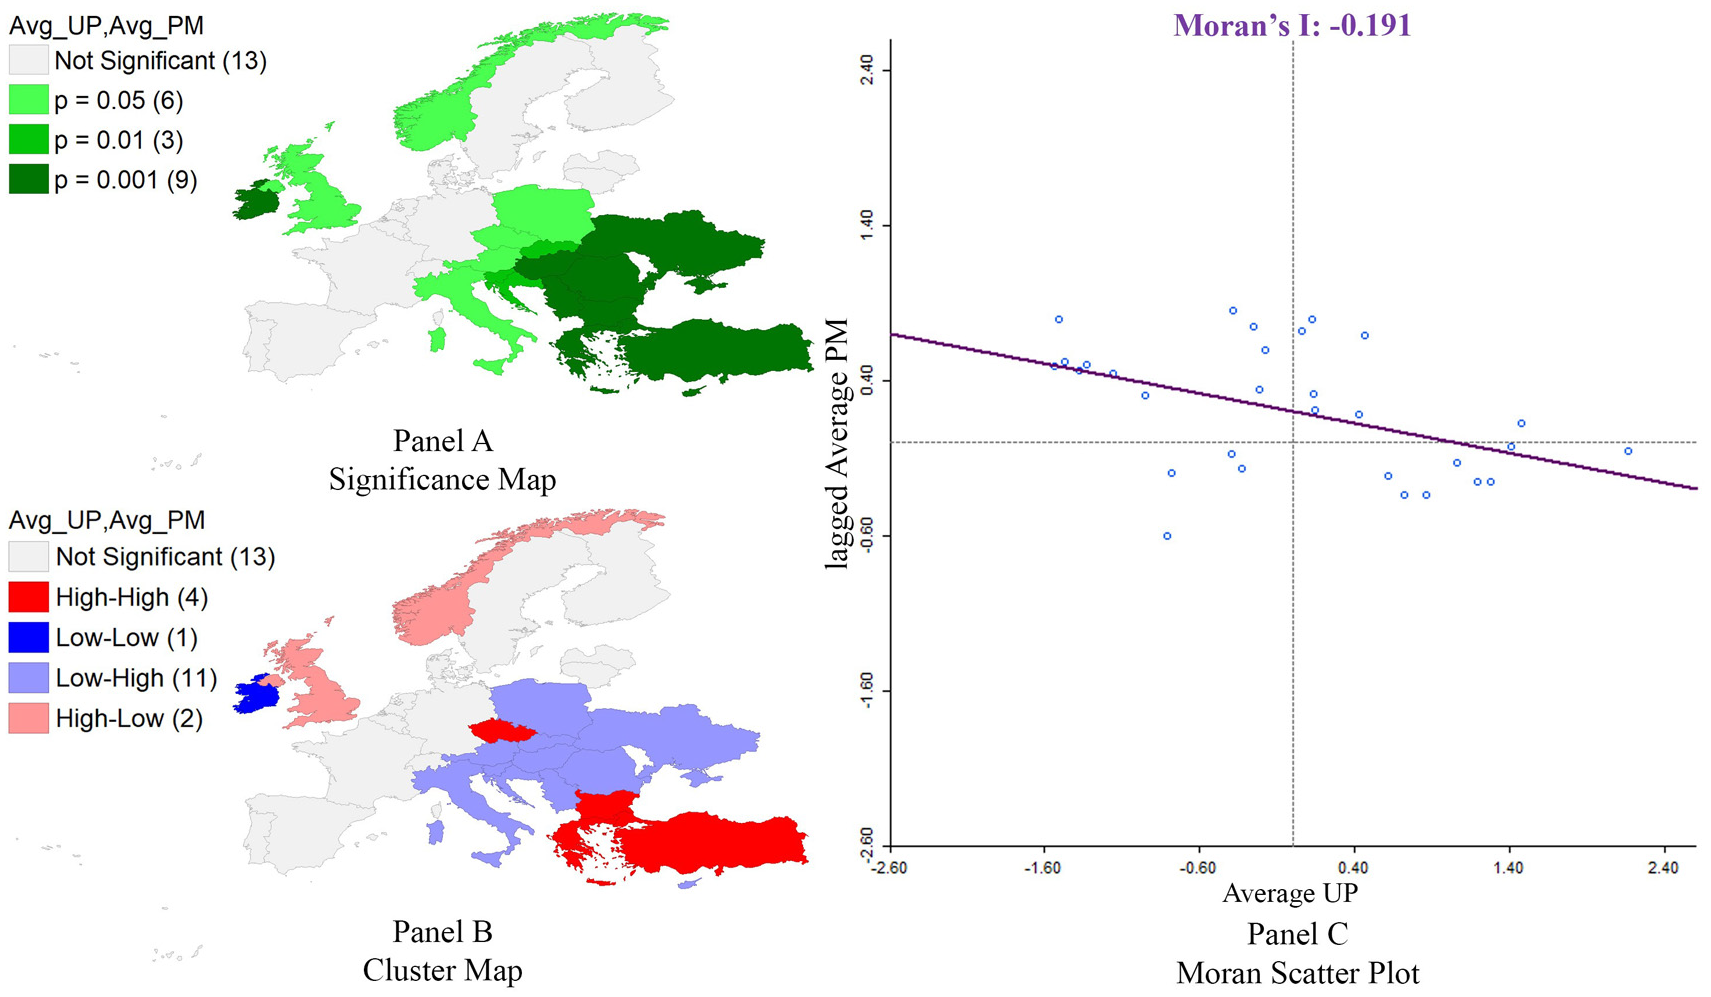
Figure 7 presents a bivariate LMI analysis of average UP and PM2.5. Panel A illustrates the statistical significance of LMI values for the relationship between UP and PM2.5 levels. This map highlights areas where the link between UP and PM2.5 is spatially significant, indicating potential spatial dependencies.
Bivariate LMI analysis of average UP and PM2.5.
Panel B categorizes regions into different types of spatial clusters based on the LMI analysis of UP and PM2.5. Red areas represent “High-High” clusters, where regions with high UP are surrounded by other regions with high PM2.5 levels. Blue areas indicate “Low-Low” clusters, where regions with low UP are surrounded by other regions with low PM2.5 levels. Light blue areas denote “Low-High” clusters, where regions with low UP are surrounded by regions with high PM2.5. Light red areas represent “High-Low” clusters, where regions with high UP are surrounded by regions with low PM2.5. This clustering helps identify areas with spatially correlated patterns of UP and PM2.5 pollution.
Panel C plots the average UP against the lagged average PM2.5 levels, providing a visual representation of their spatial autocorrelation. The slope of the trend line indicates the strength and direction of this spatial relationship, with a negative slope suggesting negative spatial autocorrelation. The LMI value of −0.191 signifies negative spatial autocorrelation, meaning that regions with high UP levels tend to be near other regions with low levels of PM2.5. This relationship suggests that higher urban populations in one region are associated with lower PM2.5 levels in neighboring regions, although the relationship is relatively weak.
Figure 8 presents a bivariate LMI analysis of average RD and PM2.5. Panel A illustrates the statistical significance of LMI values for the relationship between RD and PM2.5 levels. This map highlights areas where the correlation between RD and PM2.5 is spatially significant, indicating potential spatial dependencies.

Bivariate LMI analysis of average RD and PM2.5.
Panel B categorizes regions into different types of spatial clusters based on the LMI analysis of RD and PM2.5. Red areas represent “High-High” clusters, where regions with high RD are surrounded by other regions with high PM2.5 levels. Blue areas indicate “Low-Low” clusters, where regions with low RD are surrounded by other regions with low PM2.5 levels. Light blue areas denote “Low-High” clusters, where regions with low RD are surrounded by regions with high PM2.5. This suggests that countries with lower RD investment may contribute to higher PM2.5 levels in neighboring countries through negative spillover effects. Light red areas represent “High-Low” clusters, where regions with high RD are surrounded by regions with low PM2.5.
Panel C plots the average RD against the lagged average PM2.5 levels, providing a visual representation of their spatial autocorrelation. The strength and direction of this spatial relationship come through the slope of the trend line; the negative slope indicates negative spatial autocorrelation. LMI value of −0.204 suggests that there is negative spatial autocorrelation, where high RD level regions are neighbors with low-level PM2.5 regions. Such a relationship can be interpreted to mean that a high RD in one region is concomitant with low prevailing levels of PM2.5 in the neighboring regions.
Figure 9 presents a comprehensive summary of the results, illustrating the relationships between the key variables in a single diagram. The figure indicates that all regressors are negatively associated with air pollution, except for the urban population, which shows a positive relationship.

Summary of results.
Discussion
This study applies spatial econometric techniques to explore what leads to PM2.5 air pollution in 31 European countries. The results reveal some interesting facts that strongly influence environmental policy. It is clear from their results that rising GDP per capita tends to lower PM2.5 pollution, as predicted by the EKC hypothesis. Such findings indicate that more growth in high-income countries might mean better results for the environment because they tend to add cleaner technologies and tougher regulations. Yet, the effect was inconsistent in several models, signaling that growing the economy by itself might not be enough without combined work on sustainability.
REN strongly and significantly showed a negative linkage with PM2.5 levels. It points out that choosing clean energy over fossil fuels is effective at cutting air pollution. The spatial spillover measured by the SDM model illustrates that using renewable energy can benefit entire regions. In addition to using its sources of renewable energy, a nation can also gain from its neighbors’ efforts through collaborative initiatives in energy and the environment.
The study found that stronger ETAX reduced air pollution. It demonstrates that market tools help include environmental costs and push businesses to be more environmentally responsible. Even so, because the spillovers are limited for ETAX, perhaps these policies influence localized effects and would benefit more from being standardized across countries.
UP is generally positively related to PM2.5 pollution. This result highlights how activities linked to urbanization create more environmental complications, for example, more vehicles on the roads, extra energy needs, and a cluster of industrial sites. The results also show that the spatial lag of UP is significant and positive, suggesting there is some impact of urbanization in one country on pollution in nearby countries, most likely due to regional trade, increased vehicle movements, or joint emissions between nearby countries. The findings point out that using both integrated urban planning and regional cooperation is necessary to overcome air pollution.
Furthermore, RD spending is found to have a negative impact on PM2.5, as expected by theory, since innovation can improve environmental efficiency. Improvements in pollution control and green inventions in one country affected both its air quality and that of nearby countries.
This research points to the need for policies that mix environmental taxes, organizational changes like urban planning, and funding for technology and renewable energies. Also, the close linkage between factors in this study indicates that air pollution control should not be planned separately. For all countries to be environmentally sustainable, cooperation across borders and accord in regional policies are necessary. These findings are important for European policymakers involved in ongoing regional climate projects. The findings show that linking countries in economic, environmental, and technological ways results in shared improvements in air quality.
Conclusion
This study examines the determinants of PM2.5 air pollution in 31 European countries, employing an advanced econometric approach and integrating CFE, RE, SAR, SDM, and system GMM model specifications. From the analysis, GDP, REN, ETAX, UP, and RD are elicited as critical determinants of PM2.5 levels, critical information to the environmental agencies and policymakers. The results show that economic growth pulls back PM2.5 levels. These afford countries on the global divide opportunities such as the implementation of cleaner technologies, investment options, and stringent environmental regulations, all of which help reduce PM2.5 levels. This would strongly hint at the need for sustainable policies on the economic front that would balance growth with environmentally healthy practices.
REN stands out as a critical variable in the reduction of PM2.5 levels. The high negative impact of renewable energy on air pollution just confirms, even more strongly, how policies promoting the transition from fossil fuels to cleaner energies are potent. This transformation is a prerequisite for long-term air quality improvements, as well as a reduction in health risks from PM2.5 pollution.
Environmental taxes on emissions have proven to be efficient in restraining PM2.5 pollution through the internalization of external costs. They increase the cost of emissions, thereby driving the industries toward cleaner technologies and bringing down environmental damage. The revenue obtained from environmental taxes can be recycled to use in green projects and further increase the positive impacts on air quality.
UP is positively linked with high PM2.5 levels, which suggests the challenges caused by urbanization. Urban areas are highly populated with high numbers of vehicles, industrial activities, and energy consumption, which increases the level of pollution. Appropriate planning of cities and pollution control measures are to be taken to reduce such impacts and improve air quality in fast-growing cities. RD has a significant negative impact on PM2.5 levels, and this explains the fact that innovation helps to solve environmental challenges. Higher RD spending will develop new advanced pollution control technologies and sustainable practices for reduction in emissions and better quality air.
The results estimated by the SAR and SDM also underline significant spatial dependencies and spillover effects, which means that PM2.5 pollution in one nation affects air quality in the neighboring countries and therefore would demand international support. According to the SDM results, spatial lags of GDP, REN, UP, and RD all turn out to be significant in impacting PM2.5 levels. This indicates that economic activities, energy policies, and urbanization in neighboring countries are likely to have huge cross-border impacts on ambient air quality. While system GMM helps address endogeneity concerns, limitations remain, especially regarding the potential weak instrumentation of RD. Future studies could benefit from external instruments or firm-level data to more precisely identify the causal effects of RD on air pollution.
LMI analysis is done for the price discovery mechanism to find plausible evidence of spatial dependencies in transboundary pollution. The univariate LMI analysis indicates that the PM2.5 levels have a positive spatial autocorrelation; thus, a high level of PM2.5 tends to be geographically clustered. The result confirms the notion that air pollution in one country would have huge impacts on neighbors and thus requires regional concerted efforts and international collaboration to fight PM2.5 pollution. In effect, these spatial interdependencies should be dealt with by policies and strategies so that comprehensive and long-term improvements in air quality can be achieved. Applying bivariate LMI analysis, spatial clustering of the regressors with levels of PM2.5 is found to follow apparent patterns, which would be greatly useful to policymakers when developing strategies that are region-specific and more target-oriented to combat air pollution.
Policy Recommendations
The findings come up with several policy recommendations to effectively deal with PM2.5 air pollution. First of all, there has to be a promotion for the sustainable growth of the economy. Activating industries to implement cleaner technologies through subsidies, tax incentives, and regulatory support is a must before trying to install regulations promoting sustainable industrial practices while penalizing over-pollution to maintain a fine balance between economic growth and green sustainability.
More money should be invested in REN source development and deployment, particularly the major ones, which are wind and solar power. Attitudes are equally important: with financial incentives and drastic reductions in bureaucratic red tape, governments can attract the private sector into investing in renewable energy projects and hence reduce dependence on fossil fuels and PM2.5. Environmental taxes should be introduced and promoted to internalize the external costs of pollution by increasing the cost for the emitter of pollutants. To mitigate transboundary pollution spillovers, European countries should harmonize environmental tax rates and standards across borders. It can minimize the risk of pollution leakage and foster coordinated action against air pollution. These revenues could be used for investing in clean energies and improving public transport, as well as promoting control over pollution.
Policies on urban planning and pollution control should be strengthened to mitigate the environmental impact of urbanization. Urban planning policies focused on promoting public transport, implementing emission standards for vehicles, and developing green spaces for better air quality in towns can be designed. Moreover, green building standards and energy efficiency in the case of projects on urban development can help counter PM2.5 levels due to the negative impact of population growth in urban areas.
The other critical recommendation is increasing RD. Financing research and development in clean technologies and pollution control methodologies, driven by both the public and private sectors as well as academia, would incentivize innovation to come up with ever more advanced technologies for pollution control and sustainable practices. Moreover, assistance to pilot projects and the commercialization of innovative solutions that reduce air pollution can be promoted.
Regional and international collaboration over matters concerning transboundary air pollution should be encouraged. Governments can adopt joint regional and international strategies through the agreements reached on monitoring, data sharing, and policy implementation to manage the spatial dependencies and transboundary pollution effects identified by the study. These efforts may, in addition, be further strengthened through cross-border environmental agreements that set common standards and goals for the improvement of air quality.
Improved regulatory frameworks are essential in ensuring environmental regulations are implemented in their totality. The regular review and update of air quality standards according to the latest scientific evidence is very instrumental in the protection of public health. An equally important intervention will be a comprehensive air quality management plan combining national and local initiatives aimed at reducing PM2.5 pollution, hence coordinating activities on air pollution management.
Footnotes
Consent for Publication
The author give permission for this paper to be published.
Author Contributions
Funding
The author received no financial support for the research, authorship, and/or publication of this article.
Declaration of Conflicting Interests
The author declared no potential conflicts of interest with respect to the research, authorship, and/or publication of this article.
Data Availability Statement
The Data used in present study will be available on a reasonable request.