
Abstract
There is a consensus among scholars that low-carbon development has become the means to achieve sustainable development in China. The Yangtze River Delta urban agglomeration (YRDUA) undoubtedly plays a key role in advancing this goal. This study brings government environmental governance (GEG), green finance (GF), and carbon emission performance (CEP) into a unified theoretical framework. The research object is comprised of 26 cities in the YRDUA, from 2010 to 2021. In addition, a coupling coordination model, Dagum Gini coefficient decomposition method, and a panel vector autoregression (PVAR) model are used for in-depth analysis. The results indicate: (1) the coupling coordination degree (CCD) of GEG, GF, and CEP has experienced a leap-forward promotion of “primary coordination→modern coordination.” However, high-quality coordinated development is far from being realized, and the whole is in the primary coordination stage. (2) The spatial differences of CCD are obvious, showing an overall pattern of “multi-core” radiation and an interregional pattern of “high in the east and low in the west.” (3) Finally, GEG, GF, and CEP show a strong trend of development according to their own inertia and self-strengthening characteristics; the interaction among them is also gradually becoming stable. Based on the research findings, this study offers targeted recommendations to promote sustainable development in the YRD further.
Keywords
Introduction
Carbon emissions are a major driver of global warming, posing a serious threat to humanity and obstructing sustainable development (K. Dong et al., 2018). In the face of increasingly severe global problems, countries around the world are gradually recognizing the importance of achieving low-carbon development and are taking action to reduce carbon emissions (Xu et al., 2024; K. Zhou et al., 2023). As the world’s largest energy consumer and carbon emitter, China’s carbon emissions are still immense. According to data from the International Energy Agency (IEA), in 2023, China’s carbon dioxide emissions would amount to about 12.6 billion tons, accounting for approximately 33.7% of global carbon dioxide emissions. In this context, China clearly put forward the “double carbon” goal. Also, the national carbon emission trading system was launched in 2021, and in 2022, the government issued the “Implementation Plan for Synergy of Pollution Reduction and Carbon Reduction.” The aim of this plan was to further integrate environmental governance and climate goals and to promote the deep integration of “double carbon” action and pollution prevention and control. Nevertheless, China has a long way to go in dealing with global climate change (M. Shen et al., 2024).
Existing studies on carbon emissions cover four main areas. In terms of research content, current research primarily focuses on the characterization and prediction of carbon emissions (Huo et al., 2022; Luo et al., 2024), spatial-temporal evolution and spillover effects (Xu et al., 2024; K. Zhou et al., 2023), influencing factors and driving modes (Yang et al., 2024; B. Zhao et al., 2023), and other aspects. In terms of research methodology, scholars have adopted various models, including but not limited to: ESDA model (K. Zhou et al., 2023), stochastic frontier analysis (SFA) model (Du et al., 2023), system generalized method of moments (SGMM; Y. J. Zhang et al., 2017), evolutionary game model (Cao et al., 2024), tapio decoupling model (Y. Zhao et al., 2022), difference-in-differences (DID) method (Z. Dong et al., 2022), the spatial Durbin model (SDM; K. Zhou et al., 2023), and the fixed-effect model (Wang et al., 2023). With regard to the research object, studies mainly focus on industry sectors’ carbon emissions (P. Gao et al., 2021), agricultural carbon emissions (R. Zhao et al., 2018), steel industry carbon emissions (Song et al., 2025), and construction sector carbon emissions (L. Huang et al., 2018). With regard to the research scale, the focus has primarily been on the global level (L. Huang et al., 2018), the national level (Jiang et al., 2023), the city level (Mi et al., 2019), and urban agglomerations (Jin et al., 2024). The above research lays the theoretical and methodological foundation for understanding carbon emissions in this study.
As a modern financial tool, GF aims to support environmental improvement, address climate change, and promote resource conservation and efficient use (T. Zhang, 2023; K. Zhang et al., 2024a). As such, GF is seen as a key tool for transitioning to a low-carbon economy and an innovative approach to improving carbon emission efficiency (Wang et al., 2023; W. Zhang et al., 2022). GF has been shown to reduce carbon emissions by optimizing resource allocation, upgrading industrial structures, refining energy systems, and advancing technology (W. Liu & Zhu, 2024; Xie et al., 2021). Improvements have also been brought about through three channels: the financing effect, the innovation effect, and the external regulation effect (Yu et al., 2021; X. Zhao et al., 2024). Besides the “spatial heterogeneity effect” and “localization effect,” GF also has a spatial spillover effect on the carbon emission efficiency of neighboring regions, though this effect is short-lived (Liang & Song, 2022; C. Ran & Zhang, 2023; Su et al., 2024). In addition, the sensitivity of carbon emission efficiency to the green financial index shows an inverted “U” trend (Wu et al., 2024). As global environmental problems become increasingly prominent, governments at all levels inevitably need to take on more environmental responsibilities. Under this background, how GEG affects CEP has become a topic worthy of in-depth discussion. Some scholars have also pointed out that environmental-related government decision-making behaviors (such as implementing environmental laws and regulations, fiscal expenditure and subsidy policies, and energy structure transformation strategies) will reduce corporate carbon emissions (H. Liu et al., 2023). Local governments’ focus on environmental protection, combined with the central government’s emission reduction targets, has strengthened the impact of environmental governance on reducing carbon emissions (Cao et al., 2024). The above studies show that, although there are rich studies on GEG, GF, and CEP, those studies focus more on exploring the unidirectional causality between the two. Few studies have integrated GEG, GF, and CEP into the same framework, and nor have they comprehensively explored the relationship among the three from the perspective of coupling coordination and interactive effects. Only a few studies have focused on the two-way relationship between GF and low-carbon development. For example, Sun et al. (2023) empirically explored the two-way interaction between the low-carbon economy and GF. Yanjuan et al. (2025) revealed the spatial and temporal variation characteristics and influencing factors of coupling coordination between GF development and green low-carbon transformation. This study aims to further investigate the interactions between GEG, GF, and CEP and also to explore the complexity of their interconnections.
With the continuous and in-depth promotion of global climate governance and the deepening and increasing popularization of the concept of low-carbon development, more and more developing countries have begun to pay attention to the enhancement of CEP. Multiple countries have taken positive action to promote low-carbon transformation. In this process, GEG builds an institutional framework by means of regulatory constraints, financial incentives and scientific-technological innovation. Meanwhile, GF optimizes resource allocation by means of the market mechanism, and CEP comprehensively reflects the synergy between regional economic-technological structure and environmental performance. The complex system of “institution-market-technology” constituted by the three has become the key to deciphering the paradox of carbon emission reduction efficiency and fairness. Therefore, carrying out a study on the spatiotemporal coupling characteristics and dynamic relationship among GEG, GF, and CEP is of great significance. In view of this and based on the theoretical analysis of the relationship between GEG, GF, and CEP, this study takes the 26 cities in the YRDUA as the research object, using data from 2010 to 2021. A coupling coordination degree model is adopted to explore the CCD of GEG, GF, and CEP, and the Dagum Gini coefficient decomposition method is utilized to reveal the source of spatial differences in the CCD. The dynamic relationship among the three is explored using the PVAR model, and finally, this study puts forward suggestions for the coordinated development of the three in the light of the actual situation. The aim of the study is to provide a useful reference for the promotion of the realization of the green low-carbon development of the economy in the YRDUA.
Research Model Construction
GEG, GF, and CEP share the common goal of low-carbon development (Bai et al., 2023; Hu et al., 2023; X. Zhao et al., 2024), which is highly compatible with the internal requirements and development goals of the three. There is also an inherent logical relationship of mutual empowerment and synergistic progress.
In the GEG system, the improvement of environmental governance is conducive to encouraging more social capital to flow to the green industry. This in turn promotes the development of GF (Peng et al., 2022). At the same time, the detailed provisions of the comprehensive, professional, and guiding documents can, to a certain extent, enhance the feasibility of the implementation of green financial policies (Wu et al., 2024). Alternatively, GEG can have a direct impact on CEP by disciplining polluting enterprises through the implementation of carbon taxes, energy taxes, carbon trading rights, and cleanup subsidies (Kuang et al., 2022). Further, GEG can have an indirect impact on CEP by adjusting the energy consumption structure, promoting industrial structure upgrading, and improving technological innovation capacity (Pei et al., 2019; Yin et al., 2022). These features of GEG effectively exert the “Porter effect.”
Regarding the GF system, green financial technology can drive the government to efficiently integrate and allocate all kinds of information and resources in the process of environmental governance (Hou et al., 2023). This will help to break the barrier of information asymmetry (J. Yan et al., 2015), and then promote the effective implementation of environmental governance policies and dynamic supervision. Ultimately, the accuracy and efficiency of environmental governance will be improved. In addition, GF can optimize the allocation of resources by regulating and guiding the flow of capital, technology, information, talents, management, and other resources from the “two high and one surplus” industries to the fields of clean energy and environmental protection (L. Gao et al., 2022; Yu et al., 2021; T. Zhang, 2023). This will promoting the green low-carbon transformation of industrial structure and enhance the efficiency of environmental management. At the same time, GF promotes green technological progress and enterprises’ innovation through green credit, green investment, green bonds, and green support (Q. Ran et al., 2023), which improves the efficiency of energy utilization and contributes to the improvement of CEP (C. Yan & Tan, 2023).
In terms of the CEP system, CEP is an important tool used to measure the effectiveness of GEG. The obtained information promotes the government to set stricter environmental targets, while also providing important data support for government decision-making and policy adjustments (such as carbon market quota adjustment). Furthermore, the improvement of CEP will enhance enterprises’ understanding of green low-carbon development. In order to enhance green reputation and competitiveness, enterprises will increase their investment in renewable energy and green environmental protection technologies (Wu et al., 2024), thus attracting more resources to flow into the GF field. At the same time, the improvement of CEP will drive the green transformation of industrial structure. The resulting environmental improvement effect will promote green low-carbon development and then deliver a steady stream of power for the development of GF (L. Shen & Fan, 2023).
In summary, GEG, GF, and CEP interact and influence each other and together constitute a complex coupling coordination system (Figure 1). In this complex system, GEG provides strong guarantees and important guidance for GF development and CEP improvement, which in turn provide effective support and feedback for GEG. Also, GF is a powerful tool for CEP improvement, while CEP is an effective driving force to support GF development. Therefore, measuring and analyzing the CCD among GEG, GF, and CEP can provide empirical evidence for the YRDUA to carry out differentiated environmental policy design, green financial instrument innovation, and carbon emission performance improvement paths. At the same time, the acquired evidence provides an important decision-making reference for the low-carbon development of the YRDUA.

Coupling coordination mechanism of GEG, GF, and CEP.
Study Area and Research Methods
Study Area
As the highest form of spatial organization in the development of cities to maturity (Tang et al., 2024), urban agglomerations have become the major regions with the greatest potential for current and future economic growth and development in China (X. Chen et al., 2023). With only 2.1% of China’s regional area, 25% of China’s total economic output and more than 25% of the country’s industrial value-added are concentrated in the YRDUA. The area is regarded as one of the most active regions in China’s economic development. In 2019, the Yangtze River economic belt (YEB) region accounted for 13.6% of mainland China’s carbon emissions, making it a significant contributor to China’s overall carbon emissions (P. Huang et al., 2024). At the same time, as a “dual-carbon” pilot demonstration zone, the YRD issued the “Implementation Plan for Peak Carbon Achievement in the Yangtze River Delta Eco-Green Integration and Development Demonstration Zone” in June 2022. The aim was to provide full support for the Demonstration Zone as a whole to take the lead in realizing high-quality peak carbon and a steady decline in carbon emissions. Therefore, the YRDUA, which has certain typicality and representativeness, is selected as the research object in this study. Based on the quantitative analysis of city scale, this study covers 26 research units of the YRDUA (Figure 2).
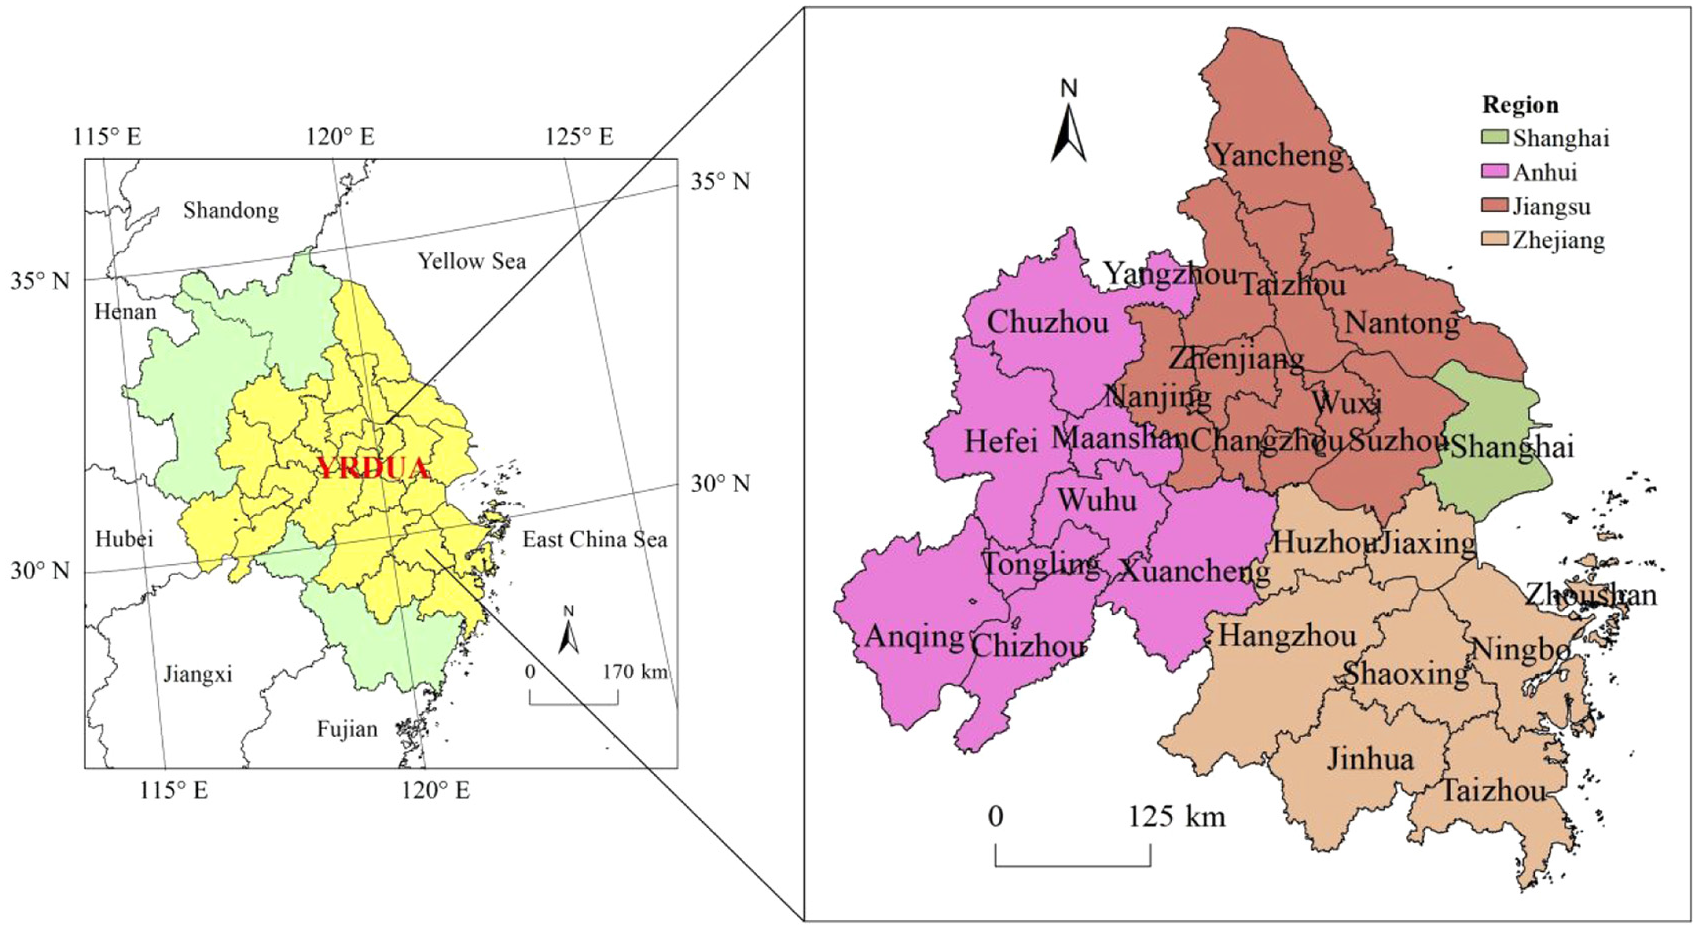
Location of the study area.
Data Retrieved
Considering the consistency of statistical standards and data availability, the study period is 2010 to 2021. The original data mainly come from China Statistical Yearbooks, China Urban Construction Statistical Yearbooks, China Urban Statistical Yearbooks, provincial and municipal statistical yearbooks and their statistical bulletins of national economic and social development. Other sources include ecological environment status bulletins, solid waste pollution environmental prevention and control information bulletins, the EPS database, and the WIND database. Missing data were supplemented using spatial interpolation. In order to eliminate the dimensional and quantitative differences of variables, the range method is used to standardize GEG, GF, and CEP.
Variables Description
Government Environmental Governance
Drawing on related studies (Z. Chen et al., 2016; S. Chen & Chen, 2018; X. Liu et al., 2023), this study uses the proportion of words related to “environmental protection”-including terms such as environmental protection, pollution, energy consumption, emission reduction, sewage discharge, ecology, green, low carbon, air, sulfur dioxide, carbon dioxide, PM10, and PM2.5-in local government work reports as a proxy variable to measure GEG.
Green Finance
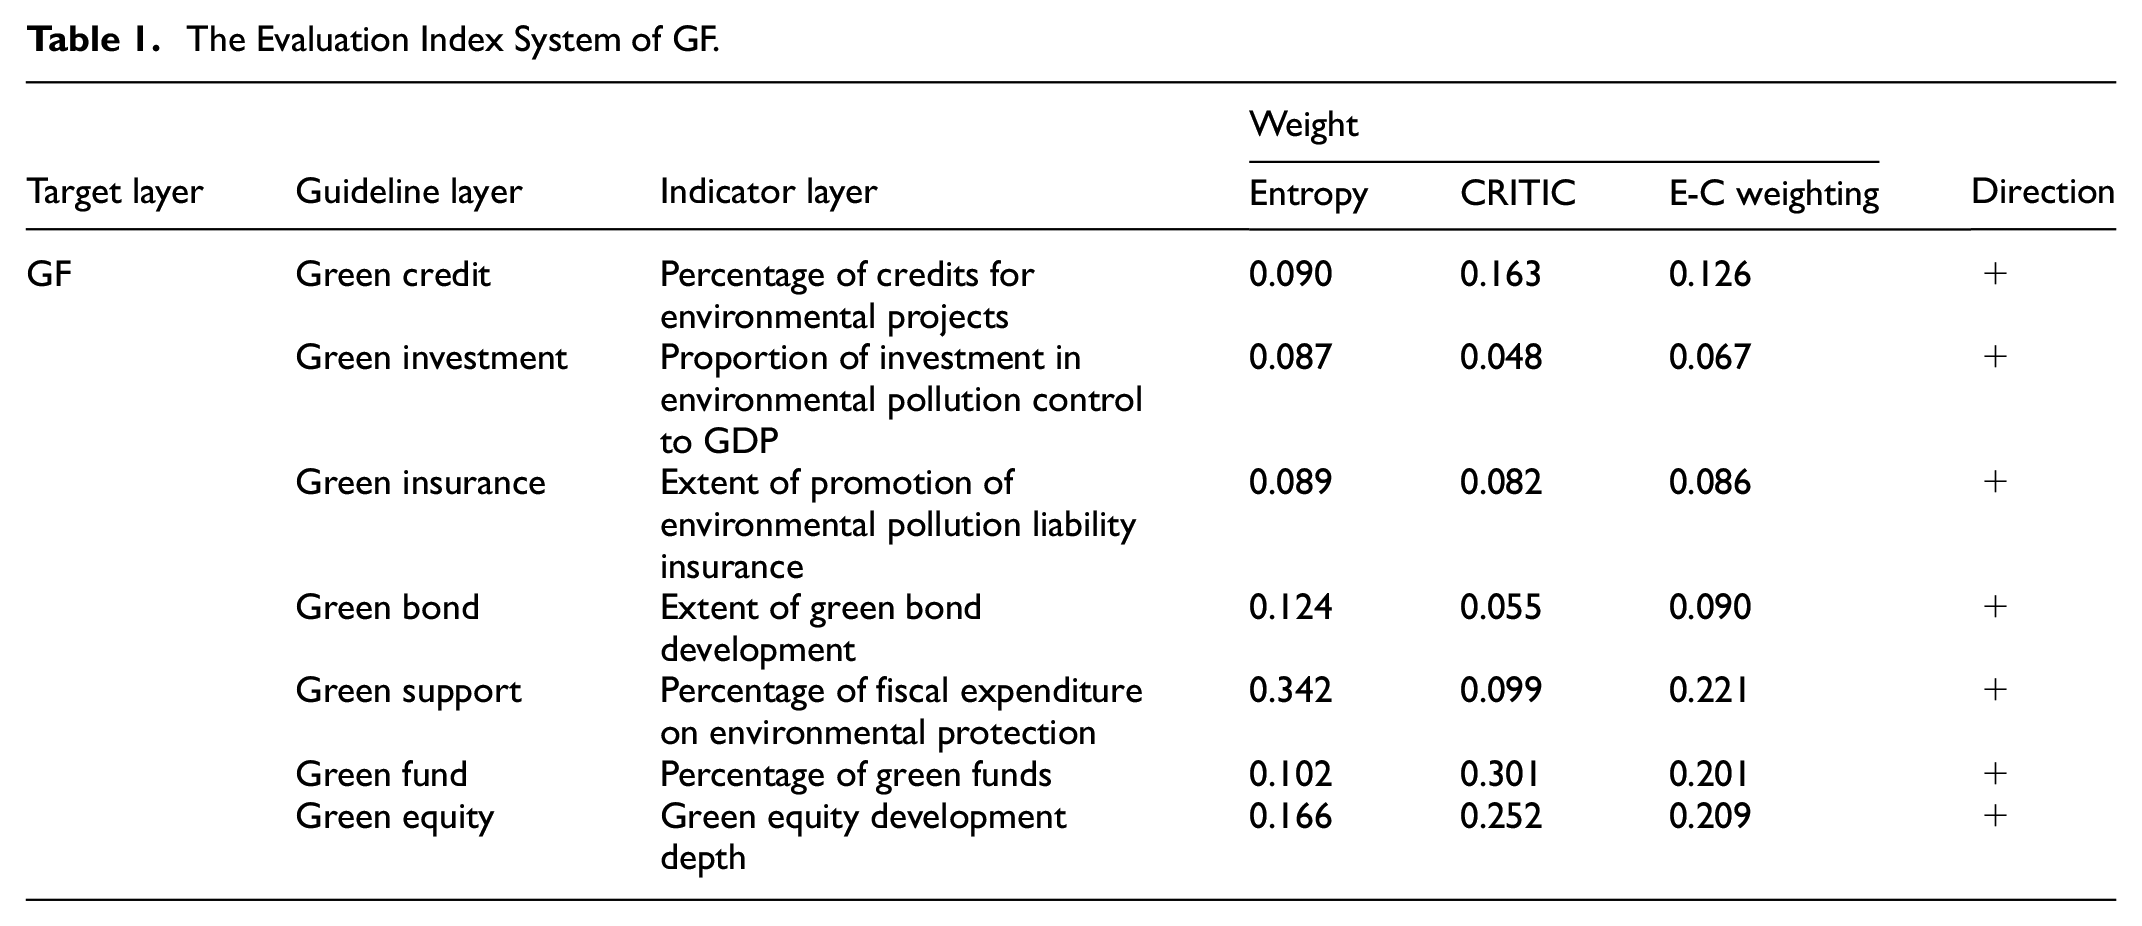
This study adopts the definition and scope of GF outlined in the Guiding Opinions on Building a Green Financial System, jointly issued by seven ministries and commissions, including the People’s Bank of China and the Ministry of Finance, in 2016. Based on data availability and relevant studies (Lee et al., 2023; Q. Ran et al., 2023; W. Zhang et al., 2024b), seven indicators-green credit, green investment, green insurance, green bond, green support, green fund, and green equity-are selected to construct a comprehensive evaluation system for GF. The study employs the entropy-CRITIC combined empowerment method to determine the weights for each indicator (Table 1).
The Evaluation Index System of GF.
Carbon Emission Performance
Referring to related studies (Q. Ran et al., 2023; L. Shen & Fan, 2023; Wu et al., 2024), in this study, the super-efficiency SBM model with undesirable outputs is utilized to measure CEP. Capital, labor, and energy are selected as input indicators, while GDP serves as the desirable output and carbon emissions as the undesirable output. The specific indicators are detailed in Table 2.
Input-Output Indicators.

Methodology
Entropy-CRITIC Combined Empowerment Method
The entropy weighting method is based on the objective assignment of the degree of variability of the indicators. To a certain extent, this method avoids the bias of the results brought about by the subjective factors (K. Zhang et al., 2024a), but does not adequately take into account the correlation between the indicators. The CRITIC method assigns weights based on the degree of variation within indicators and the correlation between indicators (Diakoulaki et al., 1995). This approach effectively compensates for the drawbacks of the entropy weighting method. This study utilizes the combined entropy-CRITIC empowerment method to determine the weights of each indicator, and the specific calculation process and steps refer to previous literature X. Liu et al. (2023).
Coupling Coordination Degree Model
Coupling coordination refers to the interactions and mutual influences between different systems, resulting from both internal and external effects (Y. Li et al., 2012). This study employs CCD to assess the coupling coordination relationship between GEG, GF, and CEP, calculated as follows (J. Li et al., 2021; Zhai et al., 2024):

where D is the CCD. G1, G2, and G3 are the development levels of GEG, GF, and CEP. α, β, and γ are weights of three elements. In this study, the types of CCD are categorized into the following eight types: extreme unbalance (0.0 ≤ D < 0.2), moderate unbalance (0.2 ≤ D < 0.3), mild unbalance (0.3 ≤ D < 0.4), slightly unbalance (0.4 ≤ D < 0.5), primary coordination (0.5 ≤ D < 0.6), moderate coordination (0.6 ≤ D < 0.7), good coordination (0.7 ≤ D < 0.8), excellent coordination (0.8 ≤ D ≤ 1).
Dagum Gini Coefficient Decomposition Method
Dagum Gini coefficient decomposition not only accurately characterizes sample distribution, but also effectively addresses the drawbacks of the traditional Gini coefficient, which cannot decompose regional differences. It breaks down these differences into intra-regional variations, inter-regional variations, and super-variable density (Fu et al., 2022; R. Zhou et al., 2022). This approach is employed in this study to analyze the sources of spatial variation in the CCD of GEG, GF, and CEP, with detailed formulas available in the literature M. Li et al. (2024).
PVAR Model
The PVAR model refers to the vector autoregressive model in panel data setting, which energizes the relationship between endogenous variables and the potential interaction between panels over time (Kim & Cho, 2022; Ye et al., 2023). It is a common tool for analyzing dynamic relationships between variables. The formula for the PVAR model is as follows:

where
Results
Coupling Coordination Analysis
Time Dimension
The average value of the CCD reflects the overall development of the YRDUA (Figure 3). The overall CCD of GEG, GF, and CEP in the YRDUA was not high, with an annual average of only 0.551. This was in the primary coordination stage, where Shanghai (0.684)>Jiangsu (0.610)>Zhejiang (0.584)>YRDUA (0.551)>Anhui (0.429). There is still much room for the development of the CCD, which varies significantly among regions. Specifically, from 2010 to 2021, the CCD of YRDUA changed from 0.5763 to 0.6303, showing a fluctuating upward trend, indicating that its coupling coordination level rose from primary coordination to moderate coordination. Shanghai, with the highest CCD, showed an obvious upward trend and roughly experienced moderate coordination (2010–2011)-primary coordination (2012–2013)-moderate coordination (2014)-good coordination (2015–2017)-moderate coordination (2018)-good coordination (2018–2021). Overall, Shanghai is in the moderate coordination stage, which indicates that Shanghai’s GEG, GF, and CEP show better mutual adaptability. Shanghai is followed by Jiangsu, which rose from 0.592 in 2010 to 0.660 in 2021. During this time, Jiangsu’s CCD gradually shifted from primary coordination to moderate coordination, and also reached the moderate coordination stage overall. Anhui’s CCD was the worst during the sampled years, but the magnitude of change was larger, gradually shifting from slightly unbalanced to primary coordination. Anhui’s GEG, GF, and CEP passed the teething stage and gradually entered the stage of coordinated development in the acceptable range. However, Anhui’s coupling coordination situation did not change much, and the overall situation was still in the stage of slightly unbalance. Zhejiang showed a decreasing trend in fluctuation, with a decrease of 10.84% during the study period, with a gradual shifting from good coordination to moderate coordination, and overall was at the stage of primary coordination.

Level of CCD in the YRDUA from 2010 to 2021. (a) is CCD in the YRDUA and its four regions, and (b) is the proportion types of CCD in the YRDUA.
Spatial Dimension
During the study period, significant spatial differences were evident in the CCD of GEG, GF, and CEP in the YRDUA (Figure 4). Compared with 2010, the overall CCD of the YRDUA in 2021 had improved by leaps and bounds. However, inter-regional imbalance still exists, and highly coordinated areas are concentrated in the east, forming a “multi-core” growth level with Yancheng, Yangzhou as the core, and Shanghai, Hangzhou, Suzhou, and six other good coordination city units as the nodes. This also leads to the extension of moderate coordination of city units from east to west. Relatively speaking, the western region is constrained by factors such as geographic location conditions, single industrial structure, large energy consumption, and insufficient technological investment. In addition, GEG, GF, and CEP have not yet formed a benign interaction, so the CCD in the YRDUA shows a distribution pattern of “high in the east and low in the west.” Specifically, in 2010, the CCD of the YRDUA was mainly good coordination, moderate coordination, and primary coordination, accounting for 65.38%, mainly distributed in coastal and border areas. This phenomenon may stem from the fact that the coastal area has a higher degree of economic openness. There is also stronger capacity for infrastructure development and technological innovation, a more advanced industrial structure and stronger policy support. Moreover, the fact that it is easier for the border area to break down administrative barriers. This effectively reduces the cost of factor mobility and information asymmetry and promotes the rational spatial allocation of high-quality resources. In 2016, the CCD was dominated by moderate coordination and was slightly unbalanced, accounting for 42.31% of the total. These units were mainly in eastern Anhui, central Jiangsu, and in Hangzhou and Zhoushan in Zhejiang. In 2021, China launched the national carbon emission trading system. Against this background, the CCD of many city units in the YRDUA had improved, with the number of moderate coordination city units increasing to 11. Except for Ma’anshan, Changzhou, and Taizhou (Zhejiang), all other city units were in a coordinated state.

Distribution pattern of the CCD in the YRDUA from 2010 to 2021: (a) is the types of CCD in 2010, (b) is the types of CCD in 2016, and (c) is the types of CCD in 2021.
Spatial Variation and Decomposition Analysis
Overall and Intra-Regional Variations
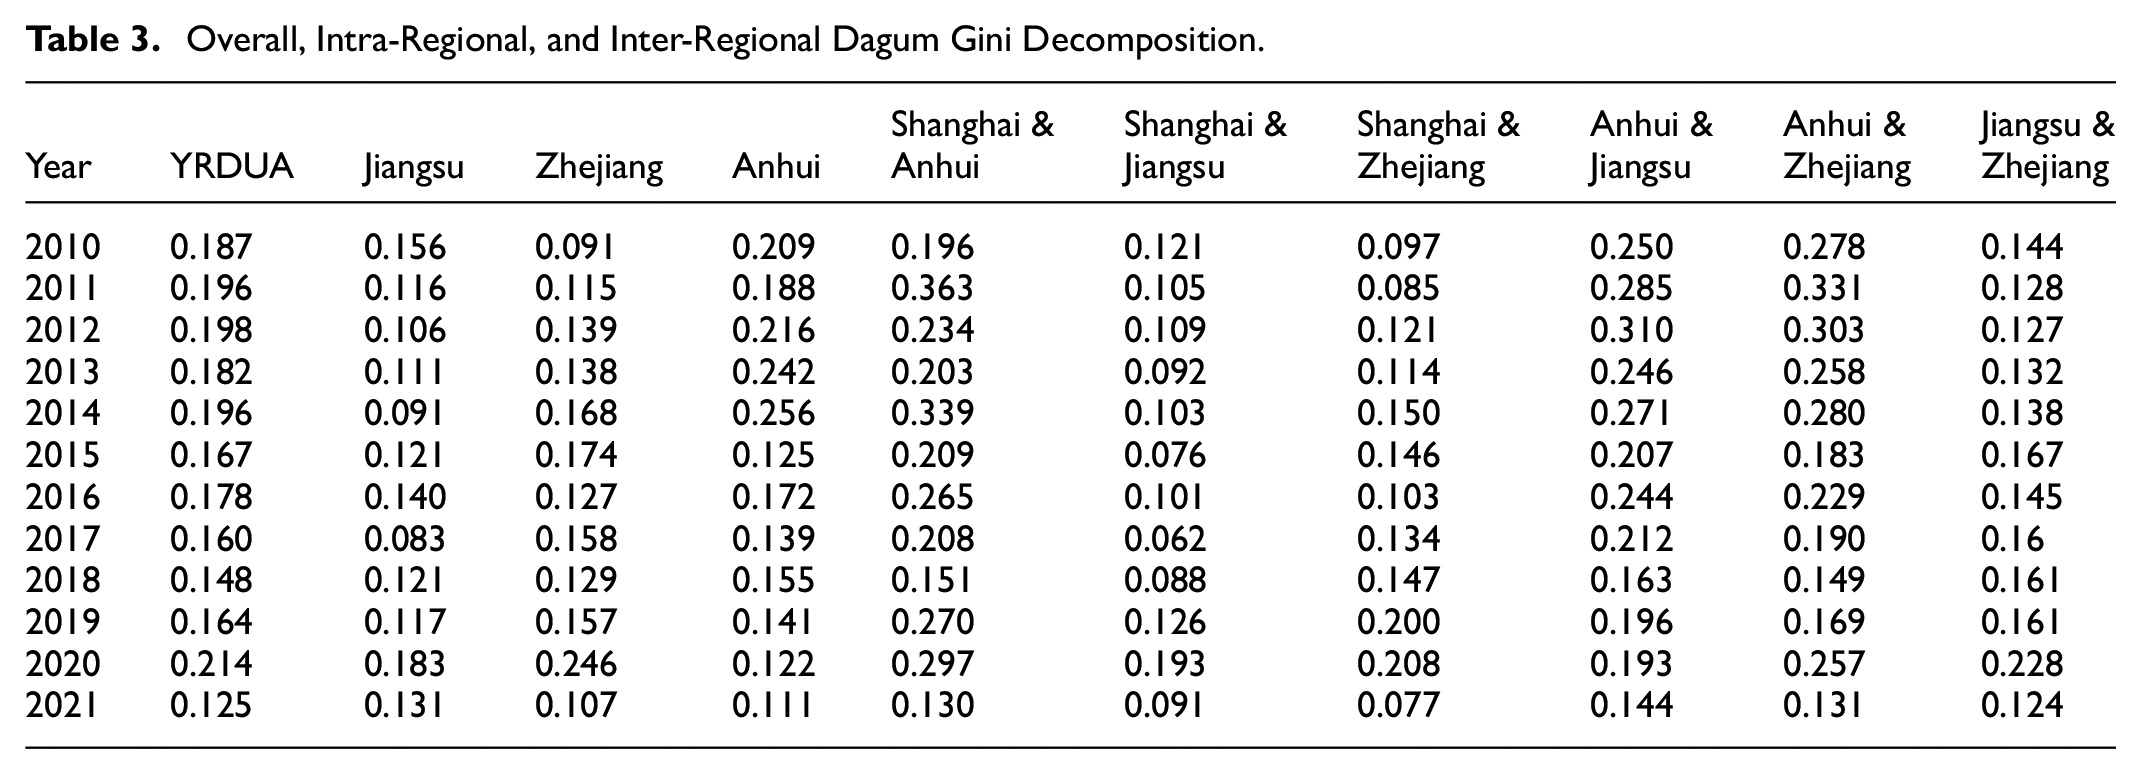
In Table 3, from 2010 to 2021, the overall Dagum Gini coefficient shows a fluctuating downward trend, with its value decreasing from 0.187 to 0.125. This finding indicates that the overall variation in the CCD was shrinking and showing a more obvious trend of convergence. For intra-regional variations, the Dagum Gini coefficients of Jiangsu and Anhui show a high degree of similarity with those of the YRDUA. This finding suggests that the internal variations in the CCD have improved to varying degrees in both of these two regions. However, the Dagum Gini coefficient of Zhejiang shows a fluctuating upward trend, indicating that the internal variations of its CCD have increased. By comparing the three regions, the intra-regional variation of CCD in Anhui is found to be the largest, followed by Zhejiang and Jiangsu.
Overall, Intra-Regional, and Inter-Regional Dagum Gini Decomposition.
Inter-Regional Variations
From Table 3, the relative difference between Shanghai-Jiangsu-Zhejiang-Anhui shows a fluctuating downward trend from 2010 to 2021. Among them, Anhui and Zhejiang had the fastest decline rate, at 52.88%, followed by Anhui and Jiangsu, at 42.40%. Meanwhile, Jiangsu and Zhejiang had the slowest rate of decline, at 13.89%. The spatial equilibrium trend of CCD among the four regions was increasing, which reflects that the regional integrated development strategy pursued by China government in recent years has achieved certain results. Judging from the size of inter-regional variations, the order of the annual average value of Dagum Gini coefficient among regions was Shanghai and Anhui (0.239)>Anhui and Zhejiang (0.230)>Anhui and Jiangsu (0.227)>Jiangsu and Zhejiang (0.151)>Shanghai and Zhejiang (0.132)>Shanghai and Jiangsu (0.106). One can see that the inter-regional variations of CCD are mainly caused by the inter-regional variations of Shanghai and Anhui, Anhui and Zhejiang, and Anhui and Jiangsu.
Sources and Contribution of Regional Variations
The inter-regional and super-variable density contributions trended more strongly, with relatively large changes and more pronounced high and low trends (Figure 5). However, the trend in intra-regional contributions was reasonably smooth, with relatively small changes and no significant upward or downward trends. Look from that the magnitude of the contribution of variations, the annual averages of the contribution of intra-regional, inter-regional, and super-variable density were 24.72%, 49.48%, and 25.80%, respectively. These findings indicate that: (1) The sources that lead to the variations in the CCD of the YRDUA are, in order of magnitude, inter-regional variations, super-variable density variations, and intra-regional variations. (2) Inter-regional variations are the main source of regional variations in the CCD, accounting for about 50% of the total. In addition, from 2010 to 2021, the contribution of inter-regional variations ranged from 28% to 70%, while the contribution of intra-regional variations was all within 20% to 30%. These findings indicate that the contribution of inter-regional variations was more clearly manifested. This may be the result of inter-regional differences in geographic location, economic structure, resource endowment, policy preferences, and imperfect mechanisms for cross-regional sharing and co-construction. In the future, reducing inter-regional variations will be an important direction of concern for the YRDUA when addressing spatial imbalances in the CCD of GEG, GF, and CEP.

Contribution rate.
Interactive Effects Analysis
Optimal Lag Order Test
In order to avoid pseudo-regression phenomenon, before applying the PVAR model, three methods were simultaneously used to test the data for unit root. All variables rejected the original hypothesis that the variables were non-stationary at the 1% level and satisfied the conditions for constructing the PVAR model (Table 4).
Unit Root Test Results.

After the unit root test, the optimal lag order of PVAR model was determined based on the criteria of MBIC, MAIC and MQIC (Table 5). The results show that the lag order of 1 is optimal, and a PVAR model of order 1 is constructed.
Optimal Lag Order.

Note. * indicates the best lag period (the period with the smallest test results in the optimal lag period).Shaded cells denote the lag 1 is the optimal lag order.
In order to ensure the validity of model estimation, impulse response, and variance decomposition, we have tested the robustness of the model (Figure 6). If the characteristic root of the adjoint matrix is less than 1 (within the unit element), the model is robust. As can be seen from Figure 6, the three characteristic roots are all in the unit circle, so the PVAR model constructed in this study is robust.

Robustness test of PVAR model.
GMM Parameter Estimation
In this study, three variables are estimated by GMM to explore the dynamic relationship among those variables at a deeper level (Table 6). When GEG serves as the explanatory variable, the dynamic impact of GEG and GF on GEG with a lag of one period is positive, of which GF is significant at the 10% level. This finding indicates that the enhancement of the development level of GF helps to optimize GEG. Also, there is no obvious characteristic of GEG developing according to its own inertia. Meanwhile, the dynamic impact of CEP on GEG with a lag of one period is negative and non-significant. When GF acts as the explanatory variable, the dynamic impact of GEG, GF, and CEP on GF with a lag of one period is positive and at least passes the significance test at the 10% level. This finding indicates that GF has a strong characteristic of development according to its own inertia. In addition, a good environment for GF is more likely to promote the sustainable development of GF; GEG and CEP also help to improve the level of GF. When CEP is regarded as the explanatory variable, the dynamic effect of CEP on itself with a lag of one period is negative and non-significant. Meanwhile, GEG and GF with a lag of one period have a positive and non-significant effect on CEP. This indicates that CEP is less affected by GEG and GF.
Result of GMM Estimation.

Note. ***, and, *Significance at the 1% and 10% levels, respectively.
The GMM parameter estimation can reflect the dynamic simulation process among GEG, GF, and CEP in a macroscopic way. However, the model has the drawbacks of not being able to portray the dynamic transmission mechanism among the three. So this study continues to conduct a more in-depth investigation through impulse response analysis and variance decomposition.
Impulse Response Analysis
Impulse response charts with a lag of 10 periods were obtained by 200 simulations, using the Monte-Carlo method (Figure 7). When GEG faces a standard deviation shock of its own, the response is positive and peaks rapidly and then gradually decreases and converges to 0 after Period 3. When GEG is subjected to a one standard deviation shock from GF, it shows an increasing and then decreasing trend over time, stabilizing around 0 after period 7. When CEP imparts a one standard deviation shock to GEG, over time, there is a fluctuating trend of change. The degree of impact is also generally characterized by a declining-rising-declining-steady trend, with the strongest negative impact in Period 1. This is then transformed into a positive impact and gradually stabilized in Period 2. The impact of GEG on GF shows a rising-declining-smooth trend, with the strongest positive impact in the Period 1, which tends to 0 and gradually stabilizes after Period 6. When GF is affected by its own impact, the overall impact is positive, but the degree of impact gradually weakens, converging to 0 after Period 6. When GF is affected by the impact of CEP, it is fluctuating and stabilizing. The overall impact was positive, but the degree of impact gradually weakened, converging after Period 5. When CEP is impacted by GEG, a rising-declining-steady trend is shown, with the positive impact being the largest in Period 2 and converging to 0 in Period 6. When CEP is impacted by GF, the positive response shows a tendency of increasing and then narrowing, peaks in Period 1, and then gradually narrows down and converges to 0 with the passage of time. When CEP is subjected to its own impact, a trajectory of sharp decline-rise-steady is shown, with a positive and maximum response at the beginning. This finally transforms into a negative impact and gradually converges to 0 in Period 2. Next, CEP has a lagging effect on itself. Specifically, the overall CEP of the YRDUA being low at the beginning was not conducive to its own improvement. With the gradual improvement of CEP, the inertia of CEP is gradually revealed, and it enters the benign development track.

Impulse response of GEG, GF, and CEP in the YRDUA.
To summarize, the YRDUA’s GEG, GF, and CEP show long-term dynamic interactions, and they gradually converge and stabilize. This is very closely related to the YRDUA’s superior geographic location, rich resource endowment, diverse economic structure, multiplex financial support, and other factors.
Variance Decomposition (VD)
This study utilizes VD to further analyze the interaction between GEG, GF, and CEP. As shown in Table 7, the VD results of the 10th and 15th periods are the same or close to each other. This finding indicates that the fluctuation of variables in Period 15 gradually tends to stabilize, and the interactions among GEG, GF, and CEP tend to be balanced. This finding also verifies the robustness of the PVAR model. The interaction between GEG, GF, and CEP is analyzed based on the results of the VD in Period 15. The contribution of GEG to itself is as high as 94.1%, thereby reflecting the strong inertia and self-strengthening characteristics of GEG. The contribution of CEP to GEG is the smallest (about 0.2%) and remains stable. The contribution of GF to GEG grows period-by-period and stabilizes at 5.7%, indicating that the effect of GF and CEP on GEG is limited, and there is large room for development. The contribution of GF to itself is about 81.9%, reflecting that GF has the tendency to develop according to its own inertia. Meanwhile, the contribution of GEG to GF (17.0%) is much higher than that of CEP to GF (1.1%), indicating that the effect intensity of GEG on GF is higher than that of CEP. The contribution of CEP to itself is as high as 93.4%, while the contribution of GEG to CEP is the smallest. Also, the contribution of GF to CEP increases to 5.4% and tends to be stable. The influence of GF on CEP is stronger than that of GEG.
Results of VD.

In summary, the contribution of GEG, GF, and CEP of the YRDUA are all above 80%. This indicates that the YRDUA has a strong trend of development according to its own inertia and self-strengthening characteristics.
Discussion
Spatial Correlation Analysis of the CCD
Table 8 demonstrates the Moran’s I and the corresponding Z-values and p-values for the YRDUA from 2010 to 2021. The global spatial autocorrelation of most years passes the significance test, among which the Moran’s I of 2018 is negative. This finding indicates a strong negative spatial correlation of CCD. In addition, the Moran’s I of the other 8 years that pass the significance test are positive, indicating a strong positive spatial correlation of CCD. Overall, Moran’s I decreased in fluctuation during the sampled years. This suggests that the similarity of spatially neighboring city units gradually decreases, and spatial correlation weakens over time with the development of GEG, GF, and CEP.
Moran’s I Index of the YRDUA.

The four quadrants of the Moran’s scatter plot (Figure 8) are divided into H-H push area (the first quadrant), L-H transition area (the second quadrant), L-L lag area (the third quadrant), and H-L radiation area (the fourth quadrant). In Figure 8, most of the scatters fall into the first and third quadrants, which are H-H push areas and L-L lag areas. Conversely, relatively few scatters fall into the second and fourth quadrants, that is, into the L-H transition zones and H-L radiation zones. This indicates the existence of a significant local spatial positive correlation in the CCD of the YRDUA and presents a spatial correlation pattern of “homogeneity as the main factor, heterogeneity as the auxiliary factor,” and homogeneity being stronger than heterogeneity. Also indicated is the overall performance of the spatial club convergence effect.
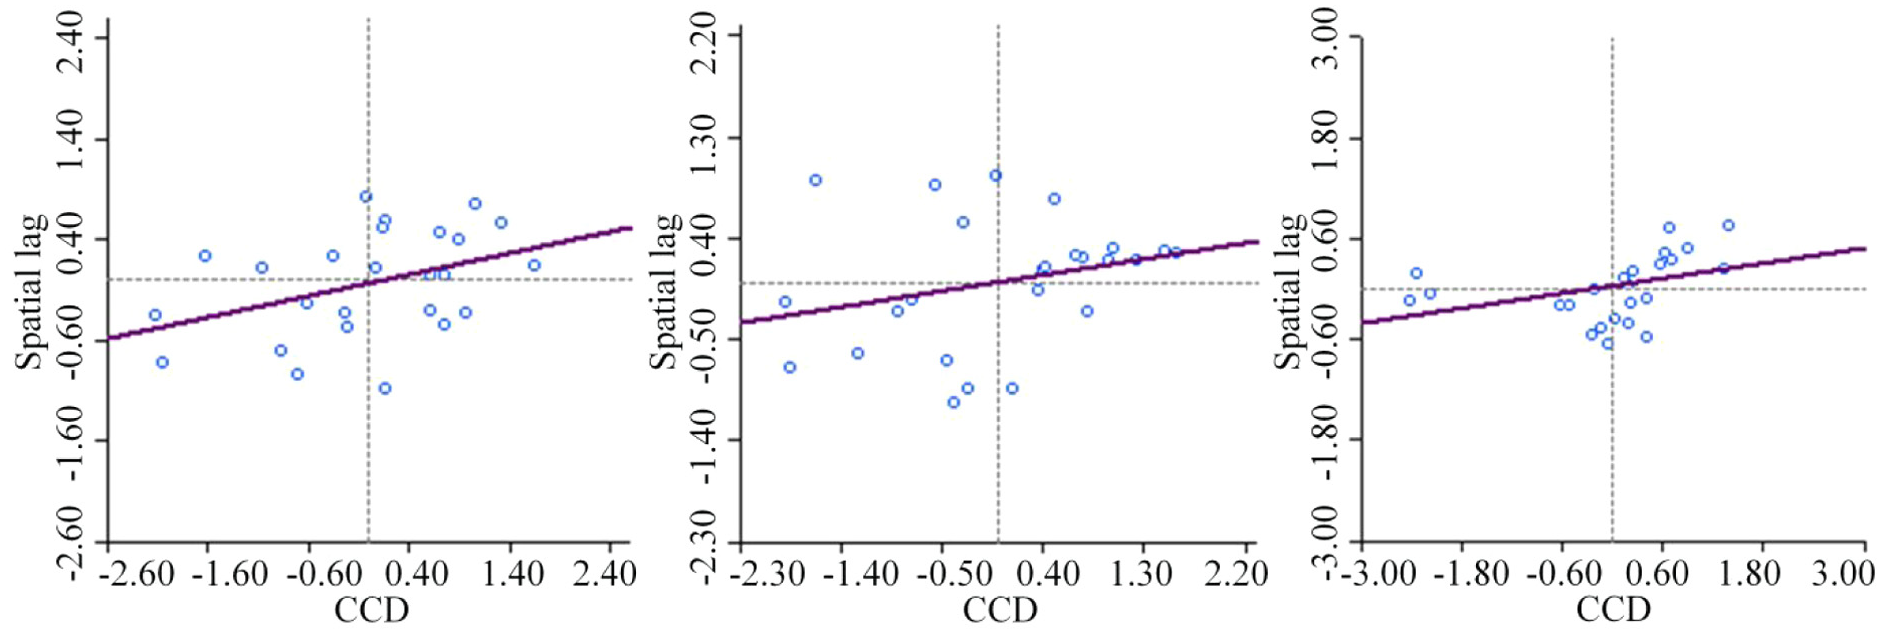
Local Moran’s I scatter plot of CCD in the YRDUA from 2010 to 2021.
Comparison to Related Studies
It has been confirmed that government attention can significantly reduce carbon emissions (Cao et al., 2023). Moreover, GF policies can significantly reduce the emission intensity of air pollutants from heavily-polluting firms and thus effectively contribute to regional development (Xiao et al., 2024). Most previous studies have discussed the single influence of GEG on CEP and of GF on CEP. However, there has been a lack of any quantitative evaluation of the coupling relationship and interaction effect of the three. Against this background, this study examines the spatiotemporal coupling characteristics and interactive effects of GEG, GF, and CEP in the YRDUA from 2010 to 2021 based on the system coupling perspective. First, this study hypothesizes that a coupling coordination and interaction relationship exists between GEG, GF, and CEP. In Section 2, a coupling coordination mechanism with expandability is constructed. Second, urban agglomeration is an important geospatial unit in terms of achieving the target of social sustainable development (J. Li et al., 2022). On that basis, this study focuses on the YRDUA, which supplements the coupling relationship among GEG, GF, and CEP to some extent. Finally, a comprehensive perspective is adopted to empirically verify the coupling coordination relationship and dynamic interaction effects among GEG, GF, and CEP. In focusing on the mutual feedback of GEG, GF, and CEP, this study empirically demonstrates the evolutionary trajectory of the interaction between GEG, GF, and CEP. The results help us comprehensively grasp the development trend and potential problems of GEG, GF, and CEP in the YRDUA. They also provide an important reference for the coordination and sustainable development of GEG, GF, and CEP in other regions.
Conclusions and Recommendations
Conclusions
This study examines the coordination and interaction between GEG, GF, and CEP in 26 cities of the YRDUA from 2010 to 2021. The main conclusions are as follows:
The trend of the mutual adaptation and co-development of GEG, GF, and CEP gradually increased, and the CCD among the three experienced a leap-forward promotion of “primary coordination→modern coordination.” However, high-quality coordinated development is still far from being realized. In terms of spatial pattern distribution, the CCD showed obvious unbalanced characteristics, gradually forming the overall distribution of “multi-core” radiation with “Yancheng-Yangzhou” as the node and the spatial pattern of “high in the east and low in the west.” The overall difference in CCD is gradually narrowing, showing a more obvious convergence trend. The difference mainly comes from inter-regional variations; the contribution is 49.48%. Narrowing the inter-regional variations is an important means to solve the spatial imbalance of GEG, GF, and CEP. The contribution of GEG, GF, and CEP were all above 80% in the study period, showing a strong trend of development according to their own inertia and self-strengthening characteristics. The dynamic interaction among GEG, GF, and CEP showed different trends, but their roles appear to be gradually converging and stabilizing.
Recommendations
Firstly, the opportunity should be taken to accelerate GEG, GF, and CEP improvements to promote a higher level of coordination among them. The formulation and improvement of environmental laws and regulations, along with the strengthening of environmental law enforcement and supervision, should be pursued. Increased investment in environmental governance and strengthen environmental infrastructure construction. Financial institutions should actively explore innovation in green financial products and services to meet the diversified financing needs of the green industry.
Secondly, efforts should be made to break administrative barriers and build a long-term cooperation and exchange mechanism between high-coordinated and low-coordinated regions. Core cities should fully leverage their inherent advantages and drive the development of surrounding cities through means such as experience sharing, technical support, and talent transfer. Meanwhile, intergovernmental collaboration should be strengthened, regional factor flows and resource sharing should be promoted, and steps should be taken to help realize the spatial synergistic development of GEG, GF, and CEP.
Finally, adopting locally adapted strategies to promote coordinated development. Inter-regional variations in GEG, GF, and CEP are important factors affecting their coordinated development, but there are significant differences in the direction and strength of their influence on each region. Therefore, while promoting the overall coordinated development of the YRDUA, it is necessary to use differentiation as a support to highlight the construction focus of each region.
Limitations and Prospects
As with other studies, this study’s limitations require some consideration. This study is based at the city level. In the future, the relationship between GEG, GF, and CEP can be compared at a smaller spatial scale. This approach would better provide important references for the high-quality development of governments at all levels. Moreover, with the continuous enrichment of the connotation of high-quality, low-carbon development, improving the evaluation index system of GEG, GF, and CEP, and optimizing its measurement method will also be the focus of subsequent research.
Footnotes
Funding
The author(s) received no financial support for the research, authorship, and/or publication of this article.
Declaration of Conflicting Interests
The author(s) declared no potential conflicts of interest with respect to the research, authorship, and/or publication of this article.
Data Availability Statement
Some or all data, models, or code that support the findings of this study are available from the corresponding author upon reasonable request.