
Abstract
Ecological and environmental protection has become a crucial component and key indicator of high-quality economic development. Strengthening corporate greening governance is a key focus area for regulators aiming to enhance the reform of a modernized environmental governance system. This paper examines a sample of A-share listed companies in China from 2009 to 2021, focusing on the impact of geographical distance between enterprises and Environmental Protection Bureaus(EPBs) on corporate greenwashing, which is grounded in the frameworks of government-enterprise collusion and proactive government regulation. Empirical tests show that the closer an enterprise is to the Municipal Environmental Protection Bureau, the greater the degree of corporate greenwashing, which supports the dominant role of the “distance decay effect” of government-enterprise collusion. The conclusion remains robust after considering endogeneity issues. Mechanism tests show that the government-enterprise collusion effect is the main pathway through which environmental regulatory distance affects corporate greenwashing, and that the effect is most significant at the national, provincial, and district levels of political affiliation. We also find that this relationship varies across regions, industries, and types of enterprises. Specifically, it is more pronounced among enterprises located in non-eastern regions, those in non-provincial capitals and non-sub-provincial cities, enterprises with low industry concentration, and enterprises that are not yet mature. Meanwhile, media attention, shareholder monitoring, government environmental concerns, and network infrastructure construction have moderating effects on it. This paper enriches the influencing factors of corporate greenwashing from the perspectives of geo-economics and public economics. It offers new empirical evidence supporting “the distance decay effect” and provides decision-making guidance for the government in implementing environmental protection regulations.
Keywords
Introduction
Green development is an inevitable requirement for achieving high-quality economic development (L. Fan & Yao, 2022; Shen et al., 2021; Yuan & Xiang, 2018). Enterprises, as crucial entities in economic development, are the primary participants in economic activities. Environmental information disclosure is a crucial means for enterprises to fulfill their environmental obligations and for governments to promote a modernized environmental governance system. Over the past decade, regulatory requirements for environmental disclosure by listed enterprises have increased worldwide. There has been a noticeable rise in the number of environmental disclosure policies and regulations. Amid mounting external regulatory pressure, enterprises will selectively disclose positive or not easily testable descriptive information and reduce substantive information disclosure in order to gain and maintain legitimacy (Marquis et al., 2016), establish a good social image (Parguel et al., 2011) to win the favor of stakeholders (Mahoney et al., 2013), and to cover up their unsatisfactory overall environmental performance. This kind of corporate greenwashing behavior will greatly weaken the confidence of consumers and investors in environmentally friendly enterprises and seriously erode the healthy body of the green capital market.
The regulatory environment is a major driver of “greenwashing” (Delmas & Burbano, 2011). Previous studies have examined the impact of government regulation on greenwashing, mainly focusing on government penalties (Sun & Zhang, 2019; Zhou et al., 2024), green subsidies (Q. He et al., 2020, Zhang et al., 2023), environmental management certification (Heras-Saizarbitoria et al., 2020; Hu, Wang, Wu, & Wang, 2023), environmental tax reform (Hu, Wang, & Du, 2023; Jin et al., 2024), and other government regulations. Additionally, they have explored the transformation of the power to monitor the environment (D. Zhang, 2023), the pilot policy of “low-carbon cities” (G. Zhang, 2023) and other institutional factors. However, a closely related but less researched issue is how geographical distance between EPBs and enterprises affects corporate greenwashing behavior. Geographical distance, as an objective factor constraining information transfer, naturally affects information acquisition and communication among different economic agents (Audretsch & Feldman, 1996). An increasing amount of empirical evidence suggests that geographical distance continues to be a significant factor affecting the behavioral decisions of microenterprises, despite the rapid advancements in transportation and information technology (Chakrabarti & Mitchell, 2016; Coval & Moskowitz, 2001; Kang & Kim, 2008). Previous literature has typically used geographical distance to denote information asymmetry as a proxy variable for the cost of obtaining surveillance information (Ayers et al., 2011). It has examined the relationship between tax regulation and corporate tax avoidance (Kubick et al., 2017; C. Wang & Wang, 2024), securities regulation and corporate listing decision (Burhop & Lehmann-Hasemeyer, 2016; F. Wang et al., 2022), bank competition and corporate green innovation (Y. Xia & Liu, 2022), and business privacy information and credit ratings (Gu et al., 2022). Geographical distance is a significant non-economic institutional factor that serves as a key indicator for assessing the regulatory environment. Since China’s reform and opening up, environmental legislation has been improving. However, the enforcement of environmental laws and the implementation of policies continue to encounter significant challenges. The fragmented nature of environmental regulatory agencies and the asymmetry of information between central and local governments have resulted in the uneven implementation of environmental policies (B. Zhang et al., 2018). Under the territorial management of environmental supervision, environmental protection officers are granted a certain degree of discretion in the supervision and enforcement processes. In this context, it is particularly important to examine the impact of the geographical distance between the enterprise and the environmental protection bureau on the governance of corporate greenwashing. The distance between enterprises and EPBs not only impacts the efficiency of communication and implementation of environmental policies but also influences the willingness of enterprises to adhere to environmental regulations and the transparency of information disclosure. Therefore, from a geo-economic perspective, this paper identifies information asymmetry in the environmental regulation process due to the geographic distance between enterprises and EPBs. This study aims to establish a theoretical foundation and offer practical support for the efficient enforcement of environmental regulatory policies.
In concrete terms, according to the theory of geo-economics, the closer economic agents are geographically, the lower the transaction costs (the “distancedecay effect” of transaction costs; Krugman, 1991). The closer the distance between the EPB and the enterprise, the lower the cost of searching for and obtaining environmental information, and the lower the cost of enforcing environmental regulations on the enterprise. At the same time, the geographical proximity of enterprises to EPBs can enhance the perception of environmental regulatory penalties, amplify the deterrent effect of regulatory enforcement, and diminish corporate greenwashing. However, disclosure of environmental information on a range of environmental protection measures may incur significant costs for enterprises in the short term, potentially leading to a loss of their competitive advantage. In the context of China’s discretionary environmental inspection and enforcement, enterprises have strong incentives to engage in rent-seeking activities and collude with EPBs. The closer the enterprise is to the EPB, the lower the cost of finding rent-seeking opportunities and implementing rent-seeking activities, the lower the willingness to carry out environmental protection activities, and the higher the degree of greenwashing (the “distance decay effect” of government-enterprise collusion). To the extent that geographic distance significantly influences firms adopting green practices, it remains unclear which effect is more dominant.
In order to verify the above conjecture, this study takes all the listed enterprises in A-share market (Shanghai Stock Exchange and Shenzhen Stock Exchange) as the initial sample from 2009 to 2021, and empirically investigates the influence of environmental regulatory distance (Distance between enterprises and EPBs) on the corporate greenwashing by using the two-way fixed-effects model. The results show that the closer the company is to the EPB, the higher the degree of corporate greenwashing. In other words, the “distance decay effect” of government-enterprise collusion plays a dominant role. Mechanism tests indicate that the government-enterprise collusion effect is the primary pathway through which environmental regulatory distance influences corporate greenwashing. This effect is most pronounced at the national, provincial, and district-county levels of political affiliation. In addition, the heterogeneity findings indicate that the above effects are greater when the sample enterprises are non-Eastern enterprises, non-provincial capital city and non-sub-provincial city enterprises, low industry concentration enterprises, and non-mature enterprises. In further analyses, we include media attention, shareholder monitoring, government environmental concerns, and network infrastructure construction in the regressions. These conclusions remain valid after addressing potential endogeneity issues, substituting variable indicators, and conducting robustness tests that exclude the impacts of other environmental regulatory policies.
This paper extends the existing literature from the following several perspectives:
First, this paper introduces the theory of geo-economics into the field of corporate greenwashing, expanding the research on the influencing factors of corporate greenwashing. Most of the existing literature on the influencing factors of corporate greenwashing has analyzed them in terms of institutional factors (Can & Turker, 2025; Huang et al., 2022; Testa et al., 2018) and non-institutional factors such as media attention (Zhou & Chen, 2024), digital transformation of the enterprise (Z. Li et al., 2024; Z. Lu et al., 2023), Fintech (S. Li et al., 2024; Xie et al., 2023), and competition in the product market (Arouri et al., 2021; D. Zhang, 2022), and has less often considered the impact of geographic distance as a non-economic institutional factor. This paper introduces geographical distance, a non-institutional factor, into the study of corporate greenwashing. It examines the relationship between environmental regulatory distance and corporate greenwashing, which further enriches the research perspective on corporate greenwashing.
Second, this paper presents new empirical evidence on the “distance decay effect” in geo-economics. In studying the economic consequences of geographic distance, previous literature has generally analyzed the impact of geographic distance on corporate social responsibility (F. Su et al., 2022), corporate innovation (Ma et al., 2023), corporate export behavior (Albarran et al., 2013), corporate tax avoidance (H. Chen et al., 2022; Kubick et al., 2017), dividend policy ((Yao et al., 2019), financial reporting quality (Ayers et al., 2011; Ma et al., 2020), ESG performance (Xiong et al., 2024), and other economic consequences. From a stakeholder perspective, most of the literature examines corporate boards (Alam et al., 2014; Quan & Zhang, 2021), independent directors (Shang et al., 2023), auditors (Y. Chen et al., 2016; Francis et al., 2022), venture capitalists (Kolympiris et al., 2018), bond investors (Y. He et al., 2022), suppliers (S. Li et al., 2024), credit rating agencies (Gu et al., 2022 ), stock exchanges (Burhop & Lehmann-Hasemeyer, 2016), the Securities and Exchange Commission (Kedia & Rajgopal, 2011), and the tax office (Chan & Wang, 2025; Kubick et al., 2017), among other internal and external stakeholders’ geographic proximity to corporate behavior, and to a lesser extent, regulatory distance studies in the environmental domain. The EPB, as the primary authority regulating corporate environmental activities, is an important external stakeholder for enterprises. This paper explores the relationship between EPB’s regulatory distance and corporate greenwashing, a useful extension of the literature in this area.
Third, this paper analyzes how the geographical distance between EPBs and enterprises affects corporate greenwashing through the regulatory effect and the government-enterprise collusion effect from the perspectives of the enterprise and the EPB, which further enriches the research on the mechanism of geographical distance and corporate greenwashing.
To summarize, this paper expands the existing literature on the factors influencing corporate greenwashing by examining the impact of geographical distance on corporate greenwashing, specifically through the geographical advantage between enterprises and the EPB. This analysis enriches the understanding of the mechanisms linking geographic distance to corporate greenwashing and offers new empirical evidence of the distance decay effect in geo-economics. This study not only helps identify potential loopholes and inefficiencies within the environmental governance system but also provides valuable insights for enhancing environmental regulatory strategies and improving the efficiency of policy implementation.
The other sections of the study are organized as follows: Section 2 presents theoretical mechanisms and research hypotheses; Section 3 outlines the data and methodology; Section 4 presents empirical results and analysis; and Section 5 presents the conclusions.
Theoretical Mechanisms and Research Hypotheses
Geographic distance, as a fundamental constraint on information transmission, naturally affects the cost of information acquisition and communication between different economic agents (Audretsch & Feldman, 1996). According to the “distance decay effect” hypothesis of geo-economics, in economic activities, the closer external stakeholders are to the target enterprise, the easier it is for them to access public and private information of the enterprise due to geographic proximity. Geographic proximity can enhance the ability of economic agents to obtain information by improving informal communication, reducing information asymmetry, and simplifying information complexity (Krugman, 1991). On the one hand, from an enterprise perspective, the closer the geographical distance between the enterprise and the EPB, the lower the cost for the enterprise to engage in rent-seeking activities, the stronger the ability to circumvent environmental protection regulations through rent-seeking, and the higher the degree of corporate greenwashing. On the other hand, according to the EPB perspective, the closer the geographic proximity between the EPB and the enterprise, the lower EPB’s cost of information collection and acquisition, the lower the cost of implementing environmental penalties for the enterprise, and the stronger the deterrent effect of environmental monitoring. This is conducive to reducing the extent of corporate greenwashing. On the basis of existing theories and established research, this paper argues that there is a negative effect (government-enterprise collusion effect) and a positive effect (regulatory effect) of geographic distance from EPBs to enterprises on the degree of corporate greenwashing. The relative magnitude of these two effects determines the final total effect, as illustrated in Figure 1.

Relationship between environmental regulatory distance and corporate greenwashing.
Government-Enterprise Collusion Effect
The China Environmental Protection Bureau (CEPB) is a governmental department responsible for environmental protection. As the national environmental protection agency, the Ministry of Environmental Protection is responsible for formulating policies, supervising and managing, and coordinating environmental protection efforts nationwide. At the same time, in order to implement environmental protection more effectively, local governments at all levels have established corresponding environmental protection departments, such as provincial environmental protection departments and municipal environmental protection bureaus. Local environmental protection bureaus receive operational guidance and supervision from higher-level environmental protection authorities, while simultaneously carrying out specific tasks in accordance with local conditions. In the absence of an effective constraint mechanism, local governments are strongly incentivized to prioritize economic gains over environmental protection, particularly under the influence of political promotion incentives for officials. This may lead to a lowering of environmental regulatory standards for enterprises and create opportunities for collusion between government and enterprises (Bai et al., 2019; Nie, 2017).
Profit maximization is one of the core objectives of a business. The environmental regulation of enterprises by EPBs will increase the investment of enterprises in environmental protection and emission reduction, and raise the production and operation costs of enterprises. According to the cost-benefit approach (Cormier & Magnan, 1999), enterprises have strong rent-seeking incentives to reduce production costs and acquire additional political resources and privileges. On the one hand, geographic proximity to EPBs reduces the degree of information asymmetry for enterprises, giving them a greater informational advantage and facilitating the circumvention of environmental regulations through rent-seeking. Kubick et al. (2017) study found that enterprises located near EPBs are more likely to undergo scrutiny by the agency. These enterprises also have better access to tax-related scrutiny information, which enables them to engage in tax avoidance practices more effectively. The closer a firm is to the EPB, the lower its physical, time, and transportation costs are for identifying rent-seeking opportunities and carrying out rent-seeking activities. On the other hand, the closer the geographical distance between the enterprise and the EPB, the more likely it is that the two parties will form a close network of relationships. This proximity also makes it easier to establish close personal connections and form a stable chain of collusion between the government and the enterprise (Zhu, 2019). Due to limited resources such as budget, time, and manpower, environmental protection regulators tend to prioritize visits to enterprises that are geographically closer to them for regulation and inspection. This proximity increases opportunities for exchanges and communication between enterprises and officials of EPBs, which can facilitate rent-seeking activities. In general, the closer the geographical distance between the enterprise and the EPB, the lower the costs of transport and time for identifying rent-seeking opportunities, implementing rent-seeking activities, and maintaining the rent-seeking chain. This proximity also enhances the ability to promote government-enterprise collusion through environmental rent-seeking and increases the degree of corporate greenwashing. Therefore, this paper proposes the following hypothesis: the closer the enterprise is to the EPB, the lower its environmental rent-seeking costs, the greater its ability to evade environmental regulations through rent-seeking, and the higher its level of greenwashing (referred to as the “distance decay effect” of the collusion between government and enterprise).
Regulatory Effect
First, geographic proximity between EPBs and enterprises reduces corporate greenwashing by mitigating the degree of information asymmetry. Relevant literature based on geographic proximity suggests that it helps to reduce the cost of information collection and communication for information users (Giroud, 2013), effectively mitigating information asymmetry among economic agents. From the perspective of information transmission, geographic proximity helps mitigate the information distortion problem caused by information asymmetry. It reduces the risk of omitting information content and the deterioration of information quality due to geographic distance, thereby improving the efficiency of information communication. The closer the EPB is to the enterprise, the easier it is to obtain “soft information” and “hard information” about the enterprise’s environment. This information assists the EPB in identifying the enterprise’s greenwashing behavior and reducing the extent of greenwashing.
Second, geographic proximity between EPBs and enterprises reduces the extent of greenwashing by lowering regulatory enforcement costs. In economic activities, the closer the geographic proximity of different economic agents, the lower their mutual transaction and performance costs, such as transportation and communication costs. Conversely, when geographic distances are long, information users may face limitations in acquiring and accessing information. The geographical distance barrier may prevent information users from obtaining a complete and accurate understanding of the situation. Given the constraints of limited regulatory resources, environmental protection regulators typically prioritize regulating and inspecting enterprises that are geographically clustered together during site visits. The close geographical proximity between the EPB and the enterprises reduces the cost of acquiring environmental information and regulatory enforcement by the EPB on the enterprises. This proximity is beneficial for regulating the greenwashing behavior of the enterprises and decreasing the extent of corporate greenwashing.
Third, Geographic proximity between EPBs and enterprises reduces corporate greenwashing by enhancing the regulatory deterrent effect. According to the theory of public regulation, geographic proximity increases the perceived intensity of the regulatory system by enterprises, considering the regulatory resource base and regulatory attention. The closer the geographical proximity between EPBs and enterprises, the greater the psychological pressure on enterprises to comply with EPB regulations. Closer environmental regulations can curb the opportunistic tendencies of enterprises, encourage them to invest more effort in implementing green activities, prompt them to proactively address and fully meet the value expectations and needs of investors, consumers, the social environment, and other stakeholders, and decrease the extent of corporate greenwashing. Therefore, this paper proposes the following hypothesis: the closer the EPB is to the enterprise, the lower the degree of information asymmetry between the EPB and the enterprise, resulting in reduced regulatory enforcement costs, increased regulatory deterrence, and decreased greenwashing practices (referred to as the “distance decay effect” of transaction costs).
Research Hypotheses
H1a: The geographical distance between the enterprises and the local environmental protection bureaus is significantly negatively correlated with the degree of corporate greenwashing.
H1b: The geographical distance between the enterprises and the local environmental protection bureaus is significantly positively correlated with the degree of corporate greenwashing.
Data and Empirical Design
Samples and Data Sources
This study takes all listed enterprises in A-share(Shanghai Stock Exchange and Shenzhen Stock Exchange) as the initial sample and chooses 2009 to 2021 as the sample interval. The relevant data was obtained from the CSMAR database (https://data.csmar.com/), annual reports of listed enterprises, and social responsibility reports. the initial samples are screened based on the following criteria: (1) excluding the financial industry samples; (2) excluding the samples of ST (Abnormal financial situation or other unusual circumstances) and *ST (Delisting risk warning) enterprises; (3) excluding the samples missing from the key variables. In order to mitigate the impact of outliers, the continuous variables in this paper are adjusted by 1% above and below. Our final sample consists of 24,508 observations.
Definition of Variables
Environmental Regulatory Distance
Referring to Degryse and Ongena (2005), Y. Lu et al. (2019), the panel data is created by gathering the addresses of EPBs in each province and city, and then matching the latitude and longitude of enterprises with those of the EPBs. The measurement steps are as follows: (1) EPB distances are transformed into panel data by gathering the addresses of EPBs at each level and parsing them into latitude and longitude coordinates. (2) According to the office address information of listed enterprises provided by the CSMAR database, the detailed address variables of enterprises are synthesized and resolved into the latitude and longitude coordinates. (3) We calculate the distance based on the EPB latitude and longitude and the enterprise latitude and longitude.
Corporate Greenwashing
From the perspective of environmental information disclosure, it refers to the enterprises’ environmental information disclosure, which adopt symbolic disclosure such as avoiding or evading relevant information, and lack of specific and reliable substantive information disclosure (Lyon & Maxwell, 2011; Lyon & Montgomery, 2015). Draws on Walker and Wan (2012), Pan et al. (2019), this study analyzes the content of environmental information disclosed in the sample’s corporate social responsibility report, constructing 11 items to identify symbolic and substantive environmental disclosure behaviors, referring to Appendix 1 for further details. The degree of greenwashing can be quantified by calculating the ratio of symbolic environmental disclosures to substantive environmental disclosures. A higher ratio indicates a greater degree of greenwashing, while a lower ratio suggests a more genuine commitment to environmental practices. The specific formula for calculating the degree of corporate greenwashing is shown below:

Xi is represents whether enterprises has symbolic environmental disclosure behavior, if so, 1, if not, 0. Similarly, Yi represents whether enterprises has substantive environmental disclosure behavior, which is 1 if it does and 0 if it does not. The numerator represents the total score of symbolic environmental disclosure behavior, while the first half of the denominator corresponds to the total score of substantive environmental disclosure behavior. This considers that some enterprises engage only in symbolic environmental disclosure without substantive environmental disclosure, hence an additional 1 is added to the denominator. Finally, standardization was applied. The higher the GWit, the higher the degree of corporate greenwashing.
In addition, we also introduce a number of control variables in the regression: company size (SIZE), enterprise age (AGE), asset-liability ratio (LEV), return on assets (ROA), growth rate of total assets (GROWTH), shareholding structure (CONCENTRATION), and whether state-owned enterprises (OWNERSHIP). Refer to Appendix 2 for the definitions of all control variables.
The descriptive statistics for the aforementioned variables are presented in Table 1.
Descriptive Statistics.

Model Setting
The basic econometric model is set up as follows:

where i is the corporate, t is time, the dependent variable GWit denotes the degree of greenwashing of corporate i in period t, the independent variable Distancei denotes the geographical distance between the corporate i and the EPB, Xit is a series of control variables,
Empirical Results and Discussion
Baseline Results
Table 2 presents baseline regression results, with each column controlling for firm and year fixed effects. In particular, the coefficient for Distance has a significantly negative impact at the 1% level. Upon the inclusion of additional control variables, the coefficient for Distance in column (2) continues to exhibit a significantly negative impact and successfully passes the significance test at the 1% level. This result shows that the further the geographical distance between listed enterprises and the EPB, the lower the degree of corporate greenwashing, in other words, the “distance decay effect” of government-enterprise collusion plays a dominant role.
Baseline Regression Results.

Note. Robustness standard errors clustered to the industry level are in parentheses. Y = inclusion of control variables.
Significant correlation at 1% levels, the control variables include company size, enterprise age, asset-liability ratio, return on net assets, growth rate of total assets, shareholding structure, and whether state-owned enterprises.
Endogenous Test
Because of the possibility of coordinated site selection by the EPB and enterprises, this can lead to a possible endogenous problem. On one hand, there is the issue of endogenous site selection by the EPB. The more enterprises are located in an area, the more concentrated the environmental protection departments become. This concentration aims to facilitate management and reduce the cost of regulatory enforcement. On the other hand, there is the problem of endogenous site selection by enterprises. They tend to choose locations in areas with well-developed economic and traffic conditions to access favorable policies and political resources. As a result, they may proactively select areas where environmental protection departments are more concentrated.
For the endogenous siting problem of the EPB, we use the ratio of the number of EPBs to the number of enterprises within the city in 1989 as an instrumental variable for the geographical distance between the EPB and enterprises for estimation. From the founding of the People’s Republic of China until the period of reform and opening up, there was no separate environmental protection department within the central government structure, primarily because environmental protection was not a prominent issue and public awareness was limited. In 1988, the State Environmental Protection Bureau was officially separated from the Ministry of Urban and Rural Construction. It became an organization directly under the State Council and also served as the office of the Environmental Protection Committee of the State Council. Its main responsibility is to oversee national environmental protection efforts and to provide specific guidance and planning for the establishment of environmental protection organizations by local governments. In 1989, the Environmental Protection Law of the People’s Republic of China was promulgated and formally implemented, providing a legal foundation for the country’s environmental protection initiatives. Following the enactment of this law, governments at all levels established or strengthened their environmental protection organizations, further promoting the establishment and development of local environmental protection bureaus. First, the distributional characteristics of modern Environmental Protection Bureaus evolved to some extent from the 1989 environmental protection agency system, indicating that this instrumental variable meets the relevance assumption condition. Second, the Environmental Protection Law of the People’s Republic of China (1989) focused on the prevention and control of pollution and other public nuisances. At that time, the government’s environmental protection regulatory system was not yet fully developed, and there were no policies mandating the disclosure of environmental information by enterprises. In this context, the impact of this instrumental variable on corporate greenwashing is minimal, as it satisfies the exogeneity hypothesis condition.
For enterprises’ endogenous site selection, drawing on L. Fan et al. (2020), the regression equation includes an interaction term between enterprises’ degree of greenwashing in the year prior to the sample and the year dummy variable (GW
Endogeneity Test: Using 2SLS Method.

Note. Robustness standard errors clustered to the industry level are in parentheses.
and **Significant correlation at 1% and 5% levels, cdf represents Weak identification test (Cragg-Donald Wald F statistic), rkf represents Weak identification test (Kleibergen-Paap rk Wald F statistic). The control variables include company size, enterprise age, asset-liability ratio, return on net assets, growth rate of total assets, shareholding structure, and whether state-owned enterprises.
Based on the above endogeneity treatment idea, all subsequent tests in this study are analyzed using instrumental variable models.
Collusion or Regulation?
Government-Enterprise Collusion Effect
According to the previous analysis of the theoretical mechanisms, the geographical proximity of the EPB to enterprises creates favorable conditions for government-enterprise collusion. Resource dependence theory posits that a firm’s decisions, activities, and outcomes are influenced by factors related to resource allocation and inter-organizational network relationships (Pfeffer & Nowak, 1976). Firms often collaborate with other organizations to secure essential resources, such as engaging in government-enterprise collusion through rent-seeking to acquire additional reputational and economic benefits while evading penalties (S. Y. Wang, 2014). From the government’s perspective, most officials’ career advancements or changes are confined to their administrative regions, which fosters systematic and stable local personnel networks conducive to forming relational ties and structural associations (Zhu, 2019). Furthermore, local governments may prioritize economic development over environmental protection, occasionally relaxing environmental regulations to promote polluting industries (Bai et al., 2019). When EPBs is in closer proximity to enterprises, those enterprises are more likely to engage in communication with the EPB, thereby establishing government-enterprise collusion through stronger political affiliations (Su & Littlefield, 2001). This study draws on the research of C. J. P. Chen et al. (2011) and uses whether the company is politically connected (PC) and the level of political connection (PCLevel) to measure the government-enterprise collusion effect. In particular, a company is defined as politically connected if either of its chairman and general manager is or has been a government official. The political connection level (PCLevel) can be utilized to measure the extent of political affiliation of a company’s executives. This involves categorizing the company’s chairman or general manager based on their past or current roles as a cadre at the district and county level, municipal cadre, provincial cadre, or national cadre, and establishing a fixed-order variable.
The results in Table 4 are as follows, and the results in Column (1) indicate that the degree of corporate greenwashing of politically affiliated enterprises is higher under the condition of a certain distance, which is consistent with the our expectation. After incorporating the interaction term between geographical distance and the degree of political affiliation into the regression equation, the regression results in column (2) show that the degree of political-enterprise collusion is more significant when either the chairman of the board of directors and the general manager of the company is or has been a government official at the district or county level, at the provincial level, or at the national level. Most district and county officials spend their entire careers within their respective administrative areas. This long-term presence and interaction foster the development of closely interwoven social relationships and local interests (Zhu, 2019). Provincial and national officials wield greater power, which can facilitate a certain degree of collusion between government entities and businesses.
Collusion Effect.
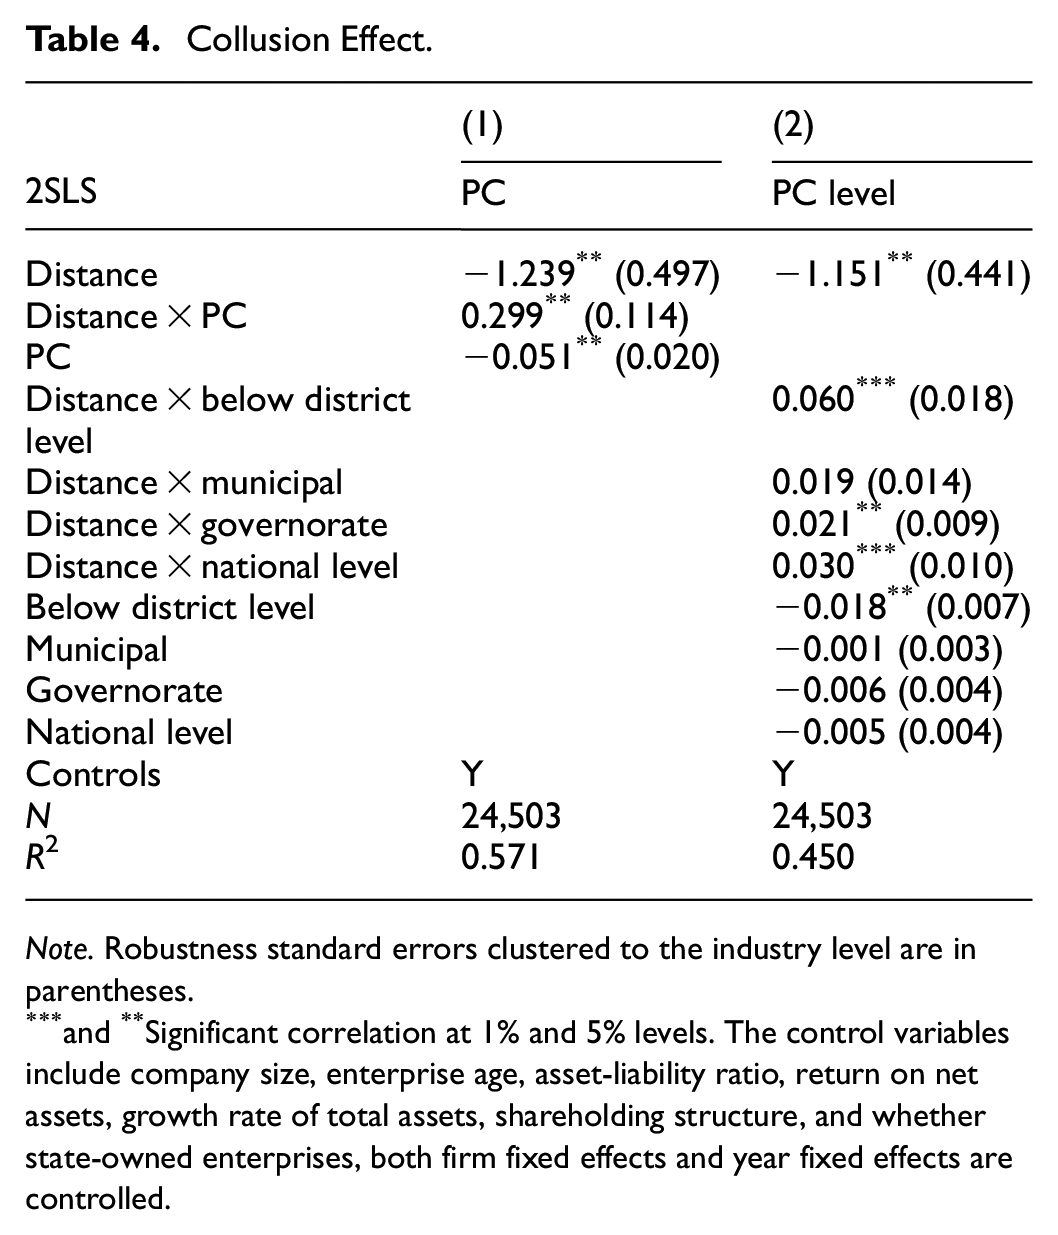
Note. Robustness standard errors clustered to the industry level are in parentheses.
and **Significant correlation at 1% and 5% levels. The control variables include company size, enterprise age, asset-liability ratio, return on net assets, growth rate of total assets, shareholding structure, and whether state-owned enterprises, both firm fixed effects and year fixed effects are controlled.
Regulatory Effect
Based on the preceding theory, regulatory information asymmetry, regulatory enforcement costs, and regulatory deterrence effect are the three channels through which the EPB regulatory distance affects the degree of corporate greenwashing. Drawing on the studies of Kedia and Rajgopal (2011) and Ryan et al. (2014), this paper uses whether enterprises are high in intangible assets to measure the degree of regulatory information asymmetry (The higher the intangibles, the higher the information asymmetry), the number of enterprises in the region and the size of the enterprises to measure the cost of regulatory enforcement (The greater the number and size of enterprises, the higher the cost of regulatory enforcement), and the level of government subsidies received by the enterprises to measure the deterrent effect of regulation (The higher the government subsidy, the stronger the regulatory deterrent effect), and constructed regression analyses of these three interaction terms with EPB regulatory distance .
The regression results in Table 5 show that the coefficients of Distance × whether high intangible assets, Distance × Whether high number of enterprises * size of enterprises, and Distance × whether high government subsidies are insignificant, which suggests that the findings of this study are robust, this suggests that the regulatory effect fails to dominate the mechanism by which distance from environmental regulation affects the degree of corporate greenwashing, confirming the “distance decay effect” of government-enterprise collusion effect.
Regulatory Effect.

Note. Robustness standard errors clustered to the industry level are in parentheses.
Significant correlation at 10% levels, The control variables include company size, enterprise age, asset-liability ratio, return on net assets, growth rate of total assets, shareholding structure, and whether state-owned enterprises, both firm fixed effects and year fixed effects are controlled.
Robustness Test
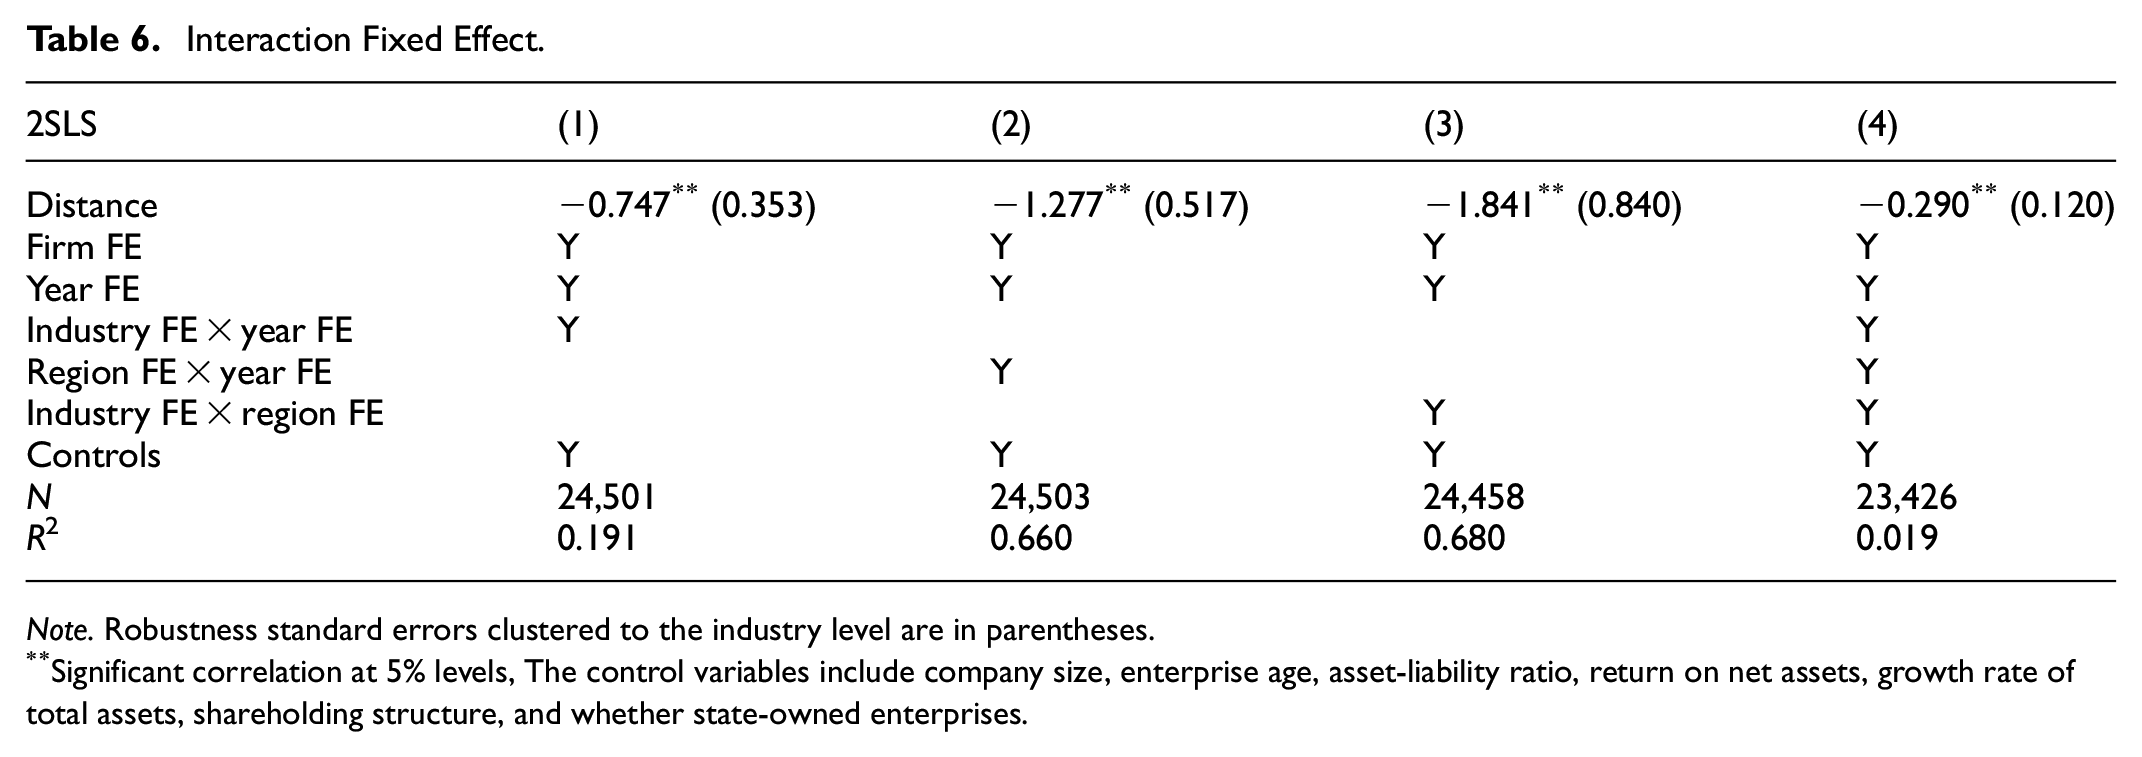
Interaction Fixed Effect
To further control for possible unobservable variables, this paper uses interaction fixed effects. Specifically, industry and year interaction fixed effects, region and year fixed effects, industry and region fixed effects are added to model (2). After controlling for the three interaction fixed effects, the regression results in the Table 6 show that the impact coefficients of distance are all significantly negative at the 5% level, which indicates that the findings of this paper are robust.
Interaction Fixed Effect.
Note. Robustness standard errors clustered to the industry level are in parentheses.
Significant correlation at 5% levels, The control variables include company size, enterprise age, asset-liability ratio, return on net assets, growth rate of total assets, shareholding structure, and whether state-owned enterprises.
Clustering Robust Standard Error
In order to obtain more robust conclusions, overcoming heteroskedasticity and correlation issues, improving estimation accuracy, this paper performs a double clustering analysis of standard errors at the industry and year, city and year, and industry and city levels. The regression results in Table 7 indicate that the findings of this paper remain robust.
Clustering Robust Standard Error.

Note. Robustness standard errors clustered to different levels are in parentheses.
, **, and *Significant correlation at 1%, 5%, and 10% levels. The control variables include company size, enterprise age, asset-liability ratio, return on net assets, growth rate of total assets, shareholding structure, and whether state-owned enterprises, both firm fixed effects and year fixed effects are controlled.
Replace the Geographical Distance Measure
In order to exclude the effect of variable measurement error on the estimation results, this paper draws on Knyazeva and Knyazeva (2012) to further measure the average distance from enterprises to the EPB and whether the distance from enterprises to the EPB is greater than 5 and 10 km. The corresponding regression results are presented in columns (1) to (3) of the Table 8, respectively, the impact coefficients of Distance are all significantly negative at the 10% level, which still support the findings of the previous study.
Replacement of Independent Variables.

Note. Robustness standard errors clustered to the industry level are in parentheses.
and *Significant correlation at 5% and 10% levels. Model 1 replaces the independent variable with the average distance, Model 2 replaces the independent variable with whether the distance is greater than 5 km, and Model 3 replaces the independent variable with whether the distance is greater than 10 km. The control variables include company size, enterprise age, asset-liability ratio, return on net assets, growth rate of total assets, shareholding structure, and whether state-owned enterprises, both firm fixed effects and year fixed effects are controlled.
Excluding Other Policies
Environmental regulatory distance is endogenous to government behavior. Therefore, environmental regulatory policies implemented by the government can have an impact on the effect of environmental regulatory distance, leading to the possibility of overestimation of the estimation results in this paper. To this end, we collect relevant environmental policies implemented in China during the window period 2009 to 2021 studied in this paper, including environmental protection inspectorate, new environmental protection law, environmental protection fees to taxe, carbon emissions trading pilot, and low-carbon pilot. Specifically, the net effect of environmental regulatory distance is obtained by constructing the double difference term of the above policies as a control variable to be added into the model to exclude the effect of that specific type of environmental regulatory policy. Columns (1) to (5) of the Table 9 give the corresponding regression results, respectively, and the coefficients of distance are all significantly negative at the 5% level. After controlling for the effects of the above policies simultaneously in column (6), the effect of environmental regulatory distance on the degree of corporate greenwashing is still significant, again illustrating the robustness of the results of this paper.
Excluding Other Policies.

Note. Robustness standard errors clustered to the industry level are in parentheses.
and *Significant correlation at 5% and 10% levels. The control variables include company size, enterprise age, asset-liability ratio, return on net assets, growth rate of total assets, shareholding structure, and whether state-owned enterprises, both firm fixed effects and year fixed effects are controlled.
Heterogeneity Analysis
Regional Characteristics Heterogeneity
The economic development and policy orientations of China’s regions exhibit significant regional disparities, and the effect of reducing the distance of environmental regulation on the extent of greenwashing by enterprises in different regions varies. With unique geographical advantages, abundant resources, and national policy support, the eastern region has experienced rapid economic development. In contrast, although the pace of economic development in the central and western regions is also accelerating, there is still a gap between their overall economic development level and that of the eastern regions. Provincial capitals, as the political, economic, and cultural centers of the provinces, play a crucial role for local governments and often receive more policy support. Sub-provincial cities typically assume more regional and national responsibilities compared to provincial capitals. In terms of administrative hierarchy, a sub-provincial city is a city with special administrative status established in China’s administrative division. In these cities, the main leading cadres of the party and government organs hold provincial ministerial-level positions. The administrative level of the main leading cadres of the party and government organs in provincial capital cities is the provincial level.
In order to examine the effect of heterogeneity in geographic location, this paper conducts group regression from the perspectives of whether enterprises are located in the eastern region, provincial capital cities, or sub-provincial cities. According to “Strategies and Policies for Coordinated Regional Development” issued by the Development Research Center of the State Council, the article divides China’s economic regions into eastern and non-eastern regions. The eastern region comprises 11 provinces: Beijing, Tianjin, Hebei, Liaoning, Shanghai, Jiangsu, Zhejiang, Fujian, Shandong, Guangdong, and Hainan. The remaining provinces are classified as non-eastern regions. According to the document “Opinions on Certain Issues of Sub-provincial Cities” issued by the Central Committee for Institutional Preparation, we classify 15 cities—Guangzhou, Wuhan, Harbin, Shenyang, Chengdu, Nanjing, Xi’an, Changchun, Jinan, Hangzhou, Dalian, Qingdao, Shenzhen, Xiamen, and Ningbo—as sub-provincial cities, with all others classified as non-sub-provincial cities. Provincial capital cities are categorized based on the administrative divisions of the People’s Republic of China. The results of the regression are shown in Table 10 (1) to (4). The coefficients of Distance for enterprises in non-eastern regions, non-provincial capital cities, and non-sub-provincial cities are all significantly negative at the 5% level, while the Distance coefficients for enterprises in eastern regions, provincial capital cities, and sub-provincial cities are not significant. This suggests that the impact of environmental regulatory distance on the extent of greenwashing is more pronounced in regions outside the east, non-capital cities, and non-sub-provincial cities. Compared to non-eastern regions, non-capital cities, and non-sub-provincial cities, eastern regions, capital cities, and sub-provincial cities have superior infrastructures, are more heavily regulated by the government, and face greater pressure. Consequently, the cost of rent-seeking is higher, making it more challenging for enterprises to engage in government-enterprise collusion through rent-seeking.
Regional Characteristics Heterogeneity.

Note. Robustness standard errors clustered to the industry level are in parentheses.
and **Significant correlation at 1% and levels. The control variables include company size, enterprise age, asset-liability ratio, return on net assets, growth rate of total assets, shareholding structure, and whether state-owned enterprises, both firm fixed effects and year fixed effects are controlled.
Industrial and Corporate Characteristics Heterogeneity
Industry concentration reflects the level of competition in the market. This paper uses the Herfindahl index to measure industry concentration. Enterprises with low industry concentration face greater market competition. In highly competitive industries, product turnover is faster, consumer demands shift rapidly, and market dynamics change quickly. In order to establish a presence in the market, enterprises must continuously introduce new products, technologies, or services to attract consumers and maintain a competitive edge. In highly competitive industries, enterprises may often compete for market share through price wars. This may result in lower product prices and compressed profit margins. Enterprises may seek other ways to increase profitability, such as engaging in rent-seeking. The business characteristics of enterprises vary at different stages of the production cycle. This paper constructs the business life cycle based on the cash flow classification method proposed by Dickinson (2011), which categorizes firms into two groups: mature and immature. Enterprises in the mature stage are well-funded and have strong viability and competitiveness. During the immature period, enterprises may encounter challenges such as an unstable market share, lack of technological maturity, and a shortage of capital. Consequently, they are more inclined to seek external support through rent-seeking behavior (Jeong & Weiner, 2012).
To examine the effect of heterogeneity in industry and enterprises characteristics, this paper runs separate group regressions for enterprises that are high industry concentration or not and enterprises that are mature or not, respectively. The results in columns (1) to (4) of Table 11 show that the effect of environmental regulatory distance on the degree of greenwashing is more significant for enterprises with low industry concentration and enterprises that are not mature, which is in line with our expectation (J. Li & Liang, 2016; Xia et al., 2019).
Industrial and Corporate Characteristics Heterogeneity.

Note. Robustness standard errors clustered to the industry level are in parentheses.
and *Significant correlation at 5% and 10% levels. The control variables include company size, enterprise age, asset-liability ratio, return on net assets, growth rate of total assets, shareholding structure, and whether state-owned enterprises, both firm fixed effects and year fixed effects are controlled.
Further Analysis
Based on established theories, this paper further analyzes the relationship between environmental regulatory distance and corporate greenwashing from stakeholder and digital development perspectives. Stakeholders are all individuals and groups that can influence the achievement of an organization’s goals or are affected by the process of an organization achieving its goals (Freeman, 1984). Shareholders are one of the many stakeholders. The public, government, and others are also important stakeholders of the enterprise, and they can have a significant impact on the enterprise’s behavior. With the rapid development of internet technology, the information age has arrived, sparking an increasingly heated discussion about whether geographical distance still holds influence in the present time. Network infrastructure, as an essential component of infrastructure, is a fundamental cornerstone for achieving information interconnection. In 2013, the State Council promulgated the “Broadband China Strategy and Implementation Plan” to enhance the construction of network infrastructure. The implementation of the “Broadband China” strategy not only promotes the popularization and development of the Internet but also effectively reduces the cost of information collection and access. Therefore, it is necessary to incorporate network infrastructure construction into the analytical framework of environmental regulatory distance and corporate greenwashing.
Drawing on Miller (2006), Z. Chen et al. (2018), S. Y. Wang (2014) and other sources, this paper utilizes the annual media reports’ quantity (the logarithm of the total media reports of the sample firms in each sample year) as an indicator of media attention. It also considers the level of equity concentration as a proxy for shareholder monitoring, the frequency of environmental protection terminology used by the local government as a gage of government environmental concerns, and lastly, the “broadband China” pilot policy as an indicator of network infrastructure development. The “Broadband China” pilot policy aims to assess network infrastructure construction. Table 12 (1) to (4) present the relevant regression results. We found that the coefficients of the interaction terms between environmental regulatory distance and these four factors are significantly positive. The results indicate that media attention, shareholder monitoring, government environmental concern, and network infrastructure construsction are positively related to the degree of corporate greenwashing when regulatory distance is taken into account. Legitimacy is a central concept in institutional theory that refers to the alignment of an organization’s behavior with specific social institutions and cognitive norms (Suchman, 1995; Weber et al., 1996). It is insufficient for firms to merely meet legal requirements or market demands; they must also adhere to the prevailing norms and values of society to achieve broader social acceptance. If a firm’s behavior is not positively received by stakeholders, it will encounter challenges and pressures regarding its legitimacy (DiMaggio & Powell, 1983; Zhang et al., 2023). Based on legitimacy theory, when the network infrastructure is more developed, media attention and government environmental concern are higher, and enterprise equity concentration is greater. In other words, when the enterprise faces increased legitimacy pressure, managers may exhibit a short-sighted tendency(Z. Fan et al., 2024) and be more inclined to engage in “greenwashing” behaviors through rent-seeking activities.
Further Analysis.

Note. Robustness standard errors clustered to the industry level are in parentheses.
, **, and *Significant correlation at 1%, 5%, and 10% levels, The control variables include company size, enterprise age, asset-liability ratio, return on net assets, growth rate of total assets, shareholding structure, and whether state-owned enterprises, both firm fixed effects and year fixed effects are controlled.
Conclusion
In the context of China’s economic and social development and the comprehensive green transformation, strengthening corporate green governance is crucial to enhancing the efficiency of environmental governance and establishing a sustainable environmental governance system. decay. In the existing literature, geo-economic theories are rarely integrated into the study of corporate greenwashing, particularly regarding the factors that influence this phenomenon. Additionally, the mechanism by which geographic distance affects corporate greenwashing requires further clarification. This paper begins with the hypothesis of “distance decay effect” in geo-economic theory and investigates the impact of geographical distance on corporate greenwashing under the supervision of the EPBs. The analysis is based on a sample of A-share listed companies in China from 2009 to 2021.We find that, there is a negative correlation between environmental regulatory distance and the degree of corporate greenwashing. In other words, the further the geographical distance between listed enterprises and the EPB, the lower the degree of corporate greenwashing, which supports the dominant role of the “distance decay effect” of corporate rent-seeking rather than governmental regulation. That is, the geographical proximity of enterprises to the EPB can improve the environmental rent-seeking ability of enterprises by maintaining the rent-seeking chain and reducing the rent-seeking costs of enterprises, thus facilitating the conduct of greenwashing by enterprises. This conclusion is still valid after the robustness test of substituting variable indicators and controlling for possible endogeneity problems. The results of the heterogeneity analysis show that geographical distance has a greater impact on non-eastern enterprises, enterprises in non-provincial capitals or sub-provincial cities, enterprises with low industry concentration, and enterprises that are not mature. Further research shows that media attention, shareholder monitoring, government environmental protection concern and network infrastructure construction are positively related to the degree of corporate greenwashing after taking regulatory distance into account, providing new empirical evidence for legitimacy theory.
The findings of this paper have several important policy implications:
First, the government should enhance environmental laws and regulations while strengthening its oversight of greenwashing practices. To begin with, the government must increase its scrutiny of corporate environmental information disclosure. This includes clearly defining the criteria for identifying greenwashing and establishing a penalty mechanism that ensures the costs of punishment for enterprises engaged in greenwashing exceed their potential benefits. This approach will encourage companies to actively fulfill their environmental responsibilities. Secondly, leveraging the technical advantages of artificial intelligence and big data, a unified environmental information-sharing platform should be developed. This platform will enable the government to obtain accurate corporate environmental information in a timely manner, effectively addressing the issue of information asymmetry. Additionally, by utilizing data-driven environmental management tools, the government can enhance off-site supervision and improve the overall efficiency of its regulatory efforts.
Second, it is essential to establish and enhance a long-term mechanism for central environmental protection inspections, ensuring the effective implementation of pollution control responsibilities. First, by normalizing environmental protection inspections, the central government should impose severe penalties on local governments and polluting enterprises that engage in environmental greenwashing. This will strengthen the deterrent effect of supervision, effectively combat the collusion between government and businesses, establish a healthy relationship between politics and commerce, and promote the effectiveness of regional environmental protection and pollution control efforts. Secondly, the central government should develop a green performance appraisal system that incorporates environmental protection indicators as a key focus of government performance evaluations. This system should make environmental protection an important criterion for the promotion of local officials, clearly define the responsibilities of all levels of government and environmental protection departments, and foster a collaborative environment that encourages coordinated efforts from top to bottom.
On the one hand, this paper expands the literature on the factors affecting corporate greenwashing, and uses geographical proximity as a bridge to study the effect of geographical distance between enterprises and the EPB on corporate greenwashing; on the other hand, from the perspective of the EPB, we analyze how the geographical distance between the EPB and enterprises affects corporate greenwashing through the regulatory effect and the government-enterprise collusion effect, which further enriches the research on the mechanism of geographical distance and corporate greenwashing and may provide new empirical evidence for the “distance decay effect” in geo-economics. In addition, the findings of this paper can provide empirical support for developing country governments to guide corporate disclosure practices from an institutional perspective. Simultaneously, they can offer references for the formulation of policies and regulations by relevant national authorities. It is important to acknowledge that this study has certain limitations. This paper primarily assesses corporate greenwashing behavior through the lens of environmental information disclosure, resulting in a somewhat narrow research perspective. In the future, we aim to adopt a multidimensional approach to systematically evaluate corporate greenwashing behavior.
Footnotes
Appendix
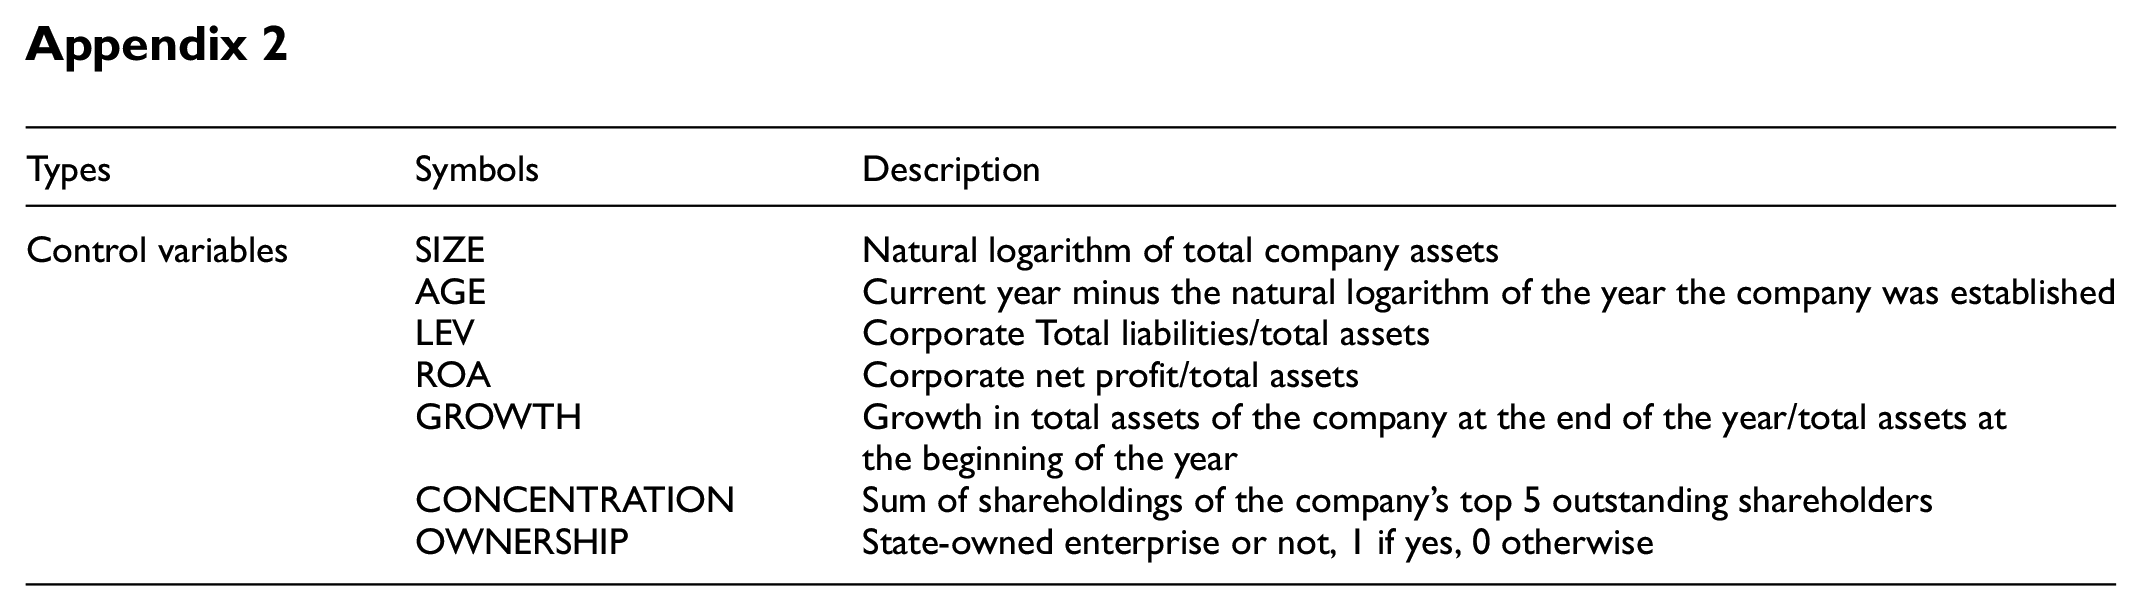
| Types | Symbols | Description |
|---|---|---|
| Control variables | SIZE | Natural logarithm of total company assets |
| AGE | Current year minus the natural logarithm of the year the company was established | |
| LEV | Corporate Total liabilities/total assets | |
| ROA | Corporate net profit/total assets | |
| GROWTH | Growth in total assets of the company at the end of the year/total assets at the beginning of the year | |
| CONCENTRATION | Sum of shareholdings of the company’s top 5 outstanding shareholders | |
| OWNERSHIP | State-owned enterprise or not, 1 if yes, 0 otherwise |
Author Contributions
Bin Wang: Funding acquisition, preparation, Validation, Writing review & editing. Xuejing Liu: Writing—original draft, Visualization, Investigation, Writing review & editing. Bo Li: Conceptualization, Methodology, Software, Data curation, Visualization, Investigation. Daqian Shi: Conceptualization, Methodology, Software, Data curation, Visualization, Investigation.
Funding
The authors disclosed receipt of the following financial support for the research, authorship, and/or publication of this article: This paper was supported by The National Social Science Fund of China (Bin Wang; 20BJY071) and National Natural Science Foundation of China (Daqian Shi; 72503173).
Declaration of Conflicting Interests
The authors declared no potential conflicts of interest with respect to the research, authorship, and/or publication of this article.
Data Availability Statement
The data that support the findings of this study are available from the corresponding author upon reasonable request.