
Abstract
This study investigates how university knowledge spillovers and intellectual property (IP) protection jointly influence innovation performance in high-tech firms. Analysing an unbalanced panel dataset of China’s A-share listed companies (475 firms; 3,339 observations) and higher education institutions in Guangdong Province (2011–2020), we employ a Cobb-Douglas production function measured through total factor productivity. Empirical results reveal substantial heterogeneity in innovation levels across technology firms. Critically, university knowledge spillovers exhibit a significant positive effect on innovation performance, while IP protection exerts a negative moderating effect that attenuates spillover efficacy. These findings extend theoretical frameworks on knowledge spillovers and corporate innovation, refine understanding of IP governance trade-offs, and provide actionable evidence for corporate strategy and science policy design.
Plain language summary
This study examines the interrelationships between knowledge spillovers from universities, intellectual property (IP) protection, and innovation performance. It is based on the data of China’s A-share listed companies and the statistics from higher education institutions for 2011–2020, focusing on high-tech listed companies and universities in Guangdong Province. The Cobb–Douglas production function was used to construct a mathematical model, which was further measured using the total factor productivity method. An unbalanced panel dataset was built based on data from 475 firms (3,339 observations) and university knowledge spillovers in Guangdong Province, followed by an empirical analysis. This study reveals the following: a huge gap in innovation levels exists among listed technology firms, knowledge spillovers from universities have a significant positive effect on the innovation performance of technology firms, and the level of IP protection has a negative moderating effect. This study expands the theories of corporate innovation and knowledge spillovers, offers new insight into IP protection, and provides empirical evidence for corporate and government decision-making.
Introduction
The growing demand for teaching, research, and technology transfer has prompted most universities to transform their ‘ivory tower’ model into an ‘innovation university’ (Audretsch, 2014; Messeni Petruzzelli & Murgia, 2020). This paradigm catalyses industry-academia collaboration by fostering deeper university engagement with external stakeholders, particularly enterprises (Ankrah & AL-Tabbaa, 2015; Perkmann et al., 2013). Industry-academia partnerships allow universities to diversify funding sources, access additional resources and knowledge, and enhance comprehension of industrial challenges and dynamics (Messeni Petruzzelli & Murgia, 2020). Against a backdrop of accelerating technological change and industrial restructuring, firms face intensifying global competition and rising R&D expenditures. This dilemma is leading companies to seek external innovation resources while increasing their internal R&D investments (Arora et al., 2020). Industry-academia collaboration effectively integrates corporate commercial capabilities with university scientific knowledge, enabling valuable innovation creation (Soh & Subramanian, 2014).
Advances in information and communication technologies are accelerating the transition to a knowledge-intensive global economy, positioning knowledge as a critical strategic resource for modern organizations (Jones & Ratten, 2021). Firms must evaluate innovation initiative performance to ensure investment efficacy. While established, stable processes are readily measurable, emerging innovations prove challenging to assess due to their dynamic evolution (Kirchhoff et al., 2013). The evolving nature of innovation management further complicates performance measurement. Nevertheless, robust metric systems remain essential, as the effectiveness and efficiency of innovation activities directly determine competitive advantage and organizational longevity (Globerson, 1985).
Identifying drivers and barriers to industry-academia collaboration remains a critical research gap. A key tension arises because cutting-edge academic research is often valued more for educational contributions than commercial potential, receives scepticism about its technological value to industry and national economies (Le et al., 2022). While substantial evidence documents successful conversion of academic research into business innovations (Acs et al., 2013; Jones & Ratten, 2021; Le et al., 2022), others question scientific research’s consistent benefits for innovation. Gittelman and Kogut (2003), for instance, identify an inverse relationship between scientific aptitude and innovation output, suggesting scientific knowledge does not invariably translate to high-impact commercial innovation (Xu et al., 2018). This study’s data reveals China’s 2019 academic patent landscape. China had 2,663 higher education institutions that year. These institutions collectively filed 310,276 patent applications and received 184,934 grants. However, only 6,115 patents were successfully commercialized (Higher Education Press, 2022). This represents a patent sales rate of merely 3.3%. Knowledge transfer rates encompass multiple measures, including patent sales and licencing. While direct conclusions require caution, the data clearly show limited knowledge diffusion to industry.
Existing research on industry-academia knowledge spillovers predominantly examines two dimensions: (1) academic research’s correlation with quantitative outputs (patents, publications, citations), and (2) new venture formation. However, these studies report inconsistent findings (Anselin et al., 1997; Audretsch, 2014; Bianchi & Giorcelli, 2020; García-Vega & Vicente-Chirivella, 2020). While academic research and explicit knowledge are essential, they alone are insufficient to facilitate knowledge spillovers and mitigate emerging risks. Researchers have overlooked how internal R&D strategies may amplify or undermine the value of external collaborations (Perkmann et al., 2013). Therefore, it is essential to investigate external innovation mechanisms beyond internal R&D (Kaya et al., 2020). This requires systematically comparing different factors’ impacts on innovation performance, analysing their relative influence, and assessing how industry-academia collaboration contributes to technological progress and innovation capability enhancement. These connections represent critical yet understudied aspects of innovation research, demanding urgent attention from both academic and industry practitioners in business management.
Based on these considerations, this study examines the interrelationships between knowledge spillovers from universities, intellectual property (IP) protection, and innovation performance. We categorize the study into the following three research questions:
RQ1: What are the components of firm-oriented knowledge spillover from universities? How can universities measure knowledge spillover?
RQ2: Do knowledge spillovers from universities affect the innovation performance of technology firms (i.e., innovation performance)?
RQ3: What is the role of IP protection? What are the underlying mechanisms, pathways, and effects?
The remainder of this paper is organized as follows. Section 2 reviews the literature and presents the conceptual framework and hypotheses formulation. Section 3 describes the variables and data, and Section 4 provides the empirical results. Section 5 summarizes the study and presents conclusions and recommendations.
Theoretical Analysis and Research Hypotheses
University-Industry Knowledge Spillover
Knowledge spillover refers to the process through which geographically proximate firms informally acquire new knowledge, often unintentionally, and subsequently apply it to commercialize goods or services (Acs et al., 2013). This knowledge might be relevant to the application of new technologies, creation of materials, and industrial procedures. This includes explicit knowledge, such as books, patents, and industry reports, as well as tacit knowledge that exists among corporate talent and is difficult to textualise (Cuvero et al., 2022).
Knowledge plays an important role in the business world and companies must leverage it across all levels of their operations. It enables businesses to better use their opportunities and resources (Audretsch & Belitski, 2020). Knowledge spillover is a manifestation of economic externalities. There are two main categories of knowledge spillover studies. The first concerns macroeconomics, which often seeks empirical evidence at the intercity level that knowledge spillover results in increased productivity or city size. The other is a micro-level study of the nature of knowledge spillovers and the process of knowledge diffusion (Vernon Henderson, 2007).
Following early endogenous economic theory (Marshall, 1890; Romer, 1986) on regional economies, management studies began by examining knowledge spillover effects and processes. There are four main schools of thought on research on the mechanism of knowledge spillover between disciplines: knowledge spillover theory of entrepreneurship (Cuvero et al., 2022; Jones & Ratten, 2021); foreign direct investment knowledge spillover (Guo et al., 2022; Vujanović et al., 2022); labour mobility knowledge spillover (Lewis, 2021; Muldoon et al., 2022); and university–industry knowledge spillover (Alexandre et al., 2022; Anselin et al., 1997).
This study focuses on university-driven knowledge spillover, a key area within knowledge spillover research. Universities and the R&D institutional sector are key to knowledge generation. University research helps increase the number of patents in industry, and universities benefit by collaborating entities or projects to conduct R&D (Leyden & Link, 2013). To maximize the impact of academic research, universities and R&D institutions should forge strategic partnerships with industry. Such collaboration aligns research priorities with market needs, enabling effective knowledge spillovers, transfers, and acquisition processes (Audretsch, 2014).
Jaffe et al. (1993) pioneered the empirical demonstration of localized knowledge spillovers from universities. Their landmark study of university patent outputs and 200 U.S. firms revealed that academic presence significantly boosts regional patenting activity. De Silva and Mccomb (2012) find that R&D level and proximity to research institutions positively affect the likelihood of technology entrepreneurship. Hájek and Stejskal (2018) investigate the root causes of knowledge spillovers resulting from collaboration among companies, universities, and R&D organizations. Their study focuses on chemical companies, universities, and chemistry departments in Central and Eastern European countries, such as the Czech Republic, and examines how internal and external financial support influences these spillover benefits. Their findings demonstrate that all forms of knowledge/skill transfer generate spillover effects, enhancing both firm innovation capacity and institutional absorptive capabilities. X. Li et al. (2020) match listed companies with Chinese cities to examine the impact of university on corporate innovation. They find that the number of universities and universities in a city is positively correlated with the number of patents filed by businesses, indicating that universities have a positive spillover effect on corporate innovation. In addition, the knowledge shared by universities with businesses decreases with increasing distance between them.
The current literature on knowledge spillovers between universities and firms has paid insufficient attention to the different types of R&D focus within firms. Most studies on university-firm knowledge spillovers show that universities positively impact nearby firms. However, few observe whether firms with more in-house R&D derive greater benefits from universities than those with less in-house R&D. An important consideration is whether university-firm collaboration generates resource/knowledge duplication, potentially creating redundancy that lowers coordination costs but may diminish original spillover returns. Additionally, regional knowledge disparities and sectoral differences in firms’ absorptive capacities underscore the need for a more holistic policy approach in this field.
Innovation Performance
Innovation has different meanings in different contexts. Innovation involves a wide range of theoretical and practical aspects and comprises four influencing factors: R&D (Freeman & Soete, 2017), investment (Guo et al., 2022), collaboration (García-Vega & Vicente-Chirivella, 2020), and human capital (Amankwah-Amoah, 2018); however, these are not the only variables that can impact innovation. These four factors have been the subject of considerable debate and challenge. Innovation is systemic, affecting every aspect of a business from R&D to employees and influences multiple functions in various ways, depending on the nature of the activity. Therefore, there are many connections between studies on innovation, knowledge management, and organizational learning (Jia et al., 2014).
Innovation performance is an indicator to quantify and measure innovation; it can be understood into broad and narrow senses (Hagedoorn & Cloodt, 2003). Based on Hong et al.’s (2019) definition of innovation performance, this study states that innovation performance in a narrow sense emphasizes innovation efficiency and the value generated by innovation. Which including the speed of development of new products, technologies, and equipment. In a broad sense, innovation performance involves the evaluation of innovation outcomes and focuses on the entire innovation process in an organization.
According to Kaplan and Norton’s (1992) seminal work, traditional enterprise performance evaluation primarily relied on two dimensions: financial performance indicators including return on investment and payback period, alongside operational efficiency metrics such as productivity and cycle time. Over the last decade, performance has usually been measured using the following indicators: profit, revenue, growth, productivity, efficiency, stock price, new markets, and exports (Ramadani et al., 2017).
Innovation management is continuously evolving, posing serious challenges for organizations in terms of performance measurement. Nevertheless, a robust performance measurement system is crucial, directly influencing a company’s competitiveness and long-term viability through operational effectiveness and efficiency.
University Knowledge Spillover and Innovation Performance
University spillovers might affect business innovation in three ways. First, the university trains many individuals with general knowledge and professional expertise in society, who then transfers their knowledge to businesses and research institutions (Bianchi & Giorcelli, 2020; Leyden & Link, 2013). Second, universities transfer cutting-edge knowledge to firms through formal technology transfers or collaborative R&D, enhancing corporate innovation competitiveness (García-Vega & Vicente-Chirivella, 2020). Finally, enterprises, universities, and research institutes cooperate in R&D and, through collaborative innovation, influence the innovation of enterprises. Extensive empirical evidence confirms that university-industry collaboration effectively enhances corporate technological and innovation capabilities (Alexandre et al., 2022; Ankrah & AL-Tabbaa, 2015; Wang & Hu, 2020). Existing literature provides the theoretical rationale for the influence pathway between university knowledge spillover and enterprise innovation. Furthermore, according to several scholars (Burrus et al., 2018; Kitsios & Kamariotou, 2016; Singh et al., 2021), technological improvements can effectively promote business innovation. Based on this logical link, we propose hypothesis H1 for the empirical examination of this study:
H1: Knowledge spillovers from universities have a significant positive impact on enterprises’ innovation performance.
Intellectual Property Protection
Intellectual property (IP) is becoming increasingly important for companies. One key reason is that the innovation process relies heavily on knowledge, and profiting from knowledge is an important aspect of innovation management, especially for high-tech companies (Mardani et al., 2018). Patents, copyrights, and trade secrets are crucial for a company’s supply chain projects and partnerships. Intellectual property rights (IPR) can also be utilized to create revenue, defend a company’s competitive position, and demonstrate competitiveness (Guderian et al., 2021). Therefore, a deeper understanding of IP in context of innovation management is essential. Candelin-Palmqvist et al. (2012) suggest that the issue of IP is complex and multifaceted because it involves different rights such as patents, copyrights, trademarks, industrial designs, geographical indications, and trade secrets. The relevant legal frameworks include patent litigation laws (Appel et al., 2019; Mezzanotti, 2021), trademark laws (Nasirov, 2020), and IP protection laws (Fang et al., 2017; Papageorgiadis & Sharma, 2016). Legislation varies across countries and even regions within the same country. Consequently, it is important to examine IP protection at both micro and macro levels—regional, industry, and firm levels.
The IP protection system is a crucial component of the legal environment, particularly the patent system. Because it effectively corrects the positive externalities of innovators’ innovation output while granting inventors a temporary monopoly (Fang et al., 2017; Kline et al., 2019; Papageorgiadis & Sharma, 2016). The impact of IP protection levels on knowledge spillovers and innovation performance remains debated in the literature.
For example, Barra et al. (2019) and Gong et al. (2020) indicate that regional differences in the intensity of IP protection affect knowledge spillover from universities. In regions with stronger IP protection, university researchers are more inclined to publicize their R&D outputs. By filing patents, they can enhance their academic reputation and gain economic returns through the commercialization of their research. These incentives help accelerate the rate of knowledge spillovers. Moreover, a stronger IP protection allows enterprises to access innovative knowledge from local universities at an earlier stage. Monopoly prospects create additional incentives for firms to pursue external knowledge and increase investment in internal R&D activities. From this perspective, the higher the level of IP protection, the better the effect of knowledge spillovers from universities.
Conversely, some scholars argue that while IPR protection encourages knowledge production, it may hinder knowledge spillovers (Inkpen et al., 2019). They contend that the original goal of the IPR protection system is to safeguard technological innovation, which is meant to have a positive effect. However, some organizations have seized this opportunity to overextend legitimate IP protection, creating insurmountable obstacles to corporate growth by through high licencing fees, restrictive legal clauses, and usage limitations (Su et al., 2022).
In summary, the impact of IP protection on corporate innovation performance and knowledge spillovers remains contested. This study argues that excessive IP protection can weaken the positive effects of knowledge spillovers; thus, we derive hypothesis H2 for the empirical investigation:
H2: The level of IP protection negatively moderates the impact of university knowledge spillovers on firms’ innovation performance.
Study Design
Sample Selection and Data Sources
Two types of data are frequently used to measure the IP: primary and secondary. Primary data are gathered through management interviews or surveys. However, several problems are associated with these data. First, such data are based on limited samples and face substantial constraints in terms of corporate accessibility, cost, sample representativeness, and data quality (Kitsios & Kamariotou, 2016). Second, for interviews, respondents’ willingness to answer sensitive questions affects data collection and processes; for Likert-based surveys, it is also influenced by respondents’ subjectivity (Ponta et al., 2021). To overcome these problems, secondary data are more suitable for studying innovation performance (Burrus et al., 2018).
Similar studies frequently employ 2-, 5-, and 10-year data sets. Despite difficulties in data collection, we selected relevant data from the past decade (2011–2020) to enhance the reliability and robustness of our research findings.
Among the studies on technology enterprises in China, we find that Guangdong Province has the highest number of technology enterprises (10,670) and employees (4.01 million; China Statistics Press, 2022a, 2022b). Therefore, we selected high-tech enterprises in Guangdong Province as our research sample due to their statistical representativeness. Furthermore, according to relevant research on knowledge spillover, the coverage area of knowledge spillover is limited. Therefore, the research scope of universities in this study includes universities in Guangdong Province.
Four databases were used for macroscopic data collection: the China Statistical Yearbook, China Statistical Yearbook on High Technology Industry, China Statistical Yearbook on Science and Technology, and Compendium of Science and Technology Statistics for Higher Education Institutions (China Statistics Press, 2022a, 2022b; Higher Education Press, 2022; National bureau of statistics of China, 2022).
Regarding micro data (enterprise data), we chose listed companies in the Chinese A-shares market, including the Shanghai and Shenzhen Stock Exchanges, as the research sample for 2011 to 2020. We screened Guangdong Province as a region, and the industry screened enterprises with high-tech enterprise qualification recognition. The recognition specifically applied to the listed company itself, with data collected from the year of listing up to 2020.
The micro data for this study were obtained from The China Stock Market & Accounting Research (CSMAR) database (CSMAR, 2022). After screening by industry and region, we excluded companies listed in ST and ST* (Special Treatment), companies with evidently abnormal financial information (e.g., total assets or liabilities equal to zero or null; total assets less than current assets; accumulated depreciation less than current depreciation), and observations with missing relevant data.
Additionally, to ensure the robustness of the results, we excluded firms that had no patents throughout the observation period, and to eliminate the interference of extreme values, a two-sided 1% tail winsorisation was applied to continuous variables to mitigate the influence of extreme values (Y. Li et al., 2023). Finally, we obtained unbalanced panel data for 475 Guangdong high-tech listed companies for 2011 to 2020, with 3,339 observations.
Variables Definition
Explained Variable
The dependent variable in this study is a firm-level innovation performance (InnP). Most studies use patent applications to measure an enterprise’s InnP (Burrus et al., 2018; Guderian et al., 2021; Hong et al., 2019; Messeni Petruzzelli & Murgia, 2020; Ponta et al., 2021). These studies argue that patent data more accurately measure the output of firms’ innovation activities, and that patent applications better reflect the utilization of knowledge resources than patent grants. Patents serve as a reliable indicator of a firm’s innovation outcomes. Compared to granted patents, patent applications more accurately capture the actual level of innovation output, as the approval process for patent grants involves lengthy procedures, including examination, verification, and annual fee payments, which introduce uncertainty and delays.
Therefore, this study uses the logarithm of the total number of patent applications—including utility model, design, and invention patents—as a proxy for innovation performance. Additionally, given the delayed impact of university knowledge spillovers on firm innovation, the proxy variable is lagged by 1 year in the empirical analysis.
Explanatory Variables
The explanatory variable in this study is universities knowledge spillover (ksIUR). According to prior research, the knowledge spillovers received by a region or firm are akin to the knowledge ‘borrowed’ from the knowledge bases of other regions or institutions (Song et al., 2019). Following the methodology of Chen and Yan (2021), the university knowledge spillover is measured using the following formula:
In this formula, t represents the time period (year t);
Moderator Variable
IP protection levels are used as the moderator variable. As a key aspect of the legal and policy environment, a binary measure such as ‘protection versus no protection’ fails to capture the nuances and strength of policy effects and offers limited explanatory power. Therefore, this study follows Xiao et al. (2018), measuring regional IP protection level by the ratio of technology market turnover to GDP.
Control Variables
From the perspective of total factor productivity (TFP), the factors influencing firm productivity can generally be categorized into three types (Bournakis & Mallick, 2018; Jeong & Townsend, 2007):
(1) Internal firm-specific factors, including characteristics such as assets and liabilities, firm age, ownership structure, and shareholding concentration.
(2) Industry-level factors, such as industry concentration and levels of foreign investment.
(3) Interactional factors between firms and industries, including market competition intensity, regulatory environment, and labour mobility.
Industry-level and interactional factors are collectively referred to as external factors.
Based on the above classifications, five control variables are selected: firm size, firm age, debt-to-asset ratio, ownership concentration, and capital intensity. Their measurement methods are described below:
(1) Firm size (Size). Common measures of firm size include the number of enterprises, total assets, and market sales. Due to data limitations, the number of enterprises is excluded. Additionally, to avoid multicollinearity with TFP—where market sales are often involved—we use the firm’s total assets. The natural logarithm of total assets is used in the panel data analysis.
(2) Firm age (Age). Firm age is calculated as the difference between the observation year (2021) and the firm’s establishment year.
(3) Debt-to-asset ratio (Lev). This ratio reflects a firm’s financial leverage and is calculated as the proportion of total liabilities to total assets.
(4) Ownership concentration (Hold). Ownership concentration is measured by the shareholding percentage of the firm’s largest shareholder, serving as a proxy for governance stability and control structure.
(5) Capital intensity (Capin). Capital intensity is measured by the ratio of total assets to operating revenue. A higher value indicates a greater capital requirement and potentially lower operational efficiency, implying higher financial risk.
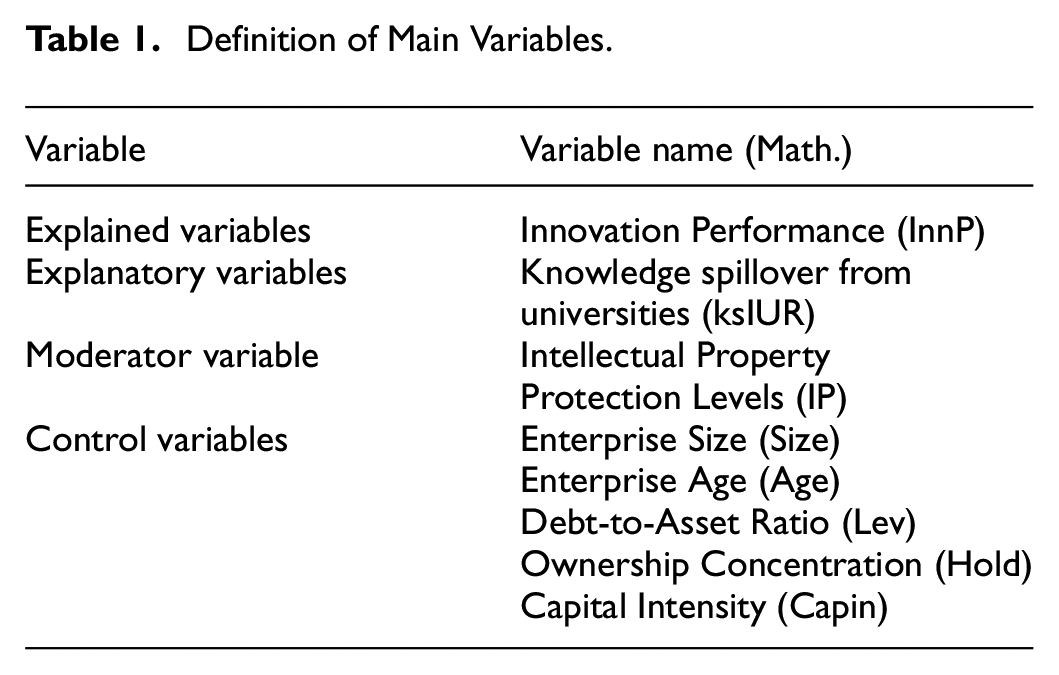
Table 1 presents the definitions and measurement methods of the variables in relation to hypotheses H1 and H2.
Definition of Main Variables.
Benchmark Model
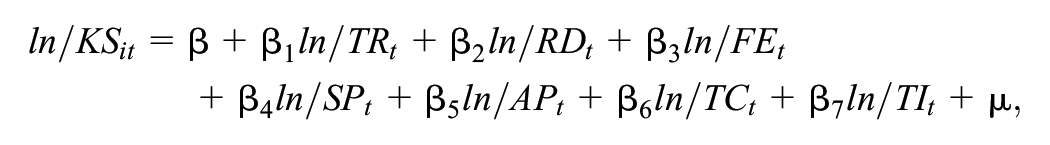
This study investigates the impact of university-based knowledge spillovers and intellectual property rights (IPR) protection on firm-level innovation performance. We selected TFP to measure the innovation performance and used the Cobb–Douglas production function as the measurement substrate, which was combined with the model construction for the subjects of this study.
Equations 1–7 were constructed to reflect the baseline estimation and its extensions. Equation 1 serves as the baseline Cobb–Douglas production function. Equation 2 incorporates knowledge spillovers and IPR protection into the total factor productivity term. Equations 3–7 progressively introduce firm heterogeneity and time effects to test the moderating role of IPR protection on the relationship between knowledge spillovers and innovation performance. The empirical strategy follows the methodological approaches of (Gu et al., 2018; Y. Li et al., 2023).

Equation 1 uses the Cobb–Douglas production function as the measurement base, where


The theoretical model in Equation 7 was derived from Equations 1–6, where
Empirical Analysis
Descriptive Statistics
After data collection and processing of all the variables, an unbalanced panel dataset was constructed. To mitigate the influence of outliers, all continuous variables underwent two-sided 1% Winsorisation. Table 2 presents the descriptive statistics of the main variables.
Descriptive Statistics.

As shown in Table 2, the average level of intellectual property (IP) protection across Guangdong Province is 0.0136. The mean value of knowledge spillovers from regional universities is 76.57, with a minimum of 72.73, a maximum of 79.58, and a standard deviation of 2.364, indicating a relatively wide fluctuation in university knowledge spillovers.
Regarding innovation performance, measured as the logarithm of the total number of patent applications (including invention, utility model, and design patents), the mean value for listed technology firms in Guangdong Province is 4.418. The minimum value is 0, the maximum is 8.381, and the standard deviation is 1.457.
Correlation Analysis
Multicollinearity occurs when explanatory variables are highly correlated, inflating coefficient standard errors. Before empirical testing, diagnostic checks for multicollinearity are essential to prevent model distortion caused by exact linear relationships among regressors.
In this study, the correlation of the model was first examined and analysed, and the results are presented in Table 3. The correlation coefficients between the explanatory and control variables are less than 0.5. To enhance the test, the variance inflation factor (VIF) of the relevant variables is further examined, and the maximum VIF value is 1.45.
Correlation Analysis.

According to Daoud (2017), the problem of multicollinearity in the model is considered only when the VIF is greater than 5. Both the correlation coefficients and VIF values indicate that the correlation between the explanatory and control variables is within an acceptable range. Multi-collinearity does not affect the model estimation results, and the correlation regression results are statistically reliable.
Multivariate Regression Results
Benchmark Regression Results
We conducted three types of regressions: ordinary least squares (OLS), random effects, and fixed effects (FE). Table 4 shows the results of the benchmark regressions. After testing the three regression models, we conducted the Hausman and LM tests. The Hausman test results reject the original hypothesis that the individual effect is unrelated to the regression variables. The LM test result rejects the original hypothesis, that is, the variance of the individual effect is 0. Therefore, we chose the FE method for the benchmark regression analysis.
Benchmark Regression Results.
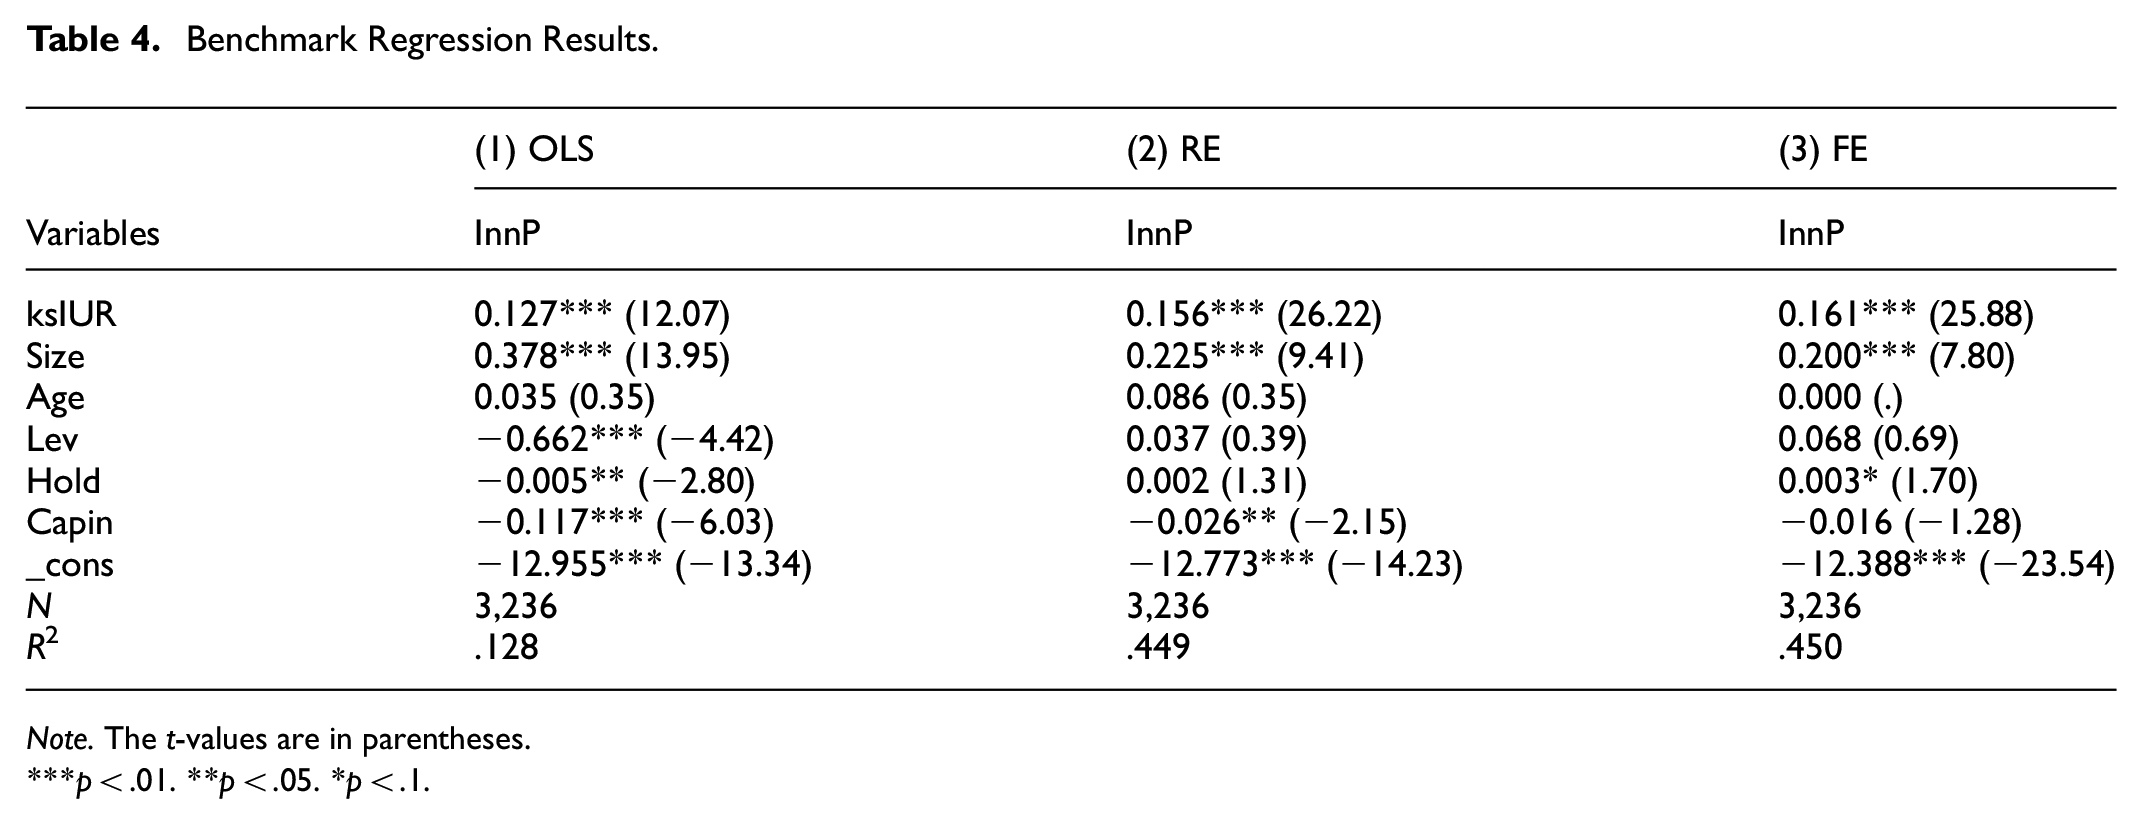
Note. The t-values are in parentheses.
p < .01. **p < .05. *p < .1.
The key question in this study is whether knowledge spillover from universities can benefit a firm’s innovation performance. The FE regression results (Table 4) demonstrate strong model fit (R2 = 0.450), with university knowledge spillovers (ksIUR) showing a statistically significant positive effect (1% level) on firm innovation performance (InnP). University knowledge spillovers show a statistically significant positive association (1% level) with firm innovation performance.
Moderation Effect Analysis
After the benchmark regression, we continued with a multiple regression analysis to examine the moderating effect. The multiple regression analysis controlled for year fixed effects. Observations missing any variables were excluded, resulting in a final sample of 3,236 observations, and the results of the multiple regressions were collated (Table 5). The R2 values of all the models were between 0.3 and 0.5, which was a better fit for the panel data model and indicated a better model interpretation. In the FE regression with year fixed effects, Stata automatically dropped the ‘firm-year age’ variable due to perfect collinearity, retaining only the other four controls. In addition, all models with VIF values below 5 were statistically reliable, as there was no problem of multiple covariances affecting the results.
Multivariate Regression Results.

Note. The t-values are in parentheses. Variable ‘Age’ omitted because of collinearity.
p < .01. **p < .05. *p < .1.
As presented in Table 5, Model 1 contains control variables only, whereas Model 2 incorporates the independent variable ksIUR as the benchmark specification. This section focuses on the analysis of the modulation effect model. The regression analysis with the addition of the moderating effect is presented in Table 6, and the corresponding diagram is shown in Figure 1.
Moderation Effect Analysis.

Note. Variable ‘Age’ omitted because of collinearity.

Conceptual model.
Model 3 incorporates IP protection level and analyses the results of its examination as a moderating effect. The FE regression results show that under the moderating effect of the IP protection level, ksIUR passes the test for a significant positive effect on InnP at the 5% significance level. The coefficient of the interaction term is negative, and the level of IP protection exerts a significant negative moderating effect at a coefficient level of −12.400 and a significance level of 1%.
Robustness Test
These results may have endogeneity or generalizability limitations. To ensure methodological robustness, we conducted robustness checks by replacing key indicator variables and regression models, following established approaches (Sun et al., 2020; Zhao et al., 2022). In the first step, the explanatory variable ksIUR is replaced with the TFP of technology firms calculated by the generalized method of moments (GMM) method. In the second step, the regression method is replaced with the Tobit model regression and feasible generalized least squares (FGLS) regression. To calculate variable substitution, we adopt the GMM calculation method of Lu and Lian (2012) and Ullah et al. (2018) to develop TFP_GMM as our robustness check variable, calculated as:

where Inc is the operating income of the technology firm, NFA is the net fixed assets, and Numb is the number of employees.
We obtained the TFP_GMM values using data from the CSMAR database, processed through Stata 16.0 panel data analysis, with descriptive statistics presented in Table 7.
Descriptive Statistics of TFP_GMM.

The Tobit model differs from discrete choice and standard continuous variable models as it analyses limited dependent variables through two equation types, focussing on continuous variable changes under specific choice behaviours. More sophisticated forms of such models are now available, and panel data, semi-parametric models, and other forms of Tobit models are widely used in research.
In addition, when using panel data for econometric analysis, the stochastic error term of the model often violates OLS assumptions. In contrast, the FGLS estimation method simultaneously addresses three error structures: cross-sectional correlation, heteroskedasticity, and serial correlation. By substituting the residual vectors from each cross-sectional unit into the covariance matrix, FGLS obtains consistent and efficient parameter estimates.
To verify robustness, we replaced the original regression approach with Tobit and FGLS models, substituting ksIUR with GMM-derived TFP_GMM to test the stability of variable relationships.
The FE regression results in Table 8 show that the effects of the key variables remain significant. The regression results of the Tobit and FGLS models in Table 8 remain consistent with the benchmark regression results. This consistency holds after replacing the key indicator variables and adjusting the covariance matrix of the residuals. These results confirm the robustness of our empirical findings across estimation methods, validating the benchmark regression results.
Robustness Test.

Note. The t-values are in parentheses.
p < .01. **p < .05. *p < .1.
Conclusions and Recommendations
Conclusions
This study uses Total Factor Productivity (TFP) to measure innovation performance, using the Cobb-Douglas production function to build a comprehensive model. The model empirically investigates data on listed technology enterprises, knowledge spillovers, and intellectual property rights of universities in Guangdong Province from 2011 to 2020. The aim is to fill the research gap and extend the literature on intellectual property, knowledge spillovers, and innovation performance. Specifically, this study examines the knowledge spillovers between universities and industries, and the impact of intellectual property protection on firms’ innovation performance.
The results reveal the following key findings. First, the final knowledge spillover measurement formula for universities provides a theoretical model for subsequent related research, answering RQ1. Second, the benchmark regression results show that knowledge spillovers from universities are positively correlated with firms’ innovation performance at the 1% significance level, confirming H1. In other words, knowledge spillovers from universities have a significant positive effect on firms’ innovation performance. The results suggest that university knowledge spillovers provide essential knowledge resources for technology enterprises, enhancing their ability to innovate and maximize social benefits. The higher the degree of knowledge spillovers, the more favourable it is for enterprises to conduct innovation activities, thus answering RQ2. Third, moderation analysis reveals that IP protection negatively moderates university spillovers’ positive impact on innovation: higher protection weakens this effect, supporting H2. Specifically, the moderation effect coefficient is −12.400, indicating that a 1-unit increase in IP protection reduces the marginal effect of university knowledge spillovers on innovation performance by 12.4 percentage points. This suggests that while IP protection safeguards proprietary rights, an excessively high level may hinder knowledge diffusion from universities to firms, thereby limiting collaborative innovation potential. The finding address RQ3 and highlight the nuanced balance required in IP policy to foster open innovation ecosystems.
Theoretical Implications
Existing research predominantly examines knowledge spillovers’ role in economic growth at the macro level (Audretsch & Belitski, 2020; Wang & Hu, 2020). While micro-level studies, particularly on university-to-firm spillovers and high-tech sectors remain scarce. Few address the intellectual property rights (IPR) nexus in university-industry knowledge transfer. These gaps underscore the need to examine the dynamics between universities and high-tech firms, especially from the perspective of intellectual property rights (IPR).
Prior research identifies persistent challenges including inefficient knowledge transfer, university-industry goal misalignment, absence of formal collaboration frameworks, and inadequate regulatory oversight. Building on this foundation, we develop a theoretical framework connecting knowledge spillovers, intellectual property rights (IPR) protection, and firm innovation performance. Addressing Bianchi and Giorcelli’s (2020) call for clearer conceptualization of how firms perceive and absorb academic knowledge, this study examines how enterprises interpret and integrate the effects of university-driven spillovers.
This study further synthesizes approaches to measure firm-directed knowledge spillovers. Following a comparative assessment, we select a benchmark model and develop both a spillover measurement formula and an innovation performance metric system, guided by research objectives and data constraints. Our findings address the research gap identified by García-Vega and Vicente-Chirivella (2020), examining universities’ societal contributions extending beyond student education.
Furthermore, we establish the micro-level theoretical foundations of knowledge spillovers through a comprehensive literature review. Our research design and analysis then advance the analytical framework connecting knowledge spillovers to corporate innovation.
Practical Implications
Based on theoretical and empirical findings, this study proposes countermeasures for universities (knowledge spillover sources), enterprises (receivers), and regulators (governments/supply chain actors).
For universities, enhancing innovative capacity and expanding knowledge boundaries is critical. Diversifying research outputs strengthens institutional competitiveness, attracts talent, and enriches knowledge reservoirs for enterprises. Ultimately, richer knowledge chains amplify spillover efficacy across macro-regional and micro-enterprise levels.
For regulators, we identify a fundamental tension. While IP protection safeguards proprietary rights, excessive protection significantly weakens university-to-firm knowledge spillover efficiency. Empirical results demonstrate that a 1-unit increase in regional IP protection reduces spillover benefits by 12.4 units. For instance, an initial 20-unit innovation gain would drop to 7.6 units under strengthened IP protection regimes. Consequently, profit-monopolizing strategies effective in traditional industries may stifle innovation in dynamic high-tech sectors. Governments should therefore adopt open IP frameworks that integrate cognitive legitimacy with socio-political legitimacy.
For enterprises, strategic openness mitigates IP leakage risks while accelerating innovation. Firms should leverage open innovation platforms to crowdsource global solutions for technological challenges. Concurrently, proactive IP management through licencing, transfers, or pledging to maximizes asset value. Notably, exchanging controlled IP disclosure for market access via local supplier networks can yield competitive advantages. In complex stakeholder ecosystems (encompassing customers, communities, and governments), firms must calibrate IP protection to foster collaboration without compromising core competitiveness.
Limitations and Future Research
This study extends the theoretical framework of knowledge spillovers and corporate innovation, offering valuable findings and policy implications. However, it has some limitations. The panel dataset is unbalanced due to varying listing years of firms and limited policy data availability. Although multiple regression results align with our theoretical logic and pass robustness tests, further improvements are possible. Specifically, using broader data samples, expanding observation scopes, and constructing balanced panels may yield new insights.
Footnotes
Author Note
Xinran Yang is a Lecturer at School of humanities, Ningbo University of Finance & Economics. Dr. Yang's research focus is enterprise innovation, service marketing and smart tourism. Email address:
Dashuai Huang is an associate professor at School of humanities, Ningbo University of Finance & Economics. Prof. Huang's research focus is enterprise innovation, SMEs studies, intangible cultural heritage.
Bingfei Liu is an undergraduate at School of humanities, Zhejiang University of Technology. Liu's research focus is SMEs studies, communication studies, digital media.
Ethical Considerations
This study involved human participants in survey research but did not include human experimentation. All procedures adhered to Section 8.05 of the APA Ethical Principles of Psychologists and Code of Conduct.
Consent to Participate
Informed consent was obtained through an implied consent protocol. Participants were fully informed of the study’s purpose, anonymity guarantees, and voluntary nature prior to participation.
Funding
The author(s) received no financial support for the research, authorship, and/or publication of this article.
Declaration of Conflicting Interests
The author(s) declared no potential conflicts of interest with respect to the research, authorship, and/or publication of this article.
Data Availability Statement
The author(s) disclosed receipt of the following financial support for the research, authorship, and/or publication of this article: All data supporting the findings of this study are provided in the article and its supplementary materials.