
Abstract
This study explores the Sustainable Development Goals (SDG), explicitly addressing poverty and malnutrition in the elderly through social security reform in Indonesia. Although previous research has linked hunger and poverty to child stunting, there is a significant gap and disparity in addressing malnutrition among the elderly. Analysing a sub-sample from the March 2020 National Socioeconomic Survey with 62,636 household-level observations, this research employs quantile regression to handle heteroskedasticity. These findings indicate that elderly individuals receiving pension benefits enjoy significantly greater protection against malnutrition. This observation closely aligns with the primary aim of the first SDG, which sought to eliminate hunger and malnutrition nationwide. This association emphasises the importance of strengthening income security as a practical and effective approach to combat malnutrition in the elderly population. These findings suggest targeted assistance for vulnerable elderly people such as single women aged ≥60 years.
Introduction
The increase in life expectancy and ageing population necessitates a greater focus on financial security for the elderly (Rouzet et al., 2019), such as ensuring adequate pension benefits (Bakroh & Hiilamo, 2024). A stable revenue stream not only provides income security, but also significantly influences dietary consumption and health among older adults (Cheng et al., 2018; Hwang & Lee, 2022). This is particularly relevant, as several studies have demonstrated a direct link between pension income and improved food expenditure, along with enhanced access to healthcare services (Hwang & Lee, 2022; Zhang et al., 2018).
Conversely, limited access to pension funds is often correlated with food insecurity, which adversely affects diet quality and overall health (Lee & Frongillo, 2001; Men & Tarasuk, 2020). Indeed, retirees receiving pension income are less likely to experience food insecurity than those who do not benefit from such schemes (Fong, 2023). Therefore, the interconnectedness of financial security and health among the elderly has become increasingly evident, highlighting the potential of efforts aimed at enhancing access to pension funds to significantly improve the welfare of the ageing population (Banerjee et al., 2023; Fong, 2023).
Furthermore, the disparity in expenditure between working and non-working pensioner households becomes apparent when both groups reach retirement age (OECD, 2008). Households with working pensioners tend to experience better financial stability and benefit from dual income sources. For example, elderly households in China typically rely on two primary income streams: pension and employment earnings (Hanewald et al., 2021). This financial advantage enables them, along with non-working pensioners (Banerjee et al., 2023), to allocate a larger budget to essential needs, including nutritious food (Bernal et al., 2024; Lo et al., 2012). As a result, they can improve their health and reduce the risk of malnutrition (Banerjee et al., 2023; Cheng et al., 2018). In contrast, pensioner households without access to pension benefits generally face greater economic pressure, often necessitating work to cover daily living expenses (Cheng et al., 2018) so that they can smooth their consumption.
Additionally, improved access to quality food is associated with better health outcomes, including a reduced risk of chronic diseases and enhanced overall quality of life (Bernal et al., 20245). Healthy dietary patterns have been shown to prolong life expectancy and improve mobility in older adults (Smith et al., 2020). Moreover, Evidence suggests that higher allocation of food budgets leads to increased caloric and protein intake, which is essential for the health maintenance of older adults, particularly those living independently (Lo et al., 2012). Furthermore, the financial security provided by pensions enables households to afford more nutritious food, thereby promoting both their physical and mental well-being (Armstrong-Carter et al., 2021).
Similarly, disparities in food budget allocation across income quantiles reveal distinct spending patterns among households (Atkinson, 2010; Lo et al., 2012). Higher-income households tend to allocate more of their budget to premium food items, such as fish and seafood, while lower-income households often economise, potentially compromising diet diversity and quality (Lo et al., 2012). Additionally, factors such as age and health status significantly influence purchasing power and food preferences, particularly in households with elderly members with limited income (Lo et al., 2012). Demographic variables, including family size and gender, also play a key role in food budget allocation to meet the dietary quality standards (Russell et al., 2014). Furthermore, factors such as marital status, body mass index, education, cognitive performance, and dietary adherence are critical in assessing the risk of malnutrition (Katsas et al., 2020).
Income protection is a critical factor that enables the elderly to afford nutritious food, which is essential for maintaining their health. Given this context, the pressing need to address malnutrition risks in the context of ongoing pension reforms (Damião et al., 2017) prompted this study to investigate the association between pension access and dietary quality in the elderly population. In particular, it examines how various determinants influence the nutritional intake of pensioners, with particular attention paid to disparities in food consumption among pensioner households in Indonesia. By elucidating these associations, this study aimed to inform more targeted interventions to enhance the health and well-being of this vulnerable group.
The remainder of this paper is structured as follows. First, the final part of the introduction discusses the key terms used in the paper, specifically pension policies in Indonesia and malnutrition among the elderly. The methodology section outlines the data collection methods, which include sources from the Indonesia Central Statistics Agency (BPS) and household surveys, emphasising the importance of data reliability and confidentiality. The results section delves into disparities in household expenditures and the quality of food consumption among pensioner households. The Discussion section interprets these findings and their implications for poverty alleviation policies, particularly regarding social protection strategies for the elderly. Finally, the Conclusion summarises the key insights and offers policy recommendations aimed at enhancing social protection for this vulnerable group.
Pension Reform in Indonesia
The Indonesian government has undertaken significant reforms in its pension system to enhance elderly welfare. These reforms include the introduction of programmes such as High-Risk Elderly Assistance (ASLURETI) and the National Health Insurance Programme (JKN). Notably, the transition in 2015 from defined contribution (DC) schemes to defined benefit (DB) pensions aimed to encourage the participation of older workers in the labour market while maintaining pension levels (Rouzet et al., 2019). Additionally, the government has increased the retirement age to further support this objective (Rouzet et al., 2019). Despite these efforts, the implementation of these policies has been suboptimal. Many retirees continue to work post-retirement, primarily because of inadequate pension benefits that fail to cover basic living expenses (Bakroh & Hiilamo, 2024; BPS, 2020).
Compared to neighbouring countries such as Malaysia, Singapore, the Philippines and Thailand, Indonesia faces significant challenges regarding elderly support (Mulyadi, 2020). In these countries, individuals aged ≥60 years receive government assistance for healthcare (Mulyadi, 2020). Conversely, in Indonesia, only those over the age of 70 qualify for ASLURETI support, leaving a considerable proportion of the elderly population without adequate assistance (Mulyadi, 2020). Currently, only 73.6% of Indonesia’s elderly population is insured through the JKN, while 26.4% remain uninsured (BPS, 2020). The alarming trends indicate a higher poverty rate among women aged 60 to 74, and only 4% of the population over 65 receives some form of assistance for the elderly (Larasati, 2021). This gap in healthcare access exacerbates several issues, including limited access to basic needs, increased financial dependency on family members and high medical costs, all of which collectively affect dietary choices and nutritional access (BPS, 2022; Sumadi, 2021).
The Indonesian government acknowledges the fiscal pressures arising from an ageing population, particularly when funding is based on the pay-as-you-go (PAYG) scheme (Yusuf et al., 2022). Consequently, pension funding should be directed towards a fully funded system (Yusuf et al., 2022). Moreover, the design of Indonesia’s pension system should incorporate a multipillar framework in which each programme is integrated with others, ensuring that at least one programme operates on a defined benefit scheme to provide a basic safety net (Yusuf et al., 2022). This policy proposal is best framed as a social pension programme, which functions as a non-contributory social assistance, offering regular pension benefits to elderly individuals who meet ‘specific criteria’ within a targeted group (Yusuf et al., 2022).
Despite significant progress in reducing the national poverty rate from 11.2% in 2015 to 9.2% in 2019, extreme poverty continues to be a critical issue, particularly among older adults (Setkab, 2022). By 2020, approximately 9.9 million individuals, accounting for 3.4% of the population, were classified as extremely poor (Setkab, 2020). In 2021, the poverty rate among the elderly population (aged over 65 years) reached 13.15%, which is notably higher than the national poverty rate of 10.14% (Yusuf et al., 2022). This demographic often faces additional vulnerabilities, such as social isolation (Quandt & Rao, 1999), disabilities, chronic illnesses and limited access to essential services (Fong, 2023). Consequently, these factors exacerbate the elderly’s reliance on family members for financial support (Sumadi, 2021).
In alignment with the SDGs related to poverty eradication and food security, Indonesia prioritises social protection programmes and community empowerment initiatives (Kemenpan, 2022). However, while a clear link exists between hunger and stunting in young children, research on malnutrition in the elderly is lacking (BPS, 2022).
According to the National Socioeconomic Survey (SUSENAS), individuals aged over 65 years account for 10.5% of the Indonesian population, with an old-age dependency ratio of 16.1. This ratio indicates that approximately six working-age individuals support each elderly person (BPS, 2022). Furthermore, a gender disparity exists within the elderly population, with a higher proportion of women (51.8%) than men (48.2%) (BPS, 2022). Additionally, urban areas exhibit a higher concentration of elderly individuals (56.1%) than rural areas (44.0%) (BPS, 2022). Living arrangements further revealed that 7.3% of elderly individuals reside alone, 20.9% live with a spouse, and the remaining 72.0% cohabit with relatives, with family members often bearing the financial burden of medical costs (BPS, 2022). This issue is especially pronounced among widows, who represent a significant segment of the elderly population (BPS, 2022).
The vulnerability of the elderly population is heightened by both financial dependency and health limitations. A substantial 48.1% of older adults report health issues, with 24.4% suffering from serious health conditions, such as heart disease, diabetes and rheumatism (BPS, 2020). Chronic health problems can severely impede daily activities and contribute to the financial strain associated with healthcare costs, which are primarily borne out of pocket (Banerjee et al., 2023; Zhang et al., 2018). This situation starkly contrasts with the more supportive healthcare financing available to elderly citizens in neighbouring countries (Mulyadi, 2020).
Malnutrition Challenges
Malnutrition is defined by the World Health Organization (WHO) as an imbalance in nutrient intake, which includes both deficiencies and excesses of essential nutrients (WHO, 2024). This condition profoundly affects many older populations owing to the dual burden of undernutrition and diet-related non-communicable diseases (WHO, 2024). In older adults, malnutrition presents in various forms such as wasting, stunting, underweight, and micronutrient deficiencies, all of which pose significant health risks (Dent et al., 2023). It is important to note that undernutrition can arise not only from illness but also from hunger and socioeconomic limitations (Katsas et al., 2020; Purdam et al., 2019).
Despite governmental initiatives, public health campaigns often prioritise obesity while overlooking the essential interventions necessary to address undernutrition in older adults (Quandt & Rao, 1999). Timely nutritional support, including risk screening, is crucial for the development of dietary care plans that can significantly improve health outcomes in the elderly (Dent et al., 2023; Katsas et al., 2020). For example, research involving samples from 24 European countries indicates that approximately 28% of individuals aged 65 years and older are either malnourished or at risk, a statistic that is projected to rise as the population ages (Leij-Halfwerk et al., 2019). In Indonesia, approximately 10% of elderly individuals consume protein below national standards (BPS, 2022). At the time of this study, however, detailed statistics from the government on the number of elderly individuals affected by malnutrition, specifically in terms of caloric, protein and fat intake, were unavailable.
Several factors contribute to the risk of malnutrition among older adults, including marital status (Zainuddin, 2020), body mass index (Liu et al., 2021), gender (Zainuddin, 2020), education (Katsas et al., 2020), cognitive performance (Katsas et al., 2020) and dietary practices (Zainuddin, 2020). Illness can exacerbate nutritional deficiencies, leading to chronic diseases and cognitive decline, which complicate recovery and increase mortality rates (Liu et al., 2021). Furthermore, economic limitations among older individuals heighten the risk of malnutrition, as those with lower incomes may depend on low-nutrient foods due to financial constraints (Damião et al., 2017).
Living arrangements significantly influence nutritional status, particularly among older adults and women without partners, who are more susceptible to malnutrition (Katsas et al., 2020; Zainuddin, 2020). Elderly individuals living alone may experience higher rates of malnutrition owing to their limited motivation for meal preparation (Zainuddin, 2020). However, research suggests that life satisfaction is more closely related to income than to living arrangements, highlighting the importance of financial resources over cohabitation in promoting well-being (Banerjee et al., 2023).
Social assistance programmes in Indonesia still fall short of reaching a significant portion of the elderly population in need, with higher coverage observed in rural areas than in urban ones. For instance, the Non-Cash Food Assistance Programme (BPNT) in 2020 covered only 19% of the elderly population, with higher participation rates in rural areas (24.1%) than in urban settings (14.5%) (BPS, 2020). Similarly, the Family Hope Programme (PKH) supports merely 11.1% of retired households, again showing greater participation in rural areas (14.5%) than in urban areas (8.2%) (BPS, 2020).
Access to healthcare for the elderly remains a pressing concern, as only 73.6% are enrolled in the National Health Insurance Programme (JKN), leaving a significant proportion without coverage (BPS, 2020). Moreover, only 44.6% of elderly individuals are enrolled in the Non-Mandatory National Health Insurance, underscoring the urgent need for a more comprehensive healthcare system (BPS, 2020).
However, current pension benefits frequently fall short of meeting retirees’ daily needs, highlighting the necessity for enhancements to improve coverage (Bakroh & Hiilamo, 2024). In 2020, only 10.8% of retired households received Pension Benefits (J.P.), with urban uptake (15.6%) being considerably higher than that in rural areas (5.3%) (BPS, 2020).
Methodology
The dataset used in this study was the 2020 SUSENAS dataset from Indonesia. Conducted biannually by the BPS in March and September, the SUSENAS collects a wide range of data, including information on education, health, nutrition, housing, socioeconomic conditions, consumption patterns, spending habits, household income, travel and overall well-being. For this study, data were gathered from March 1st to 20 March 2020. Notably, the data collection period for this study took place immediately ‘before’ the onset of the COVID-19 pandemic in Indonesia, which began in mid-2020. This timing allows the dataset to serve as a baseline for understanding the potential shifts in household behaviour influenced by the pandemic.
Before conducting interviews and administering questionnaires, the BPS sought and documented respondents’ consent to participate, assuring them of data confidentiality and restricted use solely for legal purposes. This written consent ensured that the participants understood their rights and the scope of data usage.
This study formally obtained permission from the BPS to access and use the dataset for this study, beginning our access on 5 November 2021. Although the SUSENAS data originally contained personal identifiers, BPS provided an anonymised version to us, which rendered additional informed consent unnecessary. While SUSENAS provides detailed insights into household income and expenditure, individual household income data remain confidential.
In the initial phase, descriptive statistics were employed using a complete sample that included both retired and non-retired households. During the inferential analysis, however, the dataset was narrowed to focus exclusively on households with an HoH aged 60 or older. For a clearer understanding of the variables used in the econometric model, Table 1 presents the definitions for each variable.
Parameter Descriptions.
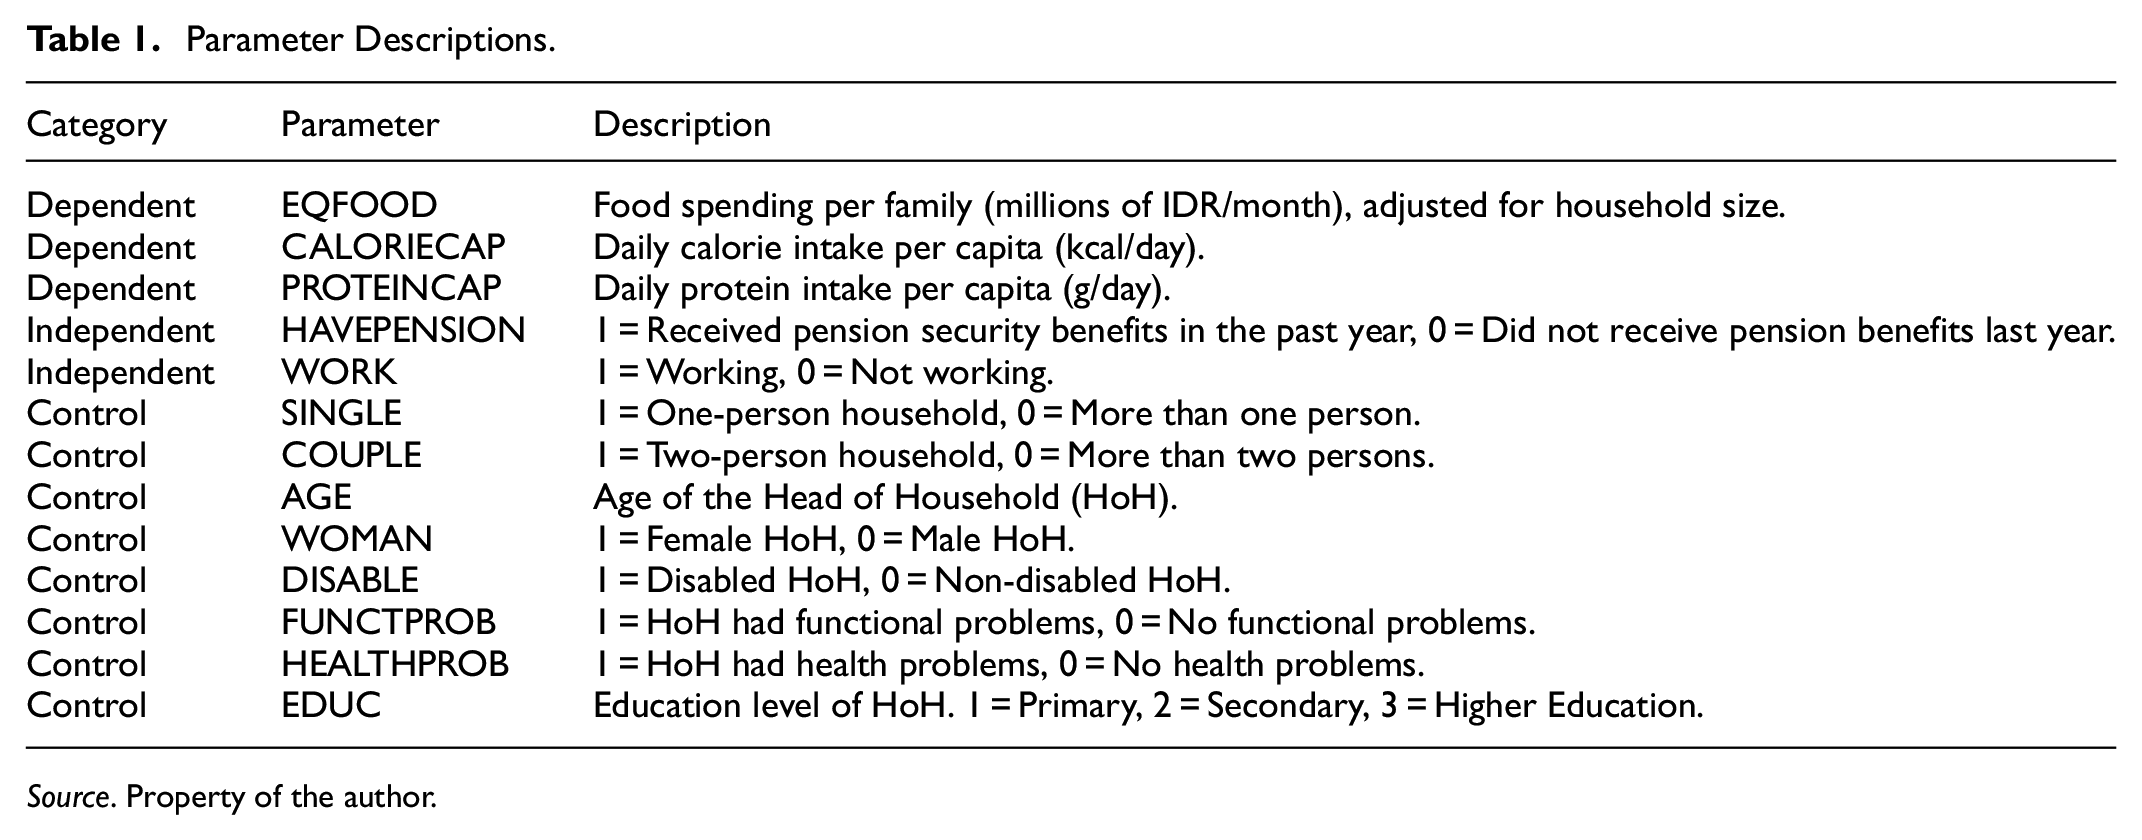
Source. Property of the author.
The initial dataset encompassed 334,229 household-level observations, as outlined in Table 2. However, to ensure the robustness of the dataset, addressing the missing data on education (17,687 observations) and employment status (6,949 observations) became imperative. Missing observations arose because the dataset did not have values for certain entries. This was not caused by any specific restrictions; rather, it resulted from the absence of data recorded by enumerators.
Descriptive Statistics for the Full Sample.
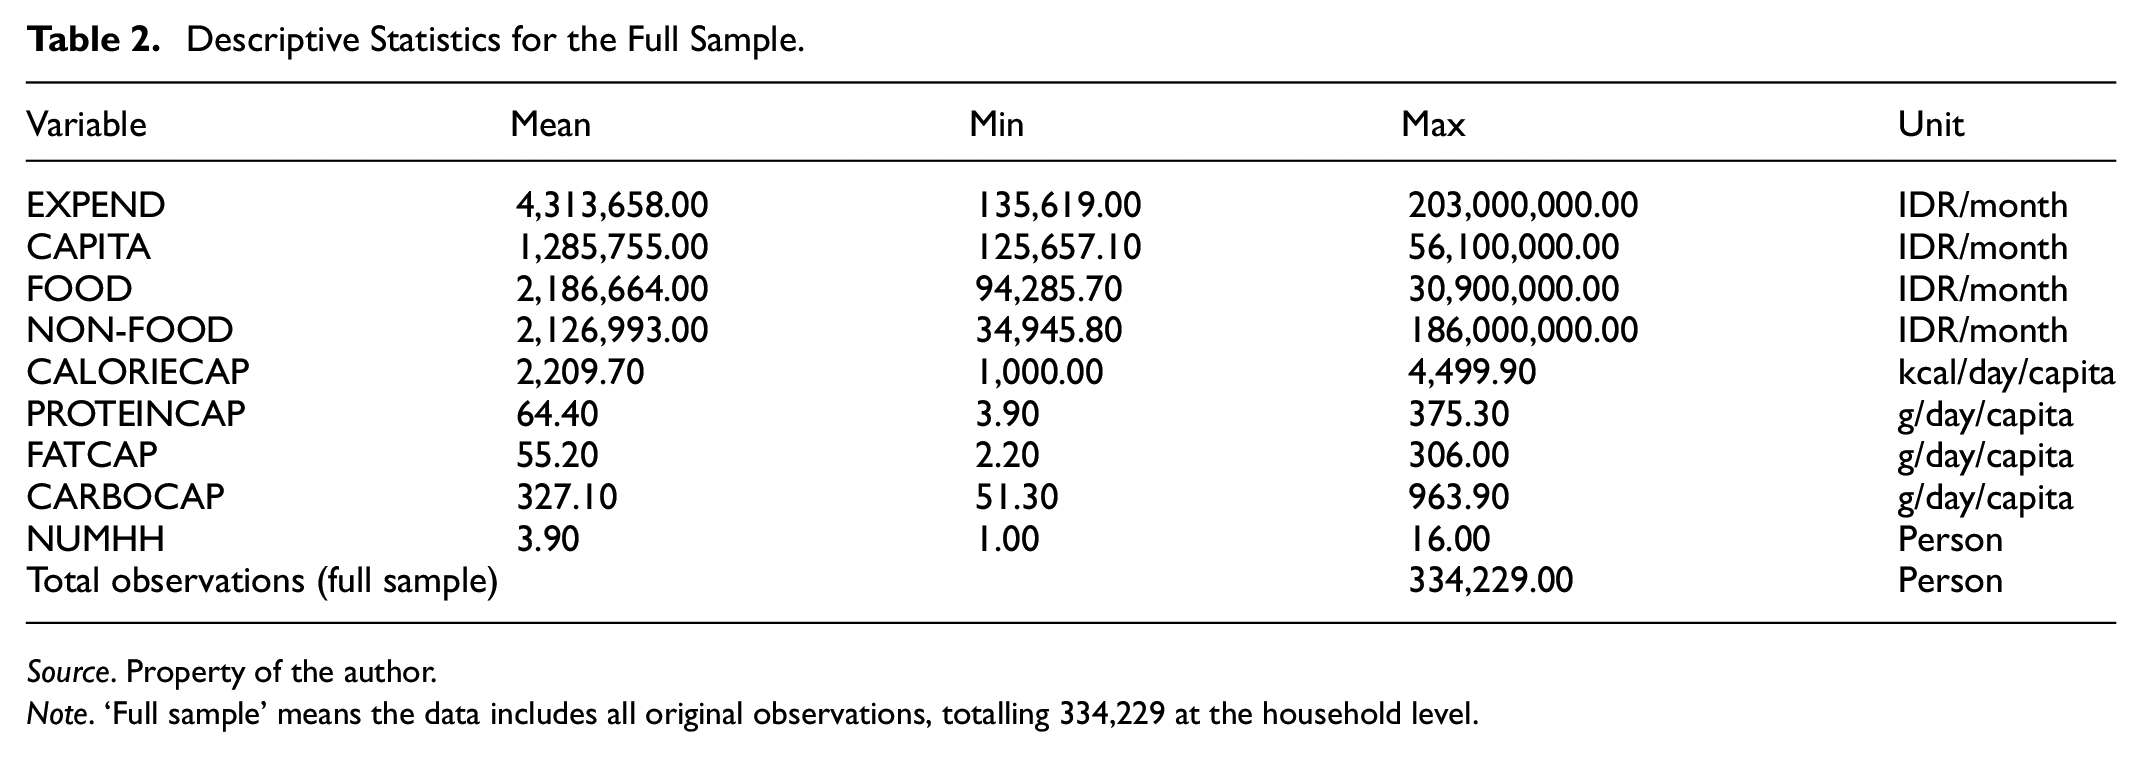
Source. Property of the author.
Note. ‘Full sample’ means the data includes all original observations, totalling 334,229 at the household level.
After removing observations in which the household heads were under the age of 60 and excluding several entries with missing values, regression models were applied to 62,636 observations (Table 3). The inclusivity of these models resulted from the deliberate exclusion and adjustment of data concerning households with HoH over 60, from an initial sample size of 309,593. For a more detailed breakdown of the statistics involved in this process, see Table 3.
Descriptive Statistics for the Adjusted Sample (With More Detailed Categorisation).

Source. Property of the author.
Note. The ‘adjusted sample’ includes the full dataset with missing data removed, specifically, 17,687 entries lacking education information and 6,949 missing employment status. Meanwhile, the ‘post-retirement sample’ narrows the adjusted sample to household heads over 60, and will be used to test the first and second hypothesis.
This research investigated two distinct facets of household food spending in Indonesia, specifically the monetary outlay and the quality of purchases made. The determination of household expenditure quality depends on the expenditure level necessary to meet an individual’s calorie and protein requirements. By concurrently examining both categories, this study aimed to understand how retired households in various expenditure quantiles allocated their resources based on their distinctive characteristics.
This research focuses on the household level rather than the individual level because SUSENAS provides information on family expenditure, not on spending per person. While it is possible to estimate spending per person by dividing the total family expenditure by the number of members, the OECD does not recommend this method. This is because spending patterns may differ significantly between families with one member and those with multiple members (OECD, 2008).
To investigate variations in household food spending, this study applied the equivalence method advocated by the OECD (OECD, 2008). Specifically, it computes equivalent food expenditure (EQFOOD) by dividing each family’s food expenses by the square root of its household size. This pattern may also indicate the financial strain that larger families experience due to the higher costs associated with raising children (OECD, 2008). However, this research suggests that the increase in food spending did not occur proportionally; instead, it progressed at a slower rate than the growth in the number of household members (Figure 1).

Scatter plot with predicted line fit of food expenditure against household size.
Transitioning to nutritional benchmarks, the Nutrition Adequacy Rate (AKG), established by the Indonesian Ministry of Health (MoH), serves as a benchmark outlining the average daily nutrient requirements tailored to individuals with specific characteristics. Regulation of the Minister of Health Number 28 of 2019 specified these guidelines, stipulating nutritional benchmarks such as a protein adequacy rate of 57 g per person per day and an average energy adequacy rate of 2,100 kcal per day (Kemenkes, 2019).
The SUSENAS dataset provides information on the primary sources of household income, including remittances, savings, investments and post-retirement income (such as pension benefits). Additionally, two distinct variables, SINGLE and COUPLE, were introduced to assess the impact of living alone without family support, thereby enhancing the accuracy of the individual-level analysis. The coefficients of these variables were subsequently compared to identify and distinguish their respective effects.
With cross-sectional observations as the basis for this study, the estimated parameters generated by Ordinary Least Squares (OLS) were expected to exhibit heteroscedasticity, as indicated by the Breusch–Pagan/Cook–Weisberg test (Table 4). Therefore, Quantile Regression Analysis (QRA) was employed to rectify this issue. Furthermore, the standardised t-test was used to assess the significance of the estimated parameters across three quantile regressions (Q25, Q50 and Q75).
Results of the Breusch-Pagan/Cook-Weisberg Test for Heteroskedasticity for All OLS Equations.

Source. Property of the author.
Note. Showing that all these equations exhibit signs of heteroskedasticity, it is necessary to apply a robust variance-covariance adjustment in Stata, specifically using ‘vce(robust)’, along with quantile regression instead of OLS.
In addition, the results of multiple regression with many independent variables using the quantile regression approach remain valid even in the presence of heteroscedasticity in the model. Quantile regression is robust to heteroscedasticity and does not rely on the homoscedasticity assumption required for OLS (Buchinsky, 1998; Horowitz & Lee, 2007; Koenker, 2005; Koenker & Bassett, 1978).
Poverty in old age is a significant issue in Indonesia, highlighting the importance of financial preparedness for retirement. The study argued that households with ‘extra income’ during retirement may experience a higher level of well-being than those without such resources.
Furthermore, the study explored the evolution of household expenditures as breadwinners aged, positing that retired households’ expenditure patterns would differ from those of other families due to efforts to equalise the marginal utility of their expenses based on preferences, needs, and income. Consequently, the study predicted varying expenditure coefficients for each household attribute, such as pension protection, employment status, number of household members, gender, age, and health conditions.
In addition, the study considered the potential differentiation in the impact of pension access on food consumption, calorie intake, and protein intake across various distribution quantiles. It anticipated a positive association between pension access and the upper quantiles of the household income distribution, while acknowledging potential differences for lower quantile households. This rationale was extended to other independent variables, including employment status and health conditions.
In light of these considerations, this study formulated the following two hypotheses:
The first alternative hypothesis is as follows:
Pensioned households not engaged in employment are anticipated to allocate a larger portion of their budget to food than retired households without pensions but still employed. This implies a positive association between pension membership and enhanced dietary quality (Equation 1 and 2).
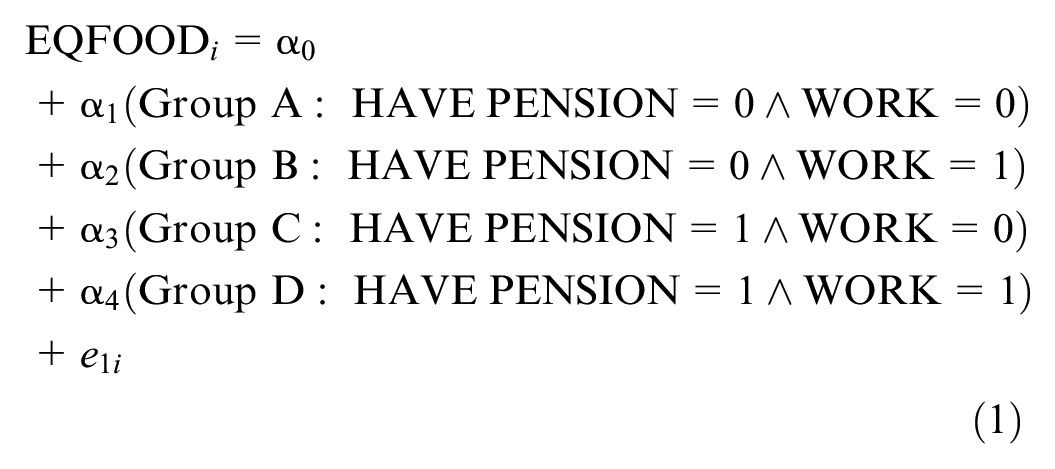

The groups are categorised as follows: Group A includes individuals without a pension and not employed; Group B comprises those without a pension but employed; Group C consists of those with a pension and not employed; and Group D includes individuals who receive a pension and are employed.
The central objective of Equations 1 and 2 were to facilitate a comparative analysis of the parameter coefficient values between Groups C and B. Should the coefficients of Group C surpass those of Group B, it could be posited that pensioners, despite being unemployed, exhibited a higher expenditure on food than labourers. This divergence may be attributed to the absence of pension-related safety mechanisms in the latter group.
However, this study provided data for all four groups, enabling readers to compare not only Groups B and C but also the other two groups. For instance, Group C was compared with Group D to examine differences in food expenditure quality between elderly people with employment protection (such as pension security) and those working without it.
Although the SUSENAS data provided information on each household’s primary income source, they lacked specific details on the proportion of this income relative to total household income. Therefore, the study adopted a cautious approach by using an econometric model, as outlined in Equation 1, to minimise the risk of a Type II error, where an effect might be incorrectly deemed absent, even though it is present. For instance, in comparing Groups A and C, the study risked failing to detect a significant effect despite the possibility that pension protection might have had an actual influence. Thus, comparisons between the two groups in any combination were necessary.
In STATA, this study utilised the interaction between the variables HAVEPENSION and WORK (reg y c.x1##c.x2). However, when modelling the equation, this study opted to use separate regressions (as outlined in Equation 1) because this approach yields comparable results owing to the binary nature of HAVEPENSION and WORK. This method was chosen for its clarity and for offering a more straightforward interpretation of how the interaction between these variables affects the outcome of interest.


⋮

⋮

⋮

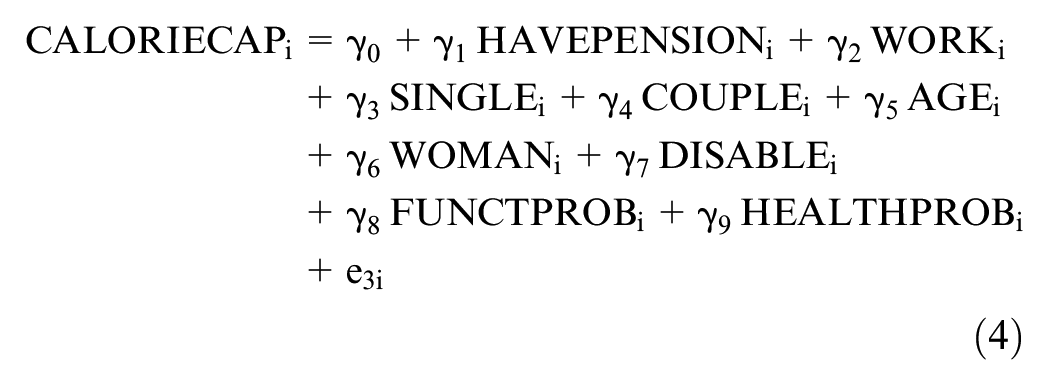
The rationale for the second hypothesis is as follows: The first hypothesis examines food expenditure solely in terms of quantity (nominal), focusing on its relationship with two associated variables: employment status and pension benefit ownership. To provide a more comprehensive analysis, particularly regarding the ‘quality’ of food expenditure, measured by calorie and protein intake, this study introduces the second hypothesis and incorporates several additional variables to strengthen the robustness of the regression results.
Second alternative hypothesis:
There was a significant divergence in the impact of the predictor variables on dietary quality, encompassing food expenditure, caloric intake, and protein intake across various quantiles of the distribution of the dependent variable (Equations 3, 4, 5 and 6).
In other words, the effects of predictor variables, such as pension benefits and employee salary, while considering control variables, including living arrangements (single or coupled), age, gender, disability, functional issues, health problems, and educational attainment, on the dependent variable are not consistent throughout the entire range of the dependent variables within the research sample.
As a summary, this study employed a two-tiered analytical approach to assess the economic and nutritional dimensions of food expenditure among retired households. Equation 1 quantitatively assesses the food expenditure of retired households receiving a pension benefit, distinguishing between those with and without employment. Additionally, Equations 3–5 explore a broader dimension by examining the nutritional value of the food consumed by elderly households, controlling for other relevant covariates.
Furthermore, it is noteworthy that all currency conversions in this study were based on the 2020 average exchange rate of 14,533 IDR per USD.
Results
This section presents the findings regarding the economic and nutritional status of Indonesian households, emphasising expenditure patterns, dietary intake and the impacts of pension coverage.
Table 2 highlights that food expenses account for an average of 50.7% of total monthly expenditure among Indonesian households, translating to IDR 2,186,664 out of an overall budget of IDR 4,313,658. The average daily calorie intake per person is 2,209.7 kcal, with macronutrient consumption comprising 64.4 g of protein, 55.2 g of fat and 327.1 g of carbohydrates.
As illustrated in Table 3, pension coverage remains limited, with only 8.6% of households receiving pension, while 86.6% of household heads continue to participate in the workforce. Health indicators for these HoHs are generally favourable, as only 0.1% report health issues. The age distribution reveals that 71.5% of HoHs are under 60 years of age, 23.9% are between 60 and 69, 4.3% are between 70 and 79 and 0.3% are over 80.
To align with Indonesia’s dietary recommendations, individuals should consume 2,100 kcal and 57 g of protein daily. However, many elderly individuals, particularly those in the lower consumption percentiles, fail to meet these nutritional standards, which are vital for maintaining health in later years. Although 92.5% of households allocate up to IDR 1 million (approximately USD 68.8) per month for food, a considerable proportion do not adhere to the dietary guidelines. Specifically, 76.8% consumed less than 2,100 kcal daily, and 86.1% did not meet the recommended protein intake. Additional details are outlined in Table 3.
Table 5 reveals significant disparities in food consumption among elderly Indonesians across different consumption quantiles. In households led by individuals over 60, food expenditure, calorie intake and protein consumption increase as one moves to higher consumption quantiles. For example, in the lowest percentile (Q1), elderly households spend an average of IDR 0.27 million on monthly food expenditure, leading to a daily intake of 1,111 kcal and 28.59 g of protein. Conversely, at the highest percentile (Q99), the expenditure reaches IDR 3 million, resulting in a daily intake of 4,294 kcal and 151.97 g of protein.
Percentiles for the Response Variable.

Source. Property of the author.
Note. In September 2020, the food poverty line was established at an IDR of 0.339 million (±USD 21.9) per capita per month. On average, a poor household in Indonesia comprises 4.83 members, leading to a food poverty line of IDR 1.637 million (±USD 112.7) per household. Furthermore, the minimum recommended daily calorie intake is 2,100 kcal per person, while the minimum recommended daily protein intake is 57 g per person.
Relative to Indonesia’s food poverty line, established at IDR 0.339 million per person per month as of September 2020, many elderly people, particularly those in the lower percentiles, significantly fall short in terms of food expenditure, caloric intake and protein consumption. Figure 2 indicates that a majority of households are below the Household Food Poverty Level, with a sharp increase in food expenditure only observed in the highest quantile (approximately 0.9–1). This trend underscores the notable inequality in food spending. Furthermore, many elderly individuals reside below this minimum line, especially in lower quantiles (approximately 0–0.75), indicating that a substantial portion of the population does not satisfy the minimum caloric requirements for a healthy lifestyle. The distribution pattern is similar for calorie intake, with most of the population falling below the minimum protein intake level, especially in the lower quantiles.
Quantile plot of food expenditure, calorie and protein intake.
Table 6 presents the stratification of equivalent food expenditure (EQFOOD) by socioeconomic status (SES) in relation to malnutrition, comparing the adjusted sample (across all age groups) with the post-retirement sample (aged 60 and above). The data reveal that, for the adjusted sample, a higher percentage of individuals in the low and middle SES categories experienced malnutrition, whereas in the high SES category, the majority did not. In the post-retirement group, the trend was similar, with a higher proportion of malnutrition observed in the low SES group and a significant reduction in malnutrition in the high SES group.
Socioeconomic Status Stratification of Equivalent Food Expenditure in Relation to Malnutrition.

Source. Property of the author.
Note. Stratification into low, middle, and high categories is based on the EQFOOD distribution, using the mean plus or minus the standard deviation. Malnutrition is a binary variable, where malnutrition = 1 if any of the following conditions are met: EQFOOD < 1.637 Mill IDR/month, CALORIE_CAP < 2,100 kcal/day or PROTEIN_CAP < 57 g/day.
The study’s first hypothesis posits that retired households receiving pension benefits, without additional employment, allocate a greater proportion of their budget to food expenses than retired households that remain employed without pension benefits. The second hypothesis investigates the differential effects of predictor variables, including food expenditure, calorie intake and protein intake, on diet quality across various quantiles of the distribution of the dependent variable. These hypotheses imply that the influence of these factors varies according to the position of each household in the consumption distribution.
To evaluate these hypotheses, OLS regression was employed across the five equations. Due to the potential for heteroskedasticity within the cross-sectional national data, a Breusch-Pagan/Cook-Weisberg test confirmed the presence of heteroskedasticity across all OLS equations. Consequently, a robust variance-covariance adjustment was applied in Stata using the ‘vce(robust)’ command, and quantile regression was used as an alternative to better address variability.
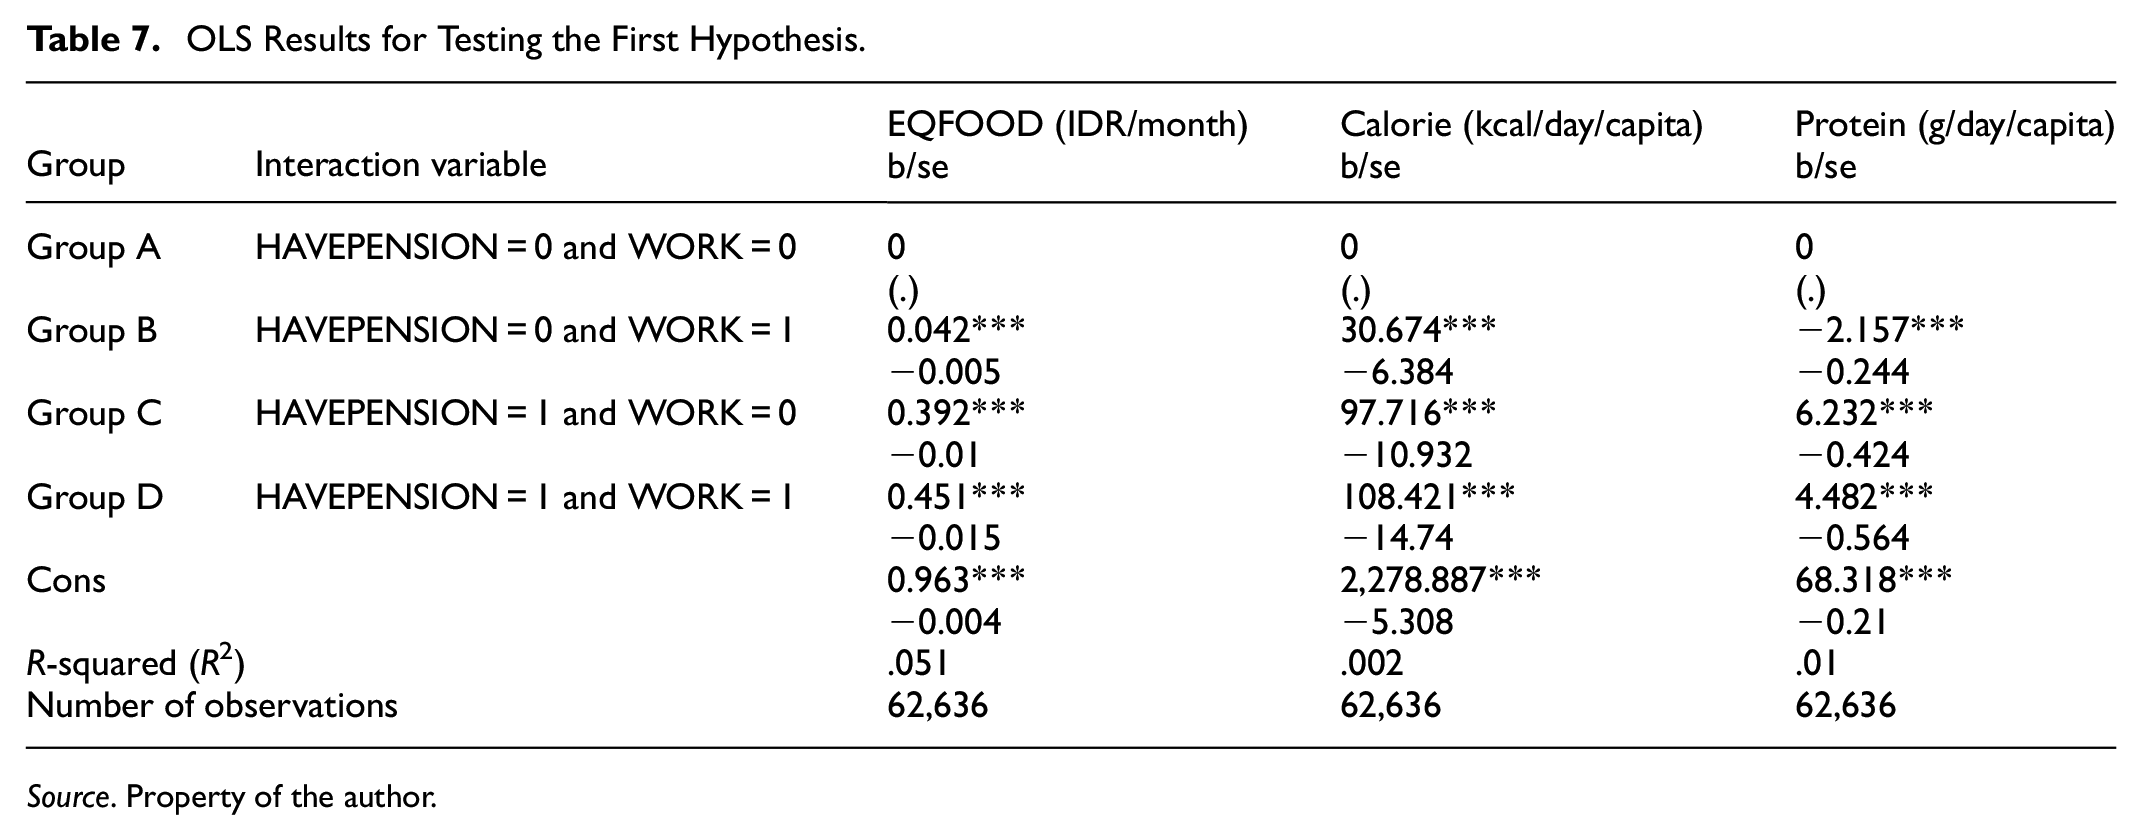
Table 7 presents the results of the OLS regression adjusted for robust standard errors. This analysis explores the relationship between food budget allocation and dietary quality among pensioner households, including the interaction between pension ownership (HAVEPENSION) and employment status (WORK). Group A (HAVEPENSION = 0, WORK = 0) served as a baseline for food allocation, calorie intake and protein intake.
OLS Results for Testing the First Hypothesis.
Source. Property of the author.
For Group B (HAVEPENSION = 0, WORK = 1), which comprises employed households without pensions, the food budget allocation coefficient is positive (0.042) and significant at the 1% level. This group demonstrated an increase in daily calorie intake (30.674 kcal per capita) but a reduction in protein intake (2.157 g per capita) compared to the reference group.
Households in Group C (HAVEPENSION = 1, WORK = 0), which receive pension benefits but are not employed, exhibit a substantially higher food expenditure allocation, with a coefficient of 0.392. This group’s calorie and protein intake also exceeded that of the reference group by 97.716 kcal and 6.232 g per capita, respectively.
Group D (HAVEPENSION = 1, WORK = 1), which includes households with pensions that remain employed, reports the highest allocation for food expenditure (0.451) and the greatest dietary intake, with 108.421 additional kilocalories and 4.482 g of protein daily compared to the reference group.
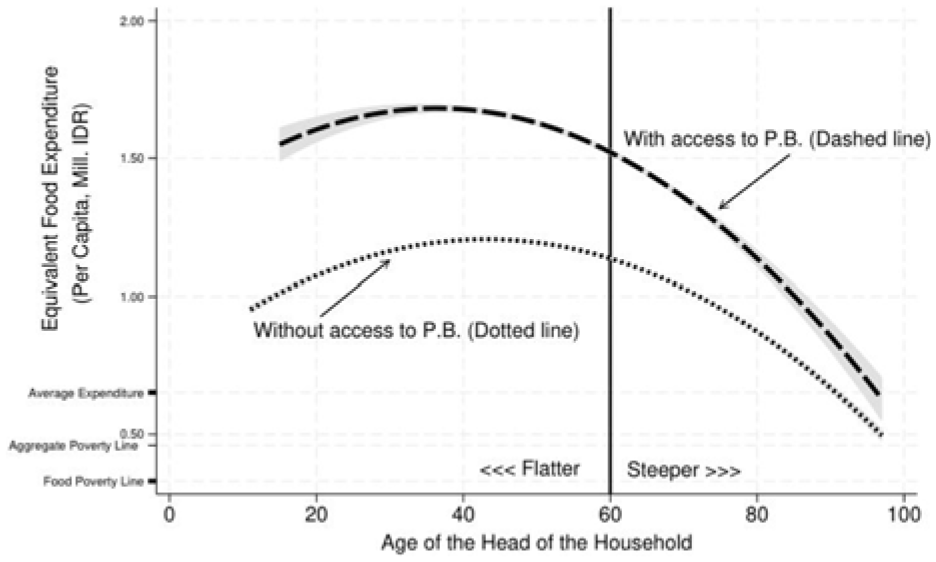
The hypothesis was successfully validated, providing statistical evidence that households with pension benefits consume a greater quantity and quality of food than those without pension benefits who continue working. In comparison to Group B, Group C’s monthly food expenditure was IDR 350,000 (approximately USD 22.7) higher, along with an additional daily intake of 67 calories and 8.4 g of protein. This trend is visually represented in Figure 3, where the chart lines illustrate food expenditure patterns across different ages, forming a quadratic curve that rises until around age 60 before declining. Figure 3 further highlights that households with access to pensions (depicted by dashed lines) exhibit higher food expenditure than those without (represented by dotted lines). Both analyses suggest that pensions provide additional economic support for households, enabling them to allocate more resources towards dietary needs.

Quadratic fit line: Equivalent food expenditure by age of head of household with and without pension security across all age groups.
Regarding the second hypothesis, Table 8 presents insights from both OLS and quantile regression analyses. Pension status shows a positive and significant correlation with food expenditure across all quantiles (Q25, Q50 and Q75), with coefficients of .177, .197 and .212, respectively (p < .001). Moreover, pension status significantly enhanced both calorie and protein intake across all quantiles, ranging from 100.805 to 118.464 kcal and 4.356 to 5.795 g of protein, respectively (p < .001).
OLS and Quantile Regression Results for the Second Hypothesis.

Source: Property of the author.
However, employment status displays a negative correlation with food expenditure at Q25 and Q75 (−.023 and −.034). Nevertheless, it positively influences calorie and protein intake, particularly at Q75, where calorie intake reaches 137.333 kcal and protein intake shows a significant increase.
Age and educational attainment also significantly affected dietary outcomes. As HoHs age, there is a decline in food expenditure and calorie and protein intake. Conversely, higher educational attainment was positively correlated with dietary quality, as HoHs with greater education levels tended to have increased food expenditure, calorie intake, and protein consumption across the lower and middle quantiles (Q25 and Q50).
Figures 4 to 6 visually depict the quantile regression results for the three dependent variables, clearly highlighting these explanations.
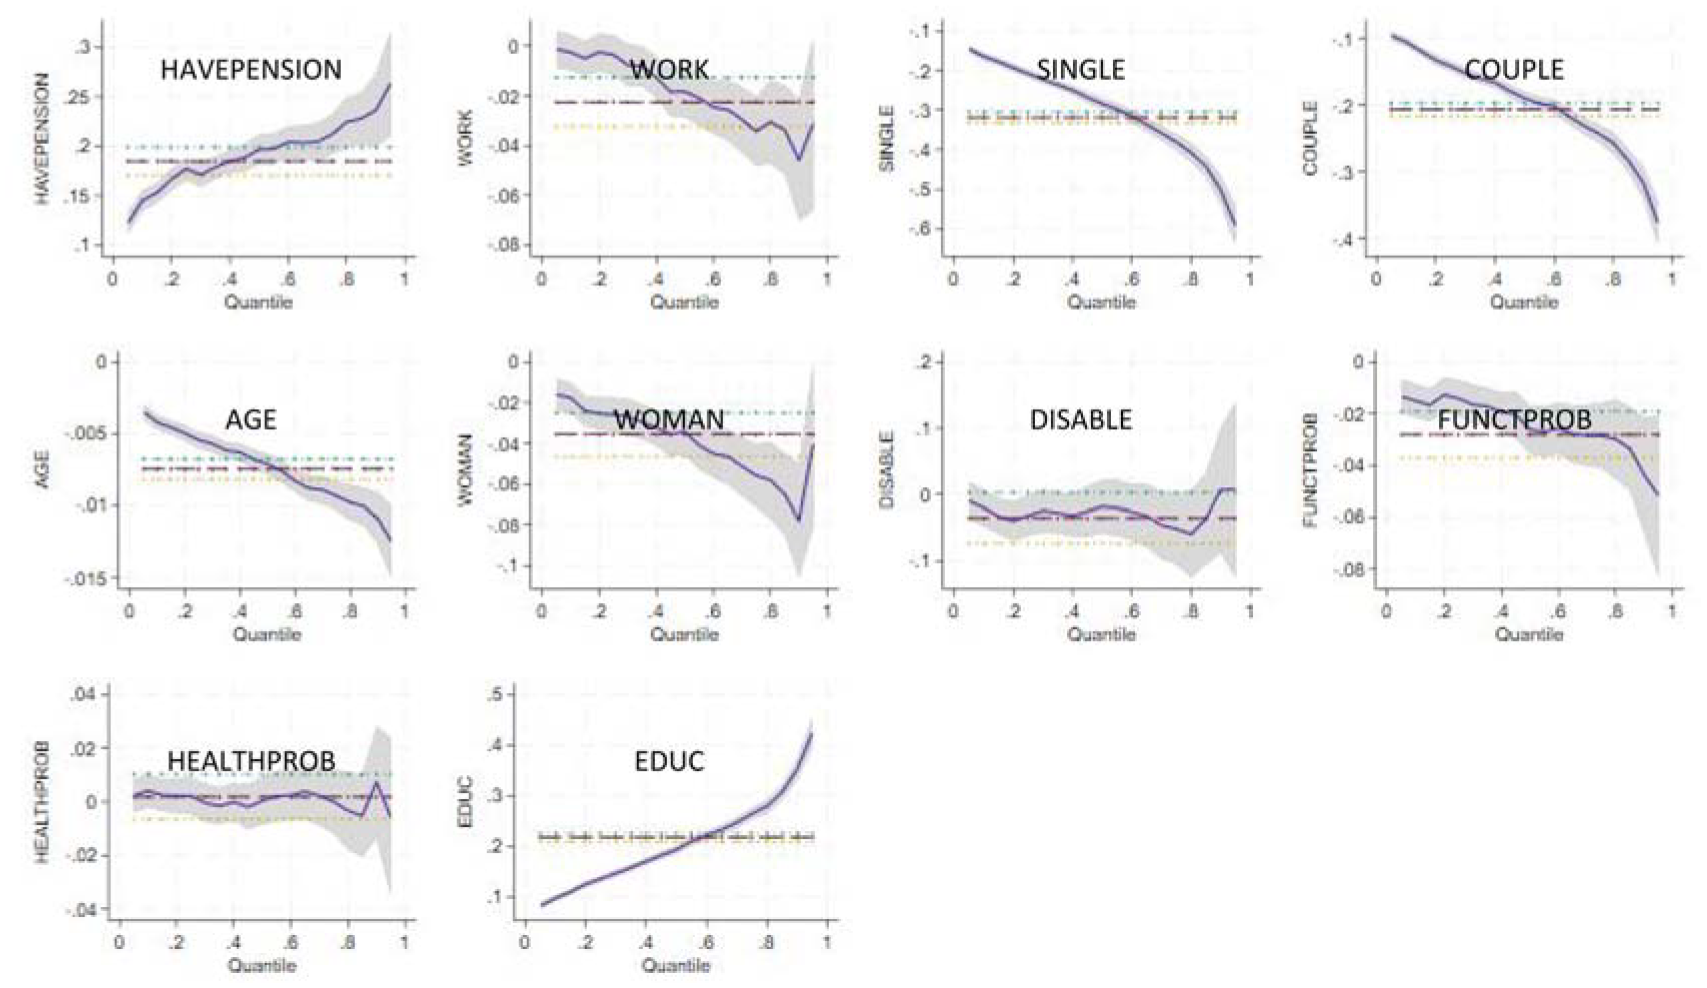
Graphical representation of quantile regression results for food expenditure using various predictors.

Graphical representation of quantile regression results for calorie intake using various predictors.

Graphical representation of quantile regression results for protein intake using various predictors.
Discussion
A significant proportion of elderly Indonesians are economically insecure, as over half reside in households within the lowest expenditure bracket, representing the bottom 40% (BPS, 2020). This economic vulnerability is exacerbated by low pension coverage, with only 8.6% of households receiving pensions. Consequently, 86.6% of household heads remain in employment, and 71.5% are below the age of 60. This trend reveals a lack of economic security among the ageing population, an issue shared by many developing nations (BPS, 2020). Targeted policies are urgently needed to address this financial instability among the elderly in Indonesia.
The dietary patterns of elderly Indonesians indicate a high reliance on carbohydrate-rich staples, with 92.66% consuming these foods at least 14 times per week and only a mere 0.10% reporting no weekly intake of carbohydrates (BPS, 2022). Data from this study aligns with national findings, showing an average daily calorie intake of 2,209.7 kcal per person and protein intake of 64.4 g. However, 76.8% of households failed to meet the recommended 2,100 daily calories, and 86.1% fell short of the recommended protein intake. The predominance of carbohydrates in the diet, coupled with protein deficiencies, suggests a need for policies to improve dietary variety and nutritional quality among the elderly (BPS, 2022).
Despite the availability of diverse food sources, many elderly people struggle to meet their nutritional requirements. The MoH has classified the diets of the elderly into six categories: staples, animal- and plant-based foods, vegetables, fruits and beverages (Kemenkes, 2019). However, our findings revealed that only those in the higher percentiles (75th and above) met or exceeded the minimum dietary standards. Those below the 50th percentile who are economically vulnerable remain at risk of malnutrition. Thus, greater emphasis on dietary diversity is needed to support the nutritional health of elderly Indonesians.
Pension coverage shows a stark disparity between urban and rural areas, with urban pensions nearly triple the rate of rural pensions (19.83% vs. 7.07%) (BPS, 2020). Although civil servant pensions were implemented pre-2004, broader defined benefit schemes initiated in 2015 have yet to reach comprehensive coverage (Bakroh & Hiilamo, 2024; Rouzet et al., 2019). Consequently, economic necessity compels 52.55% of elderly Indonesians to remain in employment, primarily to sustain living costs (BPS, 2022).
Research has demonstrated that elderly individuals in employment generally report better mental and emotional health than their non-working counterparts (BPS, 2022). This aligns with our first hypothesis, as Group C (pension recipients not working) demonstrates superior food security compared to Group B (working without pensions). Group C allocates more to food expenditure and has higher caloric and protein intakes, underscoring the association between pension income and improved dietary quality. Nevertheless, elderly workers still contend with lower incomes, rising healthcare costs, and a lack of legal protection in the informal sector, highlighting their vulnerability (BPS, 2020, 2022).
Despite high carbohydrate consumption, some elderly people struggle to meet the basic dietary guidelines, a disparity indicative of dietary insufficiency within this group (BPS, 2022). However, meeting these recommendations remains challenging for many elderly individuals, highlighting the need for improved dietary support policies (Kemenkes, 2019).
Poverty disproportionately affects Indonesia’s elderly, with an estimated 85% lacking stable income security. Elderly women face elevated poverty rates, often living alone or relying on family support (TNP2K, 2020). In line with this, research findings show that households receiving pensions but not working (Group C) exhibit higher food expenditure coefficients (0.392) and increases in caloric and protein intake compared to the reference Group A without pensions or employment. About 14.7% of Indonesians aged 65 and over fall below the poverty line, reinforcing the need for robust financial support for the elderly (TNP2K, 2020).
Households with pension benefits allocate a larger portion of their resources to food. For instance, the ‘Pension 65 programme in Peru’ covers up to 28% of food costs, rising to 34% in households with multiple recipients (Bernal et al., 2024). This aligns with our findings, as pension-recipient households in Group C allocated an additional 0.392 to food expenditure and had daily caloric and protein increases compared to the reference group, underscoring the significant role of pensions in dietary quality.
Adequate protein is essential for elderly individuals, whose physiological needs increase with age. Limited income during retirement often restricts access to balanced nutrition, making family support crucial for meeting dietary needs (BPS, 2022). This reliance on the family further highlights the importance of social support systems for the elderly.
Similar to findings in Peru, pension benefits positively impact elderly food security, raising food expenditure by 29% and reducing food poverty risk by 17.7% (Bernal et al., 2024; Zhang et al., 2018). Conversely, in India, employment tends to reduce food expenditure among elderly workers, often because of financial constraints (Fong, 2023; Lo et al., 2012).
Finally, physiological changes with age, such as reduced metabolism and sensory decline, compound malnutrition risks the elderly (Zainuddin, 2020). Educational attainment also significantly influences diet, as those with higher education access better nutritional resources, thereby linking income to dietary quality (Damião et al., 2017). Research findings further show that age correlates with reduced food expenditure, caloric and protein intake, whereas higher education enhances dietary quality.
Policy Recommendations
The National Action Plan for Elderly Health 2020–2024, published by the MoH of Indonesia in 2021, underscores a considerable gap in dietary policy initiatives specifically tailored to the elderly population. Although the plan acknowledges the government’s efforts to develop health standards, norms, procedures and criteria for the elderly, it emphasises the critical need for the effective dissemination and enforcement of these policies at the provincial level. Enhancing dietary consumption for older adults requires recognising the financial capability to afford nutritious food, suggesting that policies should align with broader employment strategies, particularly pension schemes, whether contributory or noncontributory.
Given the data showing that individuals aged 60 and above are predominantly in lower-income brackets, there is an urgent need for government intervention to strengthen social safety nets for this demographic group. Support can be structured in three primary ways: (1) implementing noncontributory social assistance programmes, (2) establishing contributory social security schemes and (3) facilitating employment opportunities specifically for economically disadvantaged elderly persons. The findings of the study further reveal that pension households exhibit healthier dietary expenditure patterns than those who work without pensions, highlighting the positive association of financial stability with dietary habits.
Financial transfers directed by the government should enhance social assistance initiatives that combine cash and in-kind support, specifically targeted to optimise impact. Integrating health and unemployment insurance within social security frameworks is also essential for safeguarding vulnerable elderly populations. Additionally, the government and corporations of interest should fund programmes that provide job opportunities for at-risk elderly people, including vocational training and job placement support tailored to their skills.
Elderly women, particularly those living alone, are vulnerable. In Indonesia, matrilineal traditions often designate caregiving responsibilities for children, especially daughters who provide financial support to their mothers. While cohabitation with family members offers financial stability, older women living independently face distinct financial challenges. In 2020, women made up 52% of the elderly population, with 14% living alone. Notably, women aged 60 to 74 years face higher poverty rates, yet only a small portion of the elderly population receives any form of assistance (Larasati, 2021). In response, targeted social assistance programmes for elderly women living alone are urgently needed to ensure financial security and quality of life in their later years.
Furthermore, a significant portion of the elderly population remains economically active, with nearly 85.8% employed in the informal sector, limiting their access to social security programmes due to a lack of financial stability. Compliance with employee rights in the informal sector is notably low. Policymakers should consider policies that incentivise and legally protect informal workers’ participation in pension and social security schemes, offering avenues for informal sector workers to secure retirement.
Low retirement savings across all income groups highlight the necessity for financial reforms. Notably, pension membership is more prevalent among upper-middle-class households than among lower-income groups. Policies should aim to expand the participation of vulnerable elderly individuals in social security programmes, along with efforts to increase financial literacy among active employees regarding the benefits of social security participation to maintain stable post-retirement consumption. Available data suggest that only around 20% of the workforce is covered by the Employment Social Security Programme, highlighting a substantial gap (Larasati, 2021).
Finally, regulatory reforms are crucial for expanding pension programme participation. Formal sector employees are governed by Regulation No. 45 of 2015, which mandates pension programme participation, while small and medium-sized enterprises are also required to participate under Presidential Regulation No. 109 of 2013. However, various business sectors remain unregulated, and awareness of the Minister of Manpower Regulation No. 18 of 2018 is necessary, as it restricts pension rights for Indonesian migrant workers. Consequently, there is an urgent need to broaden these regulatory frameworks to include informal sector employees and migrant workers to ensure equitable social security access.
Further Research
Rigorous policy research is essential for developing a comprehensive understanding of pension reforms in Indonesia. To achieve this, it is crucial to conduct interviews with key policymakers who play a significant role in shaping pension reform initiatives. Future research should involve important stakeholders such as representatives from the National Social Security Council (DJSN), Commission 9 of the House of Representatives (DPR), the Ministry of Finance, the Ministry of Manpower, the Ministry of Social Affairs, the Social Security Administrator for Employment (BPJS Ketenagakerjaan), the Indonesian Pension Fund Association (ADPI), the Financial Institution Pension Fund Association (ADPLK), the National Team for the Acceleration of Poverty Reduction (TNP2K) and relevant labour unions (SPI/KSPI).
In addition, this article underscores the distinctive aspects of studies that examine caregiving behaviour among Asians, particularly Indonesians, in relation to familial obligations. The decision to provide ongoing care for ageing parents is shaped by various factors, including financial considerations, religious beliefs and personal characteristics. This phenomenon is closely connected to the broader issue of the sandwich generation in Indonesia, where individuals often find themselves responsible for supporting three different groups: parents, children and themselves.
Moreover, there is a pressing need for further investigation of the endogenous relationship between the decision to continue working post-retirement and household well-being. For instance, when the head of a ‘disadvantaged’ household chooses to return to work, it is likely to enhance the overall well-being of the family. To comprehend this intricate relationship, a comprehensive analytical approach is required, potentially employing an equation system or instrumental variable technique to effectively address the bidirectional causation inherent in this dynamic.
Conclusion
The study’s findings clearly indicate that elderly individuals receiving pension benefits enjoy significantly greater protection against malnutrition. This observation closely aligns with the primary aim of the first SDG, which sought to eliminate hunger and malnutrition nationwide. This association emphasises the importance of strengthening income security as a practical and effective approach to combat malnutrition in the elderly population. By improving access to pension benefits, this study highlights a tangible strategy for reducing the risk of malnutrition among older adults, thus contributing to broader global efforts aimed at achieving it.
Footnotes
Acknowledgements
The authors wish to express their sincere appreciation to the BPS for granting access to SUSENAS, which served as an essential resource for the execution of this study. It is important to emphasise that all data used in this research were obtained in strict accordance with established legal procedures, adhering to BPS's explicit prohibition against the duplication of external data.
In the process of revising and editing this manuscript, the author(s) employed Grammarly to assist with copy-editing and ChatGPT to rectify syntax errors within the LaTeX writing framework. It is crucial to clarify that these tools were used with a steady commitment to maintain the integrity of the research and ensure the originality of the article.
We would also like to thank Mr. Billington Matthew for supporting the native proofreading process.
Ethical Considerations
The research undertaken herein does not require an ethics statement, as it does not involve clinical trials involving human participants.
Consent for Publication
Permission was granted by the BPS for researchers to publish the research findings derived from the dataset.
Funding
The author(s) disclosed receipt of the following financial support for the research, authorship, and/or publication of this article: This study would not have been possible without the financial support of the Indonesian Endowment Fund for Education (LPDP) under Grant Number: 20210122105810.
Declaration of Conflicting Interests
The author(s) declared the following potential conflicts of interest with respect to the research, authorship, and/or publication of this article: The authors assert that, despite the primary author’s professional affiliation with the Ministry of Finance, rigorous precautions have been taken to mitigate any potential conflicts of interest in the development of this article. Every assertion is grounded in verifiable data and is presented independently of any external influences.
Data Availability Statement
The data that support the findings of this study are available from the BPS, but restrictions apply to the availability of these data, which were used under licence for the current study, and so are not publicly available. However, data are available from the BPS upon reasonable request and with their permission.