
Abstract
Factors affecting survey quality, such as questionnaire length, screen design, incentives for respondents, and answering devices have been extensively researched before. This study introduces a new dimension to the factors of response bias’ factors and focuses on the possibility that Like habits and motives in social networking services (SNS) may lower the psychological barrier to favorable reactions for brand loyalty (e.g., recommendation intention). Propensity score was applied to the results of Japanese smartphone users’ online survey, and the effect of Like habits on response tendencies was verified. Results show that compared to the group that did not use SNS, there were no differences with those who used true Likes, and a group of inertia Like has a high score—becoming clear that the psychological barriers differ depending on Like motive. If the SNS usage status of survey respondents fluctuates, the results may be biased and mistakes could occur in decision-making.
Building long-term customer loyalty contributes to efficient corporate profits. This is because customers with high loyalty have a high repurchase rate (Oliver, 1999) and often recommend brands to acquaintances (Aaker & Joachimsthaler, 2000). Hence, the number of highloyalty customers greatly influences the stability and growth potential of corporate management. Various indices are used to measure loyalty. In particular, being confident enough to recommend it to others is a sign of commitment to the brand (Aaker, 1991). Psychological barriers are higher for one’s willingness to encourage others to recommend compared with the satisfaction/preferences generated by individual emotions. Moving beyond such barriers and having recommendation intentions is a strong indication of interest in a brand. Based on this concept, recommendation intentions have been generally used in marketing surveys that measure loyalty in both industry and research.
However, with the rise of social networking services (SNS) and the creation of the “Like” button, the act of recommendation has become quite common. Likes, shares, and comments are common forms of customer engagement on social media platforms (Kabadayi & Price, 2014). Among them, the Like button is the simplest and easiest way to engage with one click (Gavilanes et al., 2018; C. Kim & Yang, 2017; Liu et al., 2017), and more people tend to Like posts than comment on them (Gerodimos & Justinussen, 2015). Owing to the simplicity of the action, the motives behind liking social media content are ambiguous. Consumers develop a habit of pressing the Like button unconsciously or to maintain social relationships, regardless of whether they feel the content of the post is good (Chin et al., 2015; Egebark & Ekström, 2018; Eranti & Lonkila, 2015; Hayes et al., 2016; Lee et al., 2016; Leiner et al., 2018; Levordashka et al., 2021; Sumner et al., 2018).
Thus, in relation to motives, Likes are classified into two types. The first is a “true Like,” when consumers feel good and want to recommend a post’s content to their acquaintances. The other is an “inertia Like,” such as liking a post to maintain relationships with acquaintances, returning Likes from others, and unconsciously liking posts while browsing social media. In particular, the latter habit has taken root in consumers’ daily lives.
The effects of Likes on consumer behavior have been discussed in many previous studies (Beukeboom et al., 2015; Ding et al., 2017; Egebark & Ekström, 2018; Sherman et al., 2016; Sorensen et al., 2017; Thai & Wang, 2020). Since it is difficult to judge individuals’ motives behind or feelings regarding Likes from data, previous studies have mainly focused on number of Likes (Ji et al., 2017). Therefore, research on inertia Likes is overwhelmingly insufficient. Furthermore, this study focused on the impact of inertia Likes on response trends in marketing research, which was surprisingly uncontroversial. In the present study, it was assumed that it is possible inertia Like habits in SNS could reduce the psychological barriers to favorable reactions in marketing surveys. For verification, an online survey was conducted to examine consumer attributes, SNS usage, and loyalty indices for smartphone brands, and the influence of SNS Like habits/motives on response tendencies was subsequently examined. In this study, the following four hypotheses were verified; H1: Compared to those who do not use SNS, those who do use SNS but do not have a Like habit will show no differences in scores for loyalty indices on surveys; H2: Compared to those who do not use SNS, those who have become accustomed to providing true Likes on SNS will have higher scores for loyalty indices on surveys; H3: Compared to those who do not use SNS, those who have become accustomed to providing inertia Likes on SNS will have higher scores for loyalty indices on surveys; H4:The effect size of inertia Likes, as in H 3, will be larger than the effect size of true Likes in H2. If it is evident that Like habits affect survey responses, companies should consider that SNS usage in a sample is constant when conducting regular marketing surveys. Accordingly, this study provides useful suggestions for both industrial and academic research.
Literature Review and Hypotheses
Like’s Influence on Consumer Behavior
As shown in the consumer behavior model AISAS (Attention → Interest → Search → Action → Share; Kono, 2009), it is common for consumers to voluntarily search for information before the purchase and post reviews after it. When searching for information, consumers refer to word-of-mouth as well as official company information. This is because word-of-mouth expresses what the consumer, who has experienced the product/service, feels without any commercial intention. SNS users like the opinions of others (Bastos, 2015). There are around 4.62 billion SNS users in 2022, which is 3.1 times that of 2012, and the mean usage time of SNS is 2 hr 27 min per day (Kemp, 2022). Additionally, the size of the SNS market is expected to continue to grow.
The “Like” button is one of the factors that supports the growth of SNS. The Like button was first introduced by the video site Vimeo in 2005, but it became widespread globally when it was adopted by Facebook in 2009 (Moffat, 2019). At the beginning of the development of Facebook, adding an “Awesome” button was considered. Facebook had concerns that users would find the button annoying (Khrais, 2018); however, the ability to easily express support for connected acquaintances and recommend content to others resulted in an environment that motivates consumers to make posts.
Exchanging opinions about products and services with friends on SNS greatly influences subsequent purchase behavior (X. Wang et al., 2012). In particular, the Like button has a significant impact on the recipient of information. Social endorsement via Likes tends to garner trust because it is voluntary rather than driven by commercial intentions (Thai & Wang, 2020). For example, impressions of posted photos have been shown to vary depending on the Like count (Sherman et al., 2016). Likes also have a huge impact on businesses (Lipsman et al., 2012; Trattner & Kappe, 2013), as companies are more often concerned about the number of Likes than that of fans (Naylor et al., 2012). BestBuy.com and more than 350,000 other websites installed a Like button within a few months of Facebook’s appearance (Gelles, 2010). Clicking “Like” on a brand page on Facebook contributes to brand attitude, such as brand love, purchase intention, and recommendation intention (Beukeboom et al., 2015; Kudeshia et al., 2016; Pöyry et al., 2013). In fact, a 1% increase in a movie’s prerelease Like count has been shown to increase box office revenue in the first week by approximately 0.2% (Ding et al., 2017). Since such an effect has been confirmed, research on activities that increase or have increased the number or effect of Likes has also been conducted (López et al., 2017; VanMeter et al., 2018). As indicated by these previous findings, companies should actively manage consumers experiences in the SNS brand community to encourage dialog and endorsements between consumers (X. W. Wang et al., 2019).
In addition, Like data are used in academic research as a source of information that expresses user preferences. Moreover, sensitive personal attributes, such as ethnicity and political views, can be inferred (Kosinski et al., 2013). It was also reported that computerbased judgments of people’s personalities based on Like data are more accurate and valid than judgments made by their close others or acquaintances (e.g., friends, family, spouse, colleagues [Youyou et al., 2015]). In the 2008 US presidential election, Like count also revealed that photos with Mrs. Michelle Obama and her daughters, as well as Mr. Obama, had an even more engaging effect, compared to Mr. Obama’s photo (Gerodimos & Justinussen, 2015). Thus, as data generated from the Like button are useful, such data are also called the “like economy,” and are actively used in both industry and research (Gerlitz & Helmond, 2013).
Many reports have shown that Likes represent a positive attitude toward brands and brand content. Therefore, considering that consumers habitually repeat favorable behaviors, three hypotheses were derived. H1 was derived based on the assumption that there would be no differences between both those who do and do not use SNS without a Like habit in favorable response tendencies (e.g., preference, satisfaction, repurchase intention, recommendation intention). For H2 and H3, it was assumed that for SNS users, a Like habit would lead to lower psychological barriers for favorable reactions, compared to those who do not use SNS, regardless of motives.
Inertia Like Habituation on SNS
Consumer inertia behavior has been emphasized in academic research, with the most active discussions on spurious loyalty. Loyalty cannot be judged only by the number of purchases. Factors like inertial continuous and forced continuous purchases should also be considered. It also includes the case where the calculation continues in consideration of the loss that occurs when the relationship with the brand ends. In other words, loyalty cannot be judged without looking at behavioral indices as well as attitude indices (Assael, 1987; Cushing & Douglas-Tate, 1985; Dick & Basu, 1994; Gilliland & Bello, 2002).
Inertial continuous purchase behavior has been reported in studies in various industries. In online shopping, consumer inertia, rather than satisfaction was found to contribute to repeat purchases (Kuo et al., 2013). In the residential electricity market, consumers rarely search for alternatives, and inertia is likely to occur (Hortaçsu et al., 2017). Inertia has shown a stronger influence in healthcare than in other service sectors (Gonçalves et al., 2020). Factors of inertia in purchase behavior include product/service similarity, financial/time costs in brand switching, learning costs, and habituation (B. Kim & Kang, 2016; White & Yanamandram, 2004).
Inertia is also important in relation to Like behavior on SNS. Along with the influence of Likes as discussed above, it should be noted that Like motivation is not a simple positive evaluation (Leiner et al., 2018). Aside from the positive motivation for users to genuinely express that they like SNS content (Kudeshia et al., 2016; Munar & Jacobsen, 2014; Swani et al., 2013) or provide their opinions (won J. W. Kim, 2014), Likes can be used passively, such as for maintaining social ties with acquaintances (Chin et al., 2015; Levordashka et al., 2021; Sumner et al., 2018), pleasing others (Lee et al., 2016), and rewarding those who Liked the user’s own posts (Eranti & Lonkila, 2015). Alternatively, Likes act as a form of aimless automated communication (Hayes et al., 2016). In fact, an unconscious tendency to like posts regardless of the content has been clarified. Users are less likely to prefer posts that only one stranger has liked, but tend to Like posts that three strangers have liked (Egebark & Ekström, 2018). Therefore, consumers will develop a habit of succumbing to Like inertia, regardless of whether content is good or bad. The reason why users can press the Like button unconsciously or easily is that liking is the simplest action that can be performed on SNS, compared to commenting and sharing (Gavilanes et al., 2018; Gerodimos & Justinussen, 2015; C. Kim & Yang, 2017; Liu et al., 2017). In this context, ease can include both the amount of activity and the psychological burden that comes with users’ concerns that commenting poorly or sharing lowquality content with their comments added could damage their status and credibility (Thompson et al., 2020; Yoon et al., 2018).
However, academic research also indicates that Likes are limited in their ability to capture users’ true intentions. Reacting to SNS content by providing a comment shows the strength of a relationship more than making one click to Like content. Moreover, inperson and telephone contact are more effective than all forms of SNS content interaction (Burke & Kraut, 2014). Consumers are less likely to buy a brand when they learn that their friends like the brand through Likes on social media than when they learn through offline means that a friend genuinely likes a brand (John et al., 2017).
Thus, inertia Likes are used without the act of recommendation maintaining its significance. When inertia Likes are habitual, attention is paid to the possibility that these Likes increasingly lower psychological barriers to favorable reactions when compared to true Likes. Therefore, a fourth hypothesis was as developed as follows:
Since it is difficult to judge consumers’ motivations and feelings from data on Likes, previous studies have mainly focused on the number of Likes received (Ji et al., 2017). Considering the lack of method for expression, Facebook has developed a reaction function that can express Love, Care, Haha, Wow, Sad, and Angry as an extension of Like (Facebook, n.d.). However, consumers still enjoy the simple action of clicking the Like button, including users of various SNS such as Twitter, YouTube, and TikTok. Therefore, the impact of consumers’ underlying motives should be carefully observed. As shown in Table 1, and to the best of my knowledge, this study is the first to focus on the effects of inertia Likes on response trends in marketing research.
Previous Research on the Effects of Likes When Using SNS.

Research Method
Survey Method
In this study, an online survey was conducted in Japan from January 15 to 21, 2021. Respondents were unaware of the purpose of this study, which was to investigate the relationship between behavior on SNS and response tendencies in marketing surveys. Smartphones were selected as a product close to SNS. The title of the survey was displayed as “Survey on Smartphones.” The two conditions for the respondents were that their ages were between 20 and 60 and they possessed a smartphone. The sample size was calculated using the following: 5 generations ×’ 2 genders = 10 categories. Each category had 60 people: hence, a total of 600 people. The survey was distributed to a panel owned by a research company in Japan to achieve the target sample size.
An online survey points to minimization of an effort called “Satisficing” that can reduce the reliability of responses (Krosnick, 1991). Therefore, to improve reliability, it is effective to shorten the number of questions in the survey as much as possible and reduce the burden on the respondents. Based on this, the following 15 items were defined: (1) gender, (2) age, (3) area of residence, (4) annual household income, (5) frequency of Read, (6) frequency of Like, (7) frequency of Post, (8) motive of Like, (9) owned smartphone brand, (10) purchase elapsed time, (11) purchase emphasis point, (12) preference, (13) satisfaction, (14) repurchase intention, and (15) recommendation intention. The distribution of respondent attributes for items (1)−(4) is shown in Table 2. The information on the device was automatically acquired by the survey system. Device data were collected because the answering tendency differs depending on the device (Lugtig & Toepoel, 2016; Mavletova, 2013), so the influence was taken into consideration. Items (5)−(7) were asked in relation to Twitter, Facebook, Instagram, and TikTok, which are the most commonly used SNS in Japan. The choices were as follows: “not at all,”“less than once a week,”“two to three times a week,” four to six times a week,” and “every day.” Like and Post were controlled, so that options higher than the frequency of Read could not be selected. In (6), there were restrictions on the targets of Like (e.g. acquaintances, celebrities, brands).
Distribution of Respondent Attributes.

As shown in Table 3, Twitter was the most used in all cases. The results of extracting Read, Like, and Post of the most frequently used SNS of each respondent are at the bottom of Table 3. Item (8) presented the following four motives for Likes: (a) Like feeling really good, (b) Like telling the fact that you saw it, (c) Like in return, (d) Somehow Like. Here, (a) is a true Like, and (b)–(d) are inertia Likes. Then, numerical answers were requested, so that the ratio of each motive would be 100% in total. It was set such that only answers with a total of 100% would be accepted. As shown in Figure 1, the answers were concentrated in a nice round number because the answers were free input, but real Likes were distributed in a well–balanced manner from 0% to 100%. Inertia Likes were most often 0%, but were continuously distributed, up to approximately 50%. Items (9)−(15) were questions about smartphone brands. In (9), Apple, Fujitsu, Samsung, Sharp, and Sony, which were the top five smartphone brands in Japan in 2020 (MM Research, 2021 (Sudarshan, 2021)), were presented as options. The distributions of (9) and (10) are shown in Table 2. In (11), design, performance, price, quality, reputation, usability, and others were presented. Questions (12)−(15) were loyalty indices, which were scored using five scales (e.g., 1: very unsatisfied, 7: very satisfied).
SNS Usage Status.


Distribution of Like motives.
As shown in Table 4, when looking at means by brand, Apple had the highest score for all indices. By index, recommendation intention had the lowest mean. As mentioned above, these results indicated that the psychological barrier was higher for the intention to recommend to others than the preference, satisfaction, and repurchase intention that are completed by individual emotions.
Means of Loyalty Indices for Each Smartphone Brand.

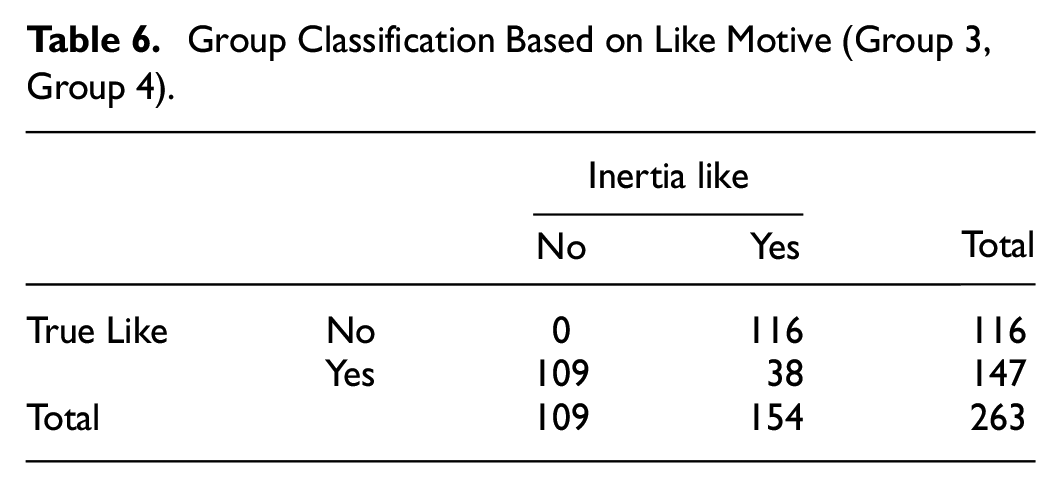
Here, groups were defined to test hypotheses. As shown in Table 5, from the results of (5)−(6), 214 people who did not Read or Like were Group 1 (No SNS use), and 123 people who Read but do not Like comprised Group 2 (No Like use). The remaining 263 were categorized as Like motives. In (8), the flag of true Like was set when (a) was 50% or more, and the flag of inertia Like was set to 1 when (b)–(d) was 50% or more in total. If both were exactly 50%, both flags were set to 1. As shown in Table 6, 109 people with a high percentage of true Likes were classified as Group 3 (true Like), and 116 people with a high percentage of inertia Likes were classified as Group 4 (inertia Like). There were 38 respondents with an equal proportion of both true Likes and inertia Likes, and they were excluded due to the small sample size. Table 7 shows the definition of each group and a list of the number of respondents per group.
Group Classification Based on Read and Like Frequency (Group 1, Group 2).

Group Classification Based on Like Motive (Group 3, Group 4).
Definitions for Each Group.

Verification Method
If randomization is possible, it is ideal to conduct a randomized controlled trial, which is the most reliable scientific basis (Torgerson & Torgerson, 2008). However, it is difficult to ask randomly selected people to specify their frequency of SNS use and to implement it for a certain period. In addition, liking content as a habit is more appropriate rather than forcibly pressing the Like button.
The propensity score proposed by Rosenbaum and Rubin (1983) is a typical method for estimating causal effects when randomization is difficult. The covariates are adjusted by aggregating multiple covariates into one variable (i.e., the propensity score). This is because, in each group, the characteristics of consumers were biased. For example, as shown in Table 8, when comparing the respondent attributes of each group, Group 1, which did not use SNS, had a higher age bracket than other groups. The tendency of the younger generation to have a higher SNS usage rate is common worldwide (Schumacher & Kent, 2020). In addition, looking at the distribution of brands, there was a large gap in Apple usage rate (Brand Apple) between Group 1 and Group 4. Accordingly, it would have been meaningless to compare the response tendencies of loyalty indices. In the present study, Group 4 had the highest scores for all loyalty indices, but this was affected by various factors and no conclusion could be drawn.
Variable List and Means for Each Group.

Therefore, causal effects were estimated by matching respondents with similar propensity scores and homogenizing both groups. In this study, propensity score matching was performed for each of the two paired groups (Groups 1 and 2, Groups 1 and 3, and Groups 1 and 4). In the case of three or more groups, the method of homogenization by generalized propensity score matching was not adopted, owing to the insufficient sample size. When the true value of the propensity score of each respondent is unknown, as was the case in the present study, the method of estimating from the data using a logistic regression model is common. Numbers 5 to 30 shown in Table 8 were set as the explanatory variables. Numbers 8, 24, and 30 were set as the criteria of the dummy variable and not used in the model. For the objective variable, 0/1 data indicating either Group 1 (control group) or Groups 2–4 were input. Thus, the propensity score represented the probability that each respondent would belong to Groups 2–4. Since there were many explanatory variables used when building the model, variable selection was performed using the stepwise method.
The difference in the distribution of loyalty indices was verified by Fisher’s exact test for the two groups matched using propensity scores. The chi-square test was not used because the cells in the contingency table contained numbers less than 10. The null hypothesis was that there would be no difference in the distribution of loyalty indices between the two groups. The applied significance level was 5%, and the null hypothesis was rejected when the p-value was less than .05. An alternative hypothesis was adopted: there would be a difference in the distribution of loyalty indices between the two groups. This test verified H1−H3. H4 was compared with Cramer’s V, which represents the effect size. Generally, it is judged as follows: 0.1 is a small effect size, 0.3 is medium, and 0.5 is large (Grant et al., 2012; Khalilzadeh & Tasci, 2017).
To carry out the test strictly, the validity of the sample size was confirmed. The appropriateness of the sample size was confirmed using a power analysis. A total of 132.614 people were calculated based on the following conditions: significance level, 5%; power, 80%; effect size, medium 0.3 (Cohen, 1992); and the degree of freedom, 4 (2 groups, matrix of loyalty indices in 5 scales). It was confirmed that the total number of people in both groups needed to be 133 or more. If the sample size was excessively large, there would be a concern that even a meaningless difference may be detected. The effect size was 1,193.529 when calculated with a small effect size (0.1) and 298.382 when calculated with an effect size of 0.2. Since there was a concern that excessive detection would occur if these values were exceeded, care was taken not to exceed 300 people per group.
It should be noted that statistical analysis was conducted using the software program R. The stepwise method used was the stepAIC function of the MASS package. Propensity score matching was conducted using the Match function of the Matching package, and the power analysis was performed with the pwr.chisq.test function of the pwr package. Fisher’s exact test and Cramer’s V were conducted using the Fisher test function and assocstats function, respectively.
Results
Propensity scores were estimated using logistic regression modeling. As shown in Table 9, in comparisons between Groups 1 and 4, Age had a negative effect and Brand Apple had a positive effect; thus, it can be seen that there were many young people and Apple users in Group 4. In addition, the residential area was adjusted. The c-statistic was 0.725, confirming the validity of the model. Models were built in the same way for Groups 1 and 2, and Groups 1 and 3. Matching was performed using estimated propensity scores. Originally, Group 1 had 214 people, Group 2 had 123 people, Group 3 had 109 people, and Group 4 had 116 people. As a result of matching, there were 114 people each in Groups 1 and 2, 91 people each in Groups 1 and 3, and 94 people each in Groups 1 and 4. These sample sizes met the conditions described in Section 3.2. As seen in Table 10, when the respondent attributes of each group after matching are compared, it can be understood that they are homogenized. For example, between Group 1 and Group 4, there was a large difference between Age and Brand Apple, but the values were almost the same. Hypotheses were tested based on data from these matched respondents.
Logistic Regression Model for Estimating Propensity Score.

Note. SE: standard error.
p < .001; **p < .01; *p < .05.
Comparison of Respondent Attributes in Both Groups after Propensity Score Matching.

SD = standard deviation.
Fisher’s exact test was performed on the matrix of group ×’ distribution for each loyalty index. First, as a reference, the results before propensity score matching were confirmed. As shown in Table 11, there were significant differences between Groups 1 and 3, and Groups 1 and 4. Compared to Group 1, who did not use SNS, it is thought that the fact that there were many young people and a high usage rate for Brand Apple, which has high loyalty, had an effect on each loyalty index. Next, the differences in the response tendencies in each group homogenized by matching were confirmed. As shown in Table 11, there were no significant differences between Groups 1 and 2, which was the same as before matching. Therefore, H1 was supported. Next, there were no significant differences between Groups 1 and 3. This indicated that the significant difference was canceled by homogenizing the conditions, such as respondent attributes and the brand of smartphone owned. Thus, H2 was rejected. However, in Group 1Group 4, the p-values were <.05 for all indices. Since there was still a difference in response tendencies after matching, it could be inferred that this was the effect of Inertia Likes. Hence, H3 was supported. Table 12 shows the matrix of each index in Group 1-Group 4. Looking at the distribution of answers, Group 4 had many answers of “5” for all indices. Comparing the effect sizes of Group 1−Group 3 and Group 1−Group 4, the latter was higher for all indices. In particular, repurchase intention was the highest at 0.272, which indicated a medium effect size. There were no significant differences in Group 1–Group 3. Thus, H4 was supported.
Fisher’s Exact Test Results before and after Matching.
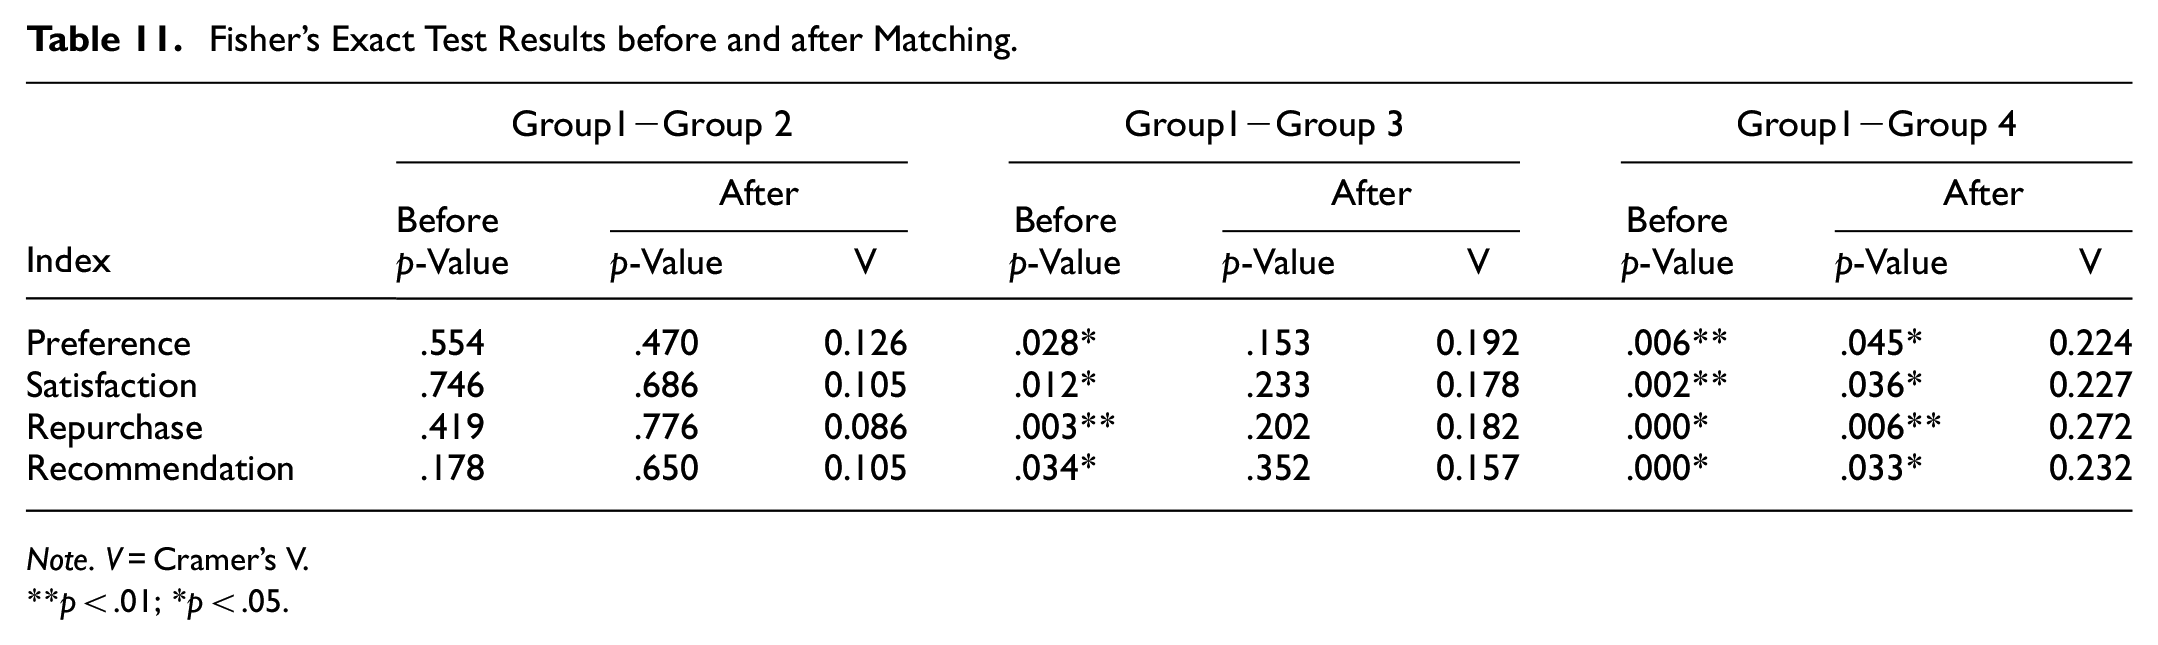
Note. V = Cramer’s V.
p < .01; *p < .05.
Distribution of Loyalty Indices and Test Results (Group 1−Group 4).

p < .01; *p < .05.
From the above, hypotheses H1, H3, and H4 were supported, while H2 was rejected. This indicated that even if true Likes become a habit, this would not affect response tendencies for loyalty indices. Furthermore, it was confirmed that, when inertia Likes become a habit, responses tend to have high scores. The starting point of this study was the reduction of the psychological barrier to providing responses indicating favorable attitudes in marketing surveys due to the habituation of inertia. However, although inferior to inertia Likes, it was assumed that the same effect would occur even with the habituation of true Likes; however, there was a clear difference. It was observed that by repeating inertia Likes daily, consumers become “paralyzed” by the act of showing a favorable attitude, leading them to easily provide high scores on marketing surveys.
Discussion
Implications
Being confident enough to recommend a brand to others is a sign of high loyalty. Psychological barriers are higher for the willingness to recommend something to others compared with the satisfaction/preference generated by individual emotions. However, with the spread of SNS in daily life, consumers tend to recommend things to their connected acquaintances using the Like button. Since it is easy to use, many consumers have become accustomed to providing inertia Likes. Therefore, in this study, the focus was on the possibility that Like habits and motives when using SNS reduce the psychological barrier to favorable reactions in marketing surveys. The impact was evaluated using propensity score matching based on the results of an online survey in Japan. As a result, there were no significant differences in the response tendencies of scores for loyalty indices in the group that did not use Likes or the group who used true Likes, compared to the group who did not use SNS. However, significant differences were confirmed in the group who used inertia Likes. Thus, it became clear that the psychological barriers to positive attitudes differed depending on the motivation behind clicking the Like button. It is thought that by repeating inertia Likes on a daily basis, consumers become paralyzed by the act of showing a favorable attitude and thus easily select high scores when taking marketing surveys.
The above results provide important implications for marketing practices. It is common for companies to measure the effects of products/services by regularly observing loyalty indices. However, overlooking the influence of Like habits on survey responses raises concerns that survey results may be biased. In other words, the factor when the survey results fluctuate may not be the influence of products/services, but the influence of changes in the SNS usage tendencies of the respondent group, especially regarding Like motivation. In this case, the company may make a mistake in decision–making. Similarly, in academic research, biases such as SNS habits and motives should be considered, so that effects other than those intended are not included. In addition, the results encourage marketers to consider Like habits when using brand attitude metrics in identifying high–loyalty customers. Otherwise, there is a risk of overestimating customers who are just paralyzed by Like’s habits. In this way, it is significant to grasp the usage status of SNS in terms of both measuring the effectiveness of marketing measures and identifying loyal customers. This study provides useful suggestions for both industrial and academic research.
Limitations and Future Work
This study also has several limitations. First, since this study targeted only the Japanese market, there is a limit to the generalization of the findings. In the future, the scope should be expanded to other countries, and differences in Like motives and the related impact on survey responses should be examined. Second, the effect of Like frequency was not considered. As shown in Tables 5 and 6, the sample size of each group was approximately 100, making it difficult to subdivide by frequency. Third, the influence of Post was not considered. As shown in Table 3, the active ratios were Read (64.3%) > Like (43.8%) > Post (35.2%). There are very few people who Post but do not Like, and those people have not been evaluated. However, in the real world, such people are considered a minority. Fourth, Read/Like/Post use data was based on awareness surveys rather than behavioral data. Ideally, research should track usage records and handle factual data. However, this method is difficult to implement due to privacy considerations. Fifth, the effect of changing Likes to another similar function is unclear. It has been pointed out that adherence to Like has become too strong and has a negative impact on consumers’ mental health (Royal Public Society for Public Health, 2019). A quantified metric as a Like count stimulates the desire for more support and intensifies competition with peers. There is concern that this competitive thinking will increase psychological burden, especially among young people (Li et al., 2018). In response to these social issues, Instagram began testing by hiding Like counts in 2019 (Wagner, 2019), while Facebook has announced that it will abolish Like and focus on Follow (Awan, 2021). However, there are many dissenting opinions about this choice, and a browser plugin that restores the hidden Like count has been unofficially developed (Leighton, 2019). As of January 2021, in Japan, the Like function has been implemented on Twitter, and TikTok, and the Like button still exists on Instagram (the Like count is hidden). However, although there is a possibility that the name will be changed from Like or the function will be modified in the future, it is unlikely that it will be eliminated. If there is a change in functionality, this verification should be performed again. Sixth, the subject of Like is not considered in this study; there are various targets and reasons for pressing the Like button, such as friends, celebrities, and brands. Differences in the effects of these differences on paralysis have not been clarified yet. These may serve as future research topics.
The impact of Likes on consumer behavior due to the rapid penetration of SNS has attracted attention. However, Like motives are often unconscious or are related to the maintenance of social relationships. In this study, it was found that the ratio of true Likes and inertia Likes was almost the same. Therefore, a critical examination of Likes without favorable attitudes has come to be discussed (Burke & Kraut, 2014; John et al., 2017). To the best of my knowledge, this study was the first to focus on the effects of inertia Likes on response trends in marketing research. Research on factors affecting survey quality have been extensively conducted, such as questionnaire length (Galesic & Bosnjak, 2009), screen design (Healey, 2007; Maloshonok & Terentev, 2016), incentives for respondents (Kato et al., 2020), and answering devices (Lugtig & Toepoel, 2016; Mavletova, 2013). However, the perspective presented by this study was missing in the current literature. Based on the verification results, marketers were urged to understand Like’s habits on social media, both in measuring the effectiveness of marketing measures and in identifying the loyal customers. Thus, this study contributes to the development of research on the effectiveness of Likes on SNS and the quality of marketing research.
Footnotes
Declaration of Conflicting Interests
The author declared no potential conflicts of interest with respect to the research, authorship, and/or publication of this article.
Funding
The author received no financial support for the research, authorship, and/or publication of this article.