
Abstract
With the rapid growth of China’s energy consumption and the great pressure on reduction of carbon emissions, natural gas is an increasingly valuable energy source for enhancing energy and environmental sustainability. To sustain external natural gas supply, China has constructed a series of gas pipelines and liquefied natural gas (LNG) terminals for the increasing gas importation. This article identified five gas corridors of China: Central Asia–China gas pipelines, Myanmar–China gas pipelines, Russia–China gas pipelines, Australia/Southeast Asia–China seaborne LNG shipment, and Middle East/North Africa–China seaborne LNG shipment. It then proposed a group of indicators that may influence the security of China’s external gas shipment from a supply chain perspective, and composed them into a Risk Index for assessing the corridors of China’s natural gas importation using the Fuzzy AHP and Technique for Order Preference by Similarity to Ideal Solution (TOPSIS) methods. The results indicate that (a) transport distance, geopolitical risk, and resource risk are the major obstacles for China’s natural gas importation; (b) China’s natural gas importation is experiencing a mid-level risk, and the gas pipelines from Central Asia, Myanmar, and Russia are the most secure gas corridors for China, while LNG shipment from Middle East and North Africa has the greatest risk index. (c) China’s diversification strategy has been successful, but a more balanced strategy is suggested to deal with the high gas dependence on Turkmenistan and Australia, as well as Russia when the cross-border gas pipelines are completed and fully utilized in the near future.
Introduction
Throughout recent decades, China’s energy demand has increased sharply, with total primary energy supply (TPES) rising from 1,609 million tons of oil equivalent (Moe) to 3,273.5 Moe between 2004 and 2018, whose share in world TPES grew from 14.7% to 23.6% (British Petroleum, 2019b). Along with the explosive growth of energy consumption, this country is experiencing growing dependence on external supply of fuels (Yang et al., 2014), especially that its oil import dependence climbed up from 30% in 2000 to 67% in 2017, and gas import dependence also went to 38% (British Petroleum, 2019a). Compared with world energy mix, China has an excessive reliance on coal to sustain energy supply. Historically, coal has dominated China’s energy mix with a share of no less than 60%, while natural gas takes up a very small share of less than 6% before 2015 (National Bureau of Statistics of China, 2017; see Figure 1).

Energy mix of China, 1952–2018.
China has promised to reduce greenhouse gas emissions to 60%–65% of the total for 2005 by the year 2030 (Cui et al., 2014). As the cleanest conventional energy source, natural gas has less CO2 and nearly zero NO x and SO2 emissions compared with coal and oil (De Gouw et al., 2014; Gillessen et al., 2019; Shaikh & Ji, 2016), which made it an important fuel alternative in policy circles (Gillessen et al., 2019; Shaikh, Ji, Fan, Shaikh, et al., 2017). To increase energy and environmental sustainability, China has been transiting to a more diversified energy mix, and turned to natural gas as a major alternative fuel since early 2000s (Leung et al., 2014).
From 2000 to 2018, natural gas consumption in China went up sharply from 24.5 bcm (billion cubic meters) to 283 bcm (British Petroleum, 2019b). To increase gas supply, China has enlarged domestic gas production scale (Qin et al., 2018; Ren et al., 2015) from 27.2 bcm to 161.5 bcm (British Petroleum, 2019b). Thanks to these gas production increments, China has become the sixth largest gas producer and the third largest gas consumer of the world. Besides, it has also turned into a substantial player of international gas market, who has been the largest gas importer of the world by the end of 2018 (British Petroleum, 2019b).
China has already set a goal of no less than 10% of natural gas in TPES (National Development and Reform Commission [NDRC] and National Energy Administration [NEA] of China, 2016), and it was projected that by 2040, China’s demand for natural gas would increase by 166% on 2017 level, whose share in energy mix would double to 14%, and the gas dependence would rise up to more than 43% (British Petroleum, 2019a). To fill this expanding gap between domestic gas supply and demand, it has to seek for a reliable and sustainable gas supply from external market. However, the gas importation is a major challenge for the sustainable gas supply of China. How to protect its external gas supply from various kinds of risks has drawn intensive concern from policy makers and energy experts.
Therefore, this article describes the natural gas supply and demand situation, and analyzes the five main corridors of natural gas importation in China. Then, from a perspective of supply chain, it identifies 11 risk indicators for evaluating the 5 corridors using the Fuzzy AHP and Technique for Order Preference by Similarity to Ideal Solution (TOPSIS) methods. Finally, it draws some conclusions for this research and provides some policy implementations for ensuring the security of China’s natural gas importation.
China’s Natural Gas Supply and Demand
From a worldwide perspective, natural gas is also one of the main energy sources that drives world economy development, with a share of more than 23.9% in world energy mix in 2018 (British Petroleum, 2019b). It is expected to support the sustainable energy transition process (Gillessen et al., 2019) and remain the main energy source in the low-carbon age (Liu et al., 2013; Mistré et al., 2018; Verbong et al., 2013).
Gas Reserves, Supply, and Demand of China
China is scarce in natural gas resources. As the largest energy consumer of the word, it only owns 3.1% of world natural gas reserves, with proved natural gas reserves merely 6.1 trillion cubic meters, ranking seventh in the world (British Petroleum, 2019b). In fact, gas fields are mainly located in western and northern regions of China, and three basins (the Tarim Basin in Xinjiang, the Ordos Basin across Inner Mongolia, Shaanxi and Ningxia, and the Sichuan Basin) cover more than half of proven gas reserves of China (Higashi, 2009).
Traditionally, natural gas did not play an important role in China’s energy supply until early 21st century, when its economy and energy demand grew at a surprising speed, and it has to seek for alternative fuels to increase energy supply and diversify its energy mix (see Figure 1). After that, China’s natural gas production and consumption increased dramatically, and the gap between domestic gas supply and demand kept expanding, as shown in Figure 2. To fill this gas, China has to seek for gas supply from the international market.

Production and consumption of natural gas in China (2003–2018).
During the past decade, China has imported natural gas from about 30 countries, as shown in Table 1. While only half of them are the regular gas suppliers, who used to provide natural gas to China more than 5 years. According to Table 1, several features that label the evolution of China’s natural gas import structure can be identified. First, the number of gas-importing sources was increasing steadily, and the geographical location of importing sources kept expanding, which means the diversification strategy of importing sources has shown very good effects. Second, China’s gas dependence on Asian Pacific countries showed a decreasing trend when the importing volume increased, and it is seeking to acquire natural gas from a worldwide perspective. Third, Central Asia has been a very important gas supplier since 2010, when the Central Asia–China gas pipelines were constructed (Hu, 2014). Finally, pipeline gas gradually increases its share in total gas imports, and China is ensuring its external gas supply from both inland and seaborne routes (Hu, 2014; Leung et al., 2014).
Sources of China’s Natural Gas Importation, 2006–2018 (%).

Source. Authors’ calculation based on data from UN Comtrade Database and British Petroleum (2019b).
Gas Infrastructure
Since China’s gas suppliers are located all over the world, the gas freights must be transported to this country through different routes. However, due to the special nature of natural gas in state, there are two kinds of transport carriers for natural gas shipping: seaborne shipment for liquefied natural gas (LNG) and pipeline transport for gaseous natural gas.
In the late 1990s, to deal with the shortage of energy supply in the southeast provinces, the Chinese central government approved the first LNG project (Lin et al., 2010). Finally, China’s first LNG-receiving terminal was put into operation in 2006 and received the first LNG cargo freight from Australia (Tang, 2014). In fact, China has planned to build more than 15 LNG terminals when its first LNG terminal was still in construction (see Table 2). However, due to the rapidly increasing energy price in international energy market, only three terminals were put into operation before 2010 (ARA International Limited, 2015). After 2008, the global economic crisis led to decreasing energy price, which stimulated China’s ambition on LNG importation and infrastructure construction. As of early 2018, 20 LNG terminals have been constructed, and 12 of them have been put into operation, with a total annual capacity of 80 million tons, as shown in Table 3. Besides, another six terminals and several second-phase projects of existing terminals, about 21 million tons of capacity, are still in construction (LNG Industry Information, 2018).
List of China’s Existing LNG Terminals (As of Early 2018).

Source. Authors’ calculation based on data from internet and academic articles. LNG = liquefied natural gas.
Schedule of LNG Project in China (As of Early 2018).

Source. Sun et al. (2016); Shan et al. (2016); LNG Industry Information (2018). LNG = liquefied natural gas.
To deliver the LNG freights to China, the first LNG carrier was put into operation in 2008. By 2014, China only owns six LNG carriers, which were joint ventures between a Chinese shipping company and the BP Shipping (Liu, 2014). When estimated that one conventional LNG carrier can deliver a million tons of LNG in 1 year, China needs at least 40 to 45 LNG carriers every year if the LNG terminals are fully utilized (Liu, 2014). Presently, only a small part of China’s LNG imports is carried by its own LNG carriers, while most of the LNG freights have to rely on the charter market (Zhang et al., 2016).
Another mode for conveying gas imports is pipeline. China has intended to construct gas pipelines to purchase Russia’s natural gas in the Far East since 1994 (Hao & Sun, 2014). However, due to the policy changes of Russia in the 21st century, the negotiations have been hindered by the disputes on gas trade volume and price, pipeline distribution, construction, and operation (Zhang & Bai, 2014). After nearly 20 years of negotiations, the gas deal between Russia and China was finally signed in 2014, which would provide 38 bcm of natural gas to China every year from late 2019 by building a cross-border gas pipeline in Northeast China (Dong et al., 2014; Koch-Weser & Murray, 2014).
In fact, at the same time of gas negotiations with Russia, China has paid great efforts and eventually reached agreements with three Central Asian countries and Myanmar on cross-border gas pipelines. The Central Asia–China gas pipelines were constructed based on Kazakhstan–China oil pipelines, then connected with Uzbekistan and Turkmenistan and were put into operation in 2010 (Fazilov & Chen, 2013; Hancock, 2006). By 2015, Line A, B, and C has already been completed, with a total annual gas capacity of 55 bcm (China National Petroleum Corporation [CNPC], 2014). Besides, the construction of Line D has also been initiated in 2014, with a designed annual deliverability of 30 bcm, routed via Uzbekistan, Tajikistan, and Kyrgyzstan to China and was expected to be completed by the end of 2020 (CNPC, 2014). The Myanmar–China gas pipelines were completed in 2013, which can transport gas produced in Myanmar to China without the restriction of Malacca Strait (H. Zhao, 2012), with an annual gas delivery capacity of 12 bcm (Shan et al., 2016).
Corridors of China’s Natural Gas Importation
Considered China’s gas imports will keep expanding in the near future (Sandalow et al., 2018), the patency and security of corridors for gas importation is of great significance to its energy security and sustainability. Therefore, it requires China to construct diversified, reliable, and secure supply pattern for the increasing natural gas imports.
According to China’s gas-importing sources and gas infrastructure distribution, several corridors for natural gas importation can be identified, as shown in Table 4. It can be found that this country has established both inland and seaborne corridors to keep natural gas supply. For several years, Southeast Asia and Australia are the main sources of China’s external gas supply. In particular, Australia used to be the largest LNG supplier, who provided more than half of gas imports of this country before 2009. From 2010, the Central Asia–China gas pipelines and Myanmar–China pipeline were put into operation one after another, which undertook half of China’s gas imports, increased extra access to external gas supply and opened up a new door for China’s gas importation in the west.
Corridors of China’s Natural Gas Importation.

Source. Authors’ calculation based on data from internet and academic articles.
Identified Risks for China’s Natural Gas Importation
To secure China’s natural gas importation, it is necessary to identify the possible risk factors for the corridors of natural gas importation. In fact, the security of natural gas importation has faced up with various potential risks caused by human and nonhuman factors.
Literature Review
With the increasing demand for natural gas in recent years, the security and reliability of natural gas supply becomes an important issue of concern to the policy makers, especially for the European and East Asian countries, who are the main gas importers in international gas market. Scholars have done intensive work on the security and sustainability of natural gas supply or these regions and states.
Europe is the largest natural gas importer of the world, and European energy security issues concerning natural gas has drawn great attention from scholars and policy makers. Stern (2002) analyzed factors concerning European natural gas supply from a traditional perspective using four indicators: import dependence, relationships with non-European exporting countries, security policy in traditional and liberalized gas markets, and security arrangements in liberalized markets. It is believed that long-term contracts and geopolitical considerations strongly affected European natural gas supply (Percebois, 2008). Pavlović et al. (2018) proposed a robust composite index for measuring natural gas supply security of Croatia, which included energy import dependency index, energy intensity, gross inland consumption, index of national economy dependence on natural gas, Herfindahl–Hirschman Index, and Shannon–Wiener Index.
European Union is extremely relying on external gas supply, so disruption of natural gas supply highlights the threat to energy security and sustainability. From the perspective of contract actions, contract prices and benefits, Abada and Massol (2011) investigated the impact of the uncertainty of natural gas supply disruptions using a static Cournot game model. Based on Monte-Carlo simulation, Praks et al. (2017) assessed the reliability and vulnerability of European gas transmission networks. Geopolitics and international relationships are importing factors leading to disruptions of gas supply, which must be taken into consideration when assessing the security of European gas imports (Lochner & Dieckhöner, 2012). Using a Stackelberg game model, Grais and Zheng (1994) analyzed the impact of relationships among suppliers, transporters, and importers on the security of natural gas importation. Richter and Holz (2015) analyzed the impact of disruptions of natural gas supply from Russia on European countries. It is found that increased deliveries of Russian pipeline gas led to more political risk due to the increased dependence on one supplier, while importing more LNG means more technical and financial risks (Eser et al., 2019). So, it was crucial to improve infrastructure as quickly as possible to ensure an adequate natural gas supply for all European Union member countries (Zeniewski & Bolado-Lavin, 2012).
In order to ensure security of natural gas supply in Europe, some researchers have assessed all kinds of risks for natural gas supply security. Weisser (2007) introduced several risks for European gas supply security, that is, source dependence, transit dependence, facility dependence, structural risks, natural disaster, political blackmail, terrorism, war, and civil unrest. Doukas et al. (2011) also identified seven risks on the security of European gas supply: conflicts, political instability, terrorist attacks, export restriction, accidents, weather conditions, and monopolistic practices. Biresselioglu et al. (2012) constructed a multiobjective programming model, which involved political, economic, and security risks for analyzing Turkey’s LNG security policy.
Asia-Pacific region is another area that is closely connected with international natural gas market for gas supply, and no shortage of researches has been done to investigate the security of natural gas supply in this region. Jun et al. (2009), Manuhutu and Owen (2010), and Vivoda (2014) used the Herfindahl–Hirschman Index to assess the security and risks for Korea, China, and other major LNG-importing countries in the Asia-Pacific region. Cabalu and Manuhutu (2009) examined the vulnerability of eight Asian gas-importing countries using Principal Component Analysis to analyze four market risk indicators (cost of imported gas in national income, gas intensity, gas consumption per capita, and gas share in TPES) and two supply risk indicators (ratio of domestic gas production to consumption and geopolitical risk). Cabalu (2010) also proposed a gas supply security index to evaluate security of natural gas supply in Asia with the indicators of gas intensity, net gas import dependency, ratio of domestic gas production to consumption, and geopolitical risk. By employing the ecological network analysis, Shaikh et al. (2016a) assessed the security of natural gas supplies in the Asia-Pacific region and found that diversification can help improve natural gas supply security.
As the largest gas consumer and importer in this region, China has drawn a great deal of scholars to investigate its natural gas supply. Lu et al. (2016) comprehensively evaluated China’s natural gas supply security that integrated various components, including supply sources, consumption sector, refining, and reserve sectors. Shaikh et al. (2016b) and Shaikh, Ji, and Fan (2017) measured the sustainability and security of China’s natural gas supply through an ecological network analysis. By constructing a mathematical programming model, which considered various aspects of energy security: diversification, lower dependency, supplier export capacity, minimizing the import cost, transport distance, and political instability of the foreign natural gas suppliers, Shaikh, Ji, Fan, Shaikh, et al. (2017) also analyzed the optimal natural gas import scheme for China. Geng et al. (2017) constructed a multiobjective optimization model by considering multiple risk factors: maritime transportation distances, pirate attacks, economic risks of importation, exporting countries’ political risks, and maritime transportation risks, to stimulate the optimal LNG importation portfolio of China. Using the same method, Zhang, Zhong, et al. (2017) considered cost, country risk, shipping risk, and impact of extreme events, to analyze China’s LNG import. Kong et al. (2019) designed an evaluation framework with full consideration of resource risk, political risk, transport risk, price volatility risk, purchasing power risk, and dependence risk, to evaluate the import risks of natural gas for China.
These studies have evaluated the security or risks of natural gas supply and importations in detail. However, some problems still need further discussions. First, most of them are conducted from a perspective of foreign dependence or importing sources, very few of them have considered possible risks in the gas supply chain, and our study can be taken as a contribution to literature by summarizing the risk factors from a supply chain perspective together with Pavlović et al. (2018) and Kong et al. (2019). Second, few researches have analyzed gas importation security by identifying corridors of gas supply and the associated risks. Finally, a lot of researches focused on the overall security of gas importation, and ignored the risks of individual suppliers or transport routes.
Risk Criteria for Corridors of China’s Natural Gas Importation
In order to evaluate the risks for corridors of China’s natural gas importation, we need to select the appropriate risk criteria. To do that, we firstly reviewed the possible criteria in the literature aimed at evaluating security and risks of natural gas supply (see Table 5). Then, taking a perspective of natural gas supply chain, which consists of three stages: external dependence stage, transportation stages, and external supply stages, we filtered and selected risk criteria for each stage. Finally, 11 risk indicators were identified (see Figure 3), which were described more detailed in Table 6.
Summary of Previous Research on Security and Risks of Natural Gas Supply.

Note. TPES = total primary energy supply.
Indicators for the Risks of China’s Natural Gas Transport Routes.

Source. Authors’ summarization based on risk factors in Table 5.
Note. “–” indicates this is a cost-type indicator, which means smaller value represent better effect. “+” indicates benefit-type indicators, which means larger value represents better effect. IMB = International Maritime Bureau, UN = United Nations.
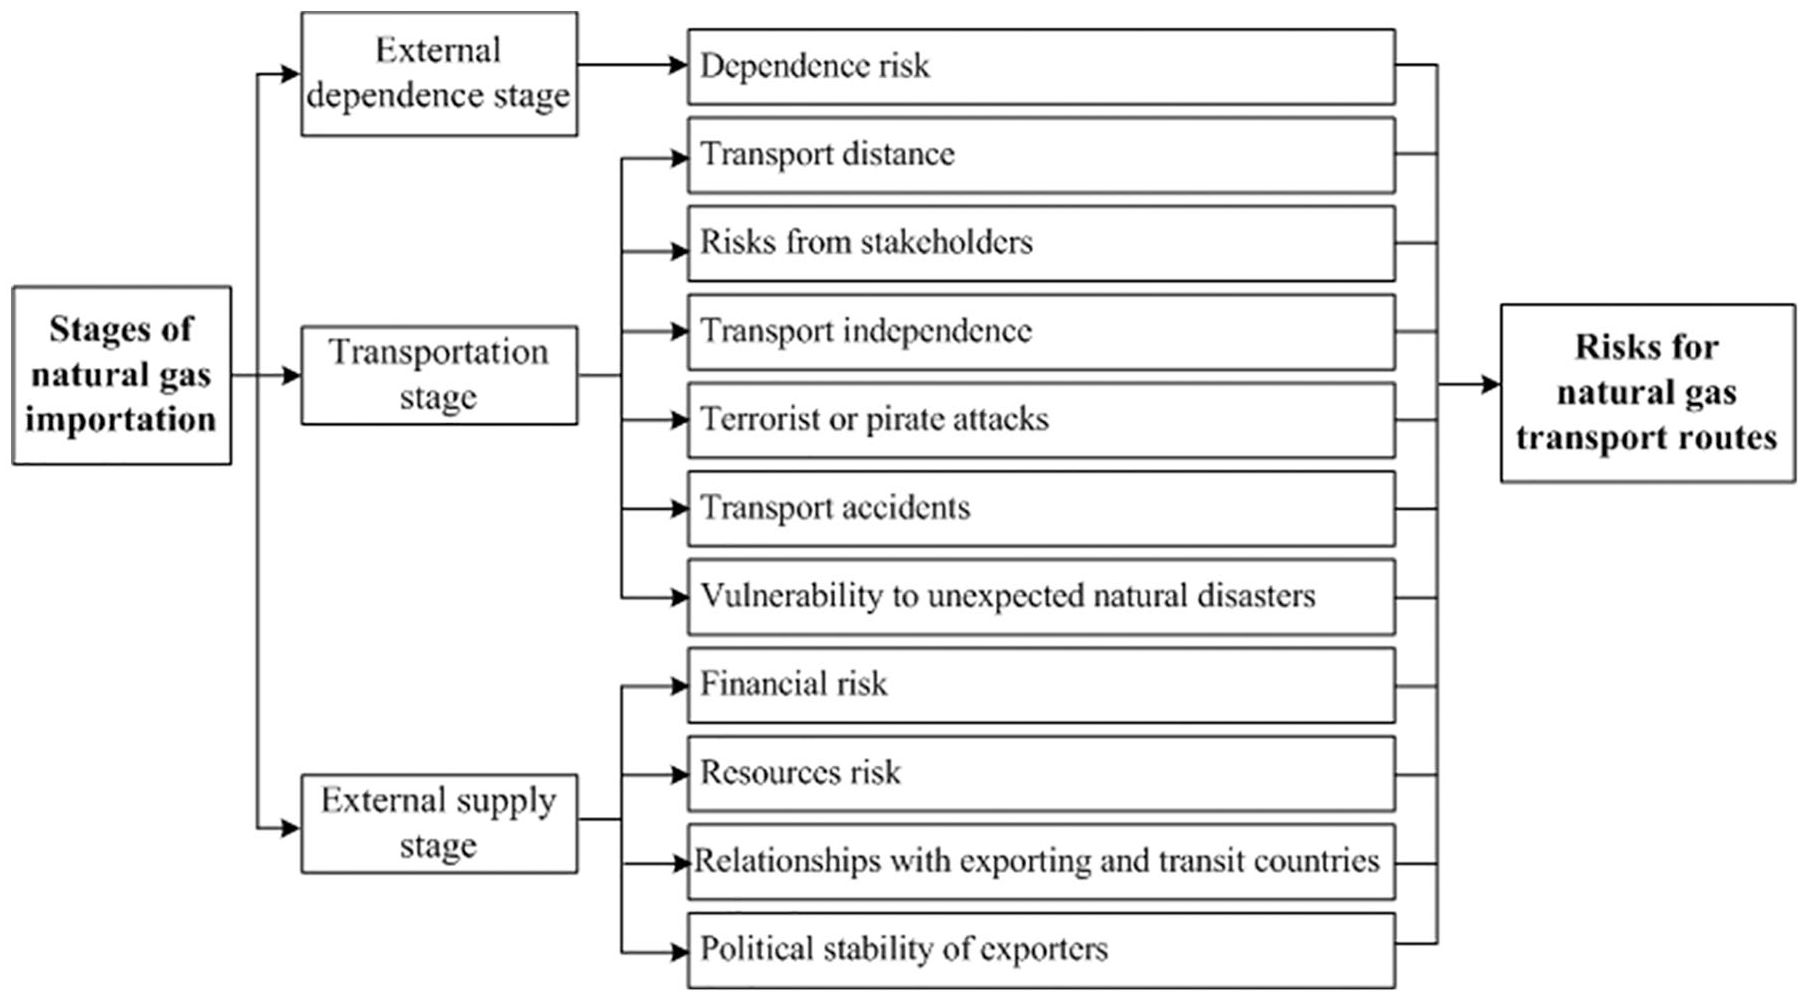
Supply chain and risks for natural gas transport routes.
I1: Dependence risk
At the initial stage of natural gas importation, dependence risk determined the amount of gas importation as well as importer’s degree of dependence on the exporters, which reflects the risks associated with the gas exporters’ monopoly control over importer’s gas imports. This risk indicator is usually measured by the proportion of the net gas imports of suppliers in the gas corridors in importer’s total gas imports (Zhang et al., 2013).
I2: Transport distance
Transport distance is a very important factor that affects the security of natural gas importation and transportation. With longer transport distance, the importer may have a higher probability of encountering various risks, such as meteorological and geological disasters, and pirate attacks, and pay higher prices for long-distance transport.
I3: Risks from stakeholders
Since long-distance gas shipment may pass through the territory of other countries or the chokepoints and some dangerous waters, which will pose additional geopolitical risks. The most typical case is the Russia–Ukraine gas crisis, which lead to the gas supply disruptions in South Eastern Europe (Kovacevic, 2009; Larrabee, 2010). Therefore, it is necessary to consider the risks from stakeholders along the corridors.
I4: Transport independence
Transport carriers are important shipping media for natural gas shipment, and it determined importing country’s flexibility and capacity in natural gas transportation, which can have a neglectable influence on the security of natural gas supply (Villada & Olaya, 2013). The main transport carriers for natural gas are pipelines and LNG carriers. China only owns six LNG carriers, and five of them undertake the LNG conveyance from Australia and Southeast Asia to Guangdong and Fujian (REALIZE, 2018). While, LNG imports of the eastern and northern coastal provinces mainly come from the Middle East, and the transport was carried mainly by leasing LNG carriers. According to the project materials, the Central Asia–China gas pipelines were joint ventured by China and countries along them, and China owns half ownership (Wang et al., 2014). Similarly, CNPC, one of China’s three biggest petroleum companies, has 50.9% of ownership and franchise of Myanmar–China gas pipelines (Li et al., 2013). Although China will not have any ownership in the Russia–China gas pipelines in Russia, it will provide a small part in the financial investment (China News, 2014).
I5: Terrorist or pirate attacks
The risk of terrorist and pirate attacks is another risk factor for cross-border and long-distance gas transport. In recent years, terrorism goes to privilege due to the political changes around the world (Dingley, 2016), and pirate attacks have also become an international threat for marine transport, especially for goods shipments from Somalia to Indonesia (Acciaro & Serra, 2013; Murphy, 2013).
I6: Transport accidents
During the long-distance gas transport, any form of unwilling accidents may happen. No matter for LNG transport, or gas pipelines, accident such as explosions, fire and leaks are the potential risks that may threat the security of gas conveyance. By reviewing major global energy accidents, it is found that piped natural gases (PNGs) are exposed to a higher possibility of leakage, fire, and even explosion than LNG (Burgherr & Hirschberg, 2014; Montiel et al., 1996; Sovacool, 2008), despite that natural gas has the lowest frequency of severe accidents involving fatalities among various fossil fuels (Hirschberg et al., 2004).
I7: Vulnerability to unexpected natural disasters
Due to that gas pipelines and LNG shipping routes may go through different orographic and weather conditions, and these natural factors may cause various natural disasters, such as hurricanes, earthquakes, extreme temperature, and other physical phenomena, which may lead to the interruption of gas supply (Doukas et al., 2011).
I8: Financial risk
The price formation mechanism of natural gas is so complicated, especially for LNG, and a lot of factors may lead to the variation of LNG prices. Usually, LNG price is closely related to global oil market (Brown & Yucel, 2008), which means is may experience greater price fluctuations (Caldara et al., 2019; Yao & Kuang, 2019). While PNG price is usually determined through a negotiation mechanism (Dastan, 2018; Shnyakina & Sun, 2018). In fact, economic cost can be a factor with great significance in gas negotiation and contract (Geng & Ji, 2014). The gas negotiation between China and Russia lasted for 20 years, for which an important reason is that they could not reach an agreement on gas price and the distribution of gas pipelines (Zhao, 2014).
I9: Resource risk
During the past year of 2018, global gas consumption has increased by 195 billion bcm, or 5.3% on 2017 level, which is one of the fastest growth rates since 1984 (British Petroleum, 2019b). With the continuously increasing gas consumption and fierce gas market competition, the availability and accessibility of gas resources may experience great challenges and threats (Kong et al., 2019). This risk indicator can be estimated by reserve to production ratio of gas suppliers in the transport corridor (Kong et al., 2019).
I10: Relationships with exporting and transit countries
Traditionally, energy policy usually focuses on market liberalization, competition, and climate targets, while ignores the hindering effect of geopolitical logic, which can underplay the important economic, technical, and security challenges (Siddi, 2019). The economic and political relationship between gas supplier and importer is of great significance to the stability of natural gas importation, as well as the relationship with the transit countries (Shaffer, 2013). Therefore, energy has always been an import topic in China’s foreign policy and affairs (Medeiros & Fravel, 2003; Ziegler, 2006).
I11: Political stability of exporters
The political changes of gas suppliers can also lead to instability and interruption of gas supply (Flouri et al., 2015; Shaffer, 2013). Especially that most of world’s large energy suppliers are located in Middle East, Africa, and Central America, which is vulnerable to political instability and military conflicts.
Data and Methodology
Data Description
After determining the risk indicators for China’s corridors of natural gas importation, the data for the two seaborne LNG corridors and three pipeline corridors with respect to the 11 risk indicators are collected, as shown in Table 7.
Data for Corridors of China’s Natural Gas Importation With Respect to the Indicators.

Note. Price for LNG is calculated based on the data for 2017 from UN Comtrade Database, while the price for PNG is estimated based on the deal price. LNG = liquefied natural gas, UN = United Nations.
There is something about the data that need to be explained. First, the distance of gas pipelines counts in both foreign and domestic pipelines that need to be newly constructed. While, when collecting the data for ownership over these pipelines, only the pipelines in foreign countries are counted. Second, the distance of Middle East–China LNG transport route is calculated from Doha Port in Qatar to Shanghai Port in China, while that of Australia/Southeast Asia–China is calculated from Darwin Port in Australia to Shenzhen Port in China; the ownership over LNG carriers is also calculated based on the situation of LNG carriers and terminals. Third, when collecting the data with respect to terrorist or pirate attacks (I5), transport accidents (I6), and vulnerability to unexpected natural disasters (I7), relationships with exporting and transit countries (I10), these risk indicators are rated based on related reports and workshop discussions. Finally, since the Russia–China gas pipeline will not be in operation until 2020, the volume of PNG imported from Russia through this corridor is estimated by its capacity, which almost equals to the PNG volume imported from Turkmenistan in 2018, so we will use this volume number to measure the dependence risk.
To assess the risk of China’s corridors of natural gas importation, 11 risk indicators have been selected. Obviously, this is a multiattribute decision-making problem with uncertainty and ambiguity (Zhang et al., 2018), and we need to determine the weight for the risk indicators, and derive a composite risk index for the evaluation (Biresselioglu et al., 2012; Cabalu, 2010; Cabalu & Manuhutu, 2009; Geng et al., 2017; Kong et al., 2019; Lochner & Dieckhöner, 2012; Pavlović et al., 2018; Shaikh, Ji, & Fan, 2017; Zhang, Zhong, et al., 2017). Multicriteria decision-making methods are thought to be the most appropriate techniques for evaluating the risks in energy supply and planning (Rostamzadeh et al., 2018). By taking the multicriteria decision-making methods, Ervural et al. (2018) used ANP and Fuzzy TOPSIS to analyze Turkey’s energy planning. Liu and Wei (2018) also evaluate the risks in electric vehicle charging infrastructure projects using Fuzzy TOPSIS. Solangi et al. (2019) prioritized the renewable energy sources in Pakistan with an integrated Delphi-AHP and Fuzzy TOPSIS approach.
Therefore, we also used a hybrid multicriteria decision-making model to evaluate the risks of China’s five corridors of natural gas importation. In detail, Fuzzy AHP was usually used to determine the weight of indicators (Hwang & Yoon, 1981; Zhang, Yu, et al., 2017), and the method of TOPSIS was utilized to rank or prioritize the alternatives (Azimi et al., 2011; Ren & Lützen, 2015). Here in our research, these two methods would be combined to assess the risk status of China’s five corridors of natural gas importation.
Methods
Fuzzy AHP
Fuzzy AHP is an effective way to determine the weight of criteria and indicators (Ren & Lützen, 2015). Before conducting Fuzzy AHP, a hierarchy structure model should be developed to define the decision problem first. In this article, the hierarchy model for the security of China’s natural gas importation is as shown in Figure 3. In this hierarchy model, the top level defines the overall goal of this assessment, which is the risk status of China’s natural gas importation, the second level describes the three stages of China’s natural gas importation, and the bottom level identifies the specific risk indicators in each stage.
The procedure of fuzzy AHP is as follows:
Step 1: Making pairwise comparisons for the indicators according to their relative importance with respect to the upper-level factor using fuzzy numbers (as shown in Table 8).
The Linguistic Terms and Corresponding Fuzzy Scales.

Source. Ren and Sovacool (2014); Zhang et al. (2018).
Step 2: Establishing the comparison matrix based on pairwise comparison in Step 1. Here we assume that a total of n criteria are included in the decision unit, with the

where
Step 3: Computing the value of fuzzy synthetic extent with respect to the

where


Noting that
Step 3: Calculating the degree of possibility of

Step 4: Determining the possibility matrix, which is used to describe the relative significance of each pair of criteria using the corresponding value of their fuzzy synthetic extent as shown in Equation (6).

Step 5: Obtaining the degree of possibility for the fuzzy synthetic extent with respect to each criterion to be greater than that for all the other criteria. For instance, the degree of possibility for the fuzzy synthetic extent with respect the ith criterion is greater than that with respect to all the other criteria can be defined as follows:

where
Assume that

Step 6: Normalizing the weight vectors, which is

where

TOPSIS
TOPSIS prioritizes the alternatives by relying on the Euclidean distance between the evaluation objects and the positive or negative ideal solutions, and the procedure of conducting TOPSIS is as following:
Step 1: To facilitate the aggregation of these indicators, it is necessary to perform data normalization. The benefit-type indicators should be normalized by Equation (11), and the cost-type indicators should be normalized by Equation (12).


where pij is the normalized value of the ith gas transport corridor with respect to the jth indicator, xij represents the original value of the ith gas transport corridor with respect to the jth indicator, and max xj and min xj are the maximum and minimum value of the corridors of China’s gas importation with respect to the
Step 2: Computing the weighted normalized decision matrix

Step 3: Selecting the maximum and minimum x′ij for each indicator in matrix Z, then the positive and negative ideal solutions,
Step 4: Calculating


Step 5: Obtaining the proximity of the evaluating objects to the ideal solutions according to Equation (16), and the smaller value of the proximity indicates better performance. In this article, the proximity value represents the closeness of the alternative to the positive ideal solution, and the greater value means further distance from the positive ideal solution, which can also be seen as higher risks. Therefore, we use this proximity value as the Risk Index of China’s corridors of natural gas importation, which is within the range of 0 to 1.

Analysis and Results
With the indicators and their data with respect to the risk indicators of China’s corridors of natural gas importation presented in Table 7 and Figure 3, we use linguistic terms and the corresponding fuzzy numbers (see Table 8) to make pairwise comparisons for the three stages of natural gas importation as well as the risk indicators in each stage through a workshop discussion based on literature review and judgment of expert group on the topic (Ren & Sovacool, 2014). The fuzzy judgment matrix with respect to the overall goal and the three stages are as following:


In order to help understand the process of Fuzzy AHP, we took the weight calculation of the three stages as an example.
The pairwise comparison of the three stages is shown in the fuzzy judgment matrix A. Then the value of fuzzy synthetic extent with respect to the three stages can be derived by Equations (2) to (4) as follows:


Then, the value of possibility of
According to Equations (7) and (8), the weight vector can be determined as
Taking the same procedure, the weight vector of the risk indicators with respect to the three stages can also be determined. Then, the global weight of each risk indicators can be derived, as shown in Table 9.
The Weight of the Risk Indicators Derived by Fuzzy AHP.

AHP = analytic hierarchy process.
With the global weight of indicators determined, we can apply the method of TOPSIS to conduct the risk assessment of China’s corridors of natural gas importation. By Equations (11) to (13), the weighted normalized decision matrix as well as the positive and negative ideal solutions can be derived, as listed in Table 10. With Equations (14) to (16), the positive and negative Euclidean distances can be calculated, as well as the proximity of each corridor to the ideal solutions, and the results were presented in Table 11.
Weighted Normalized Decision Matrix and the Positive/Negative Ideal Solutions.

Positive and Negative Euclidean Distances and the Proximity of Each Corridor.

As mentioned previously, the Risk Index of China’s corridors of natural gas importation can be represented by the proximity value of each alternative. Therefore, we have derived the Risk Index of China’s five corridors of natural gas importation, and the results were presented in Figure 4. It indicates a mid-level security for China’s natural gas importation, with an average Risk Index of no more than 0.47. To be specific, the gas pipelines from Central Asia are the most secure and reliable natural gas import routes for this country, followed by the gas pipelines from Myanmar and Russia. Comparatively, China’s seaborne LNG corridors seem to be riskier than inland corridors of natural gas pipelines. Especially, the seaborne LNG corridor from Middle East and North Africa is experiencing a Risk Index of 0.65, which is much higher than other corridors, while the seaborne LNG shipping route from Australia and Southeast Asia has a medium security level with a Risk Index of 0.48.
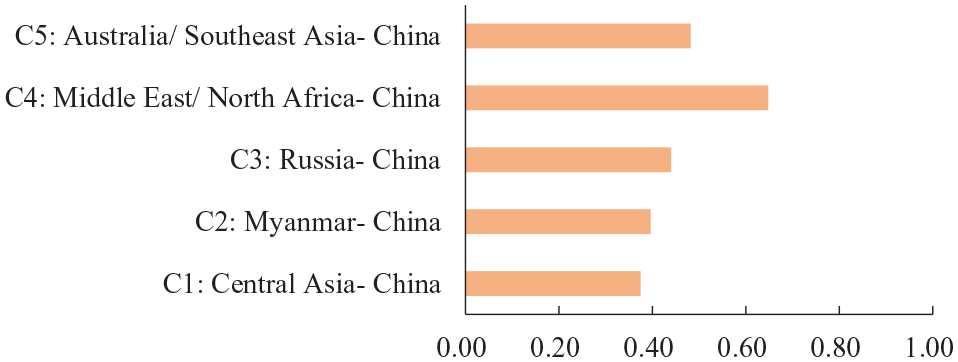
Risk Index of China’s corridors of natural gas importation.
Central Asia–China gas pipelines are the most reliable gas import corridor for China, with a Risk Index of 0.3750. Central Asia is among the largest natural gas producers and exporters of the world. In fact, Turkmenistan, Kazakhstan, and Uzbekistan, three major Central Asia Countries, are home to more than 20 trillion cubic meters of proved gas reserves, which almost equals that in Qatar, and six time of that in China. The relationship between Central Asia and China can date back to the Silk Road that established about 2000 years ago (Christian, 2000). In modern time, China has established diplomatic relationships with Central Asian countries when the Soviet Union collapsed in the 1990s. After that, China kept and enlarged its cooperation with them in economic integration and fight against separatism, terrorism, and extremism (Chung, 2004; Wu & Chen, 2004). China has built oil pipelines from Kazakhstan in 2006, whose capacity has been expanded in 2009 (Liao, 2006). However, China did not stop paying efforts in “energy diplomacy” within this region, and planned to establish four gas pipelines to connect the gas fields in Turkmenistan with gas pipeline networks in China, which can deliver at most 85 bcm of natural gas to China every year. Since the Central Asia–China gas pipelines in this region are half owned by China, which can help to keep a close economic and political relationship, this corridor is considered to contribute the most to China’s energy security. However, this gas import corridor also confronts several barriers. First, the main gas supplier in this region, Turkmenistan, is far away from China, and the gas pipelines have to go through almost the five countries in this region, which increases the financial risks in pipeline construction and transit fees (Sovacool, 2009). Second, this region, together with Xinjiang Uygur Autonomous Region of China, is facing risks from separatists and Turkism, which may affect the transport security of natural gas along the pipelines (Kerr & Laura, 2008).
The Myanmar–China pipeline is built to open China’s access to natural gas import from the southwest, and the analysis indicates that this is a gas import corridor with moderate proximity value at 0.3964. This gas corridor has some advantages that distinguish it from other gas pipelines of China. First, China has invested on both gas fields’ production and pipelines construction in Myanmar, which means China has ownership over these assets, which can protect gas supply in this region. Second, this corridor goes through Myanmar to China directly without passing through the third country or region, which means less diplomatic and economic risks. However, after several years of operation, this pipeline is criticized for its high costs and political risks in Myanmar. On one hand, the gas fields in Myanmar cannot keep a stable and sufficient gas production due to its political instability and poor economic conditions (Li et al., 2013), and the gas price is about 70% higher than that from Turkmenistan. On the other hand, the other end of gas pipelines is the Southwest China, where natural gas infrastructures and market is really insufficient (Jiang, 2014; Zhai, 2014). However, the biggest threat is still the political risks in Myanmar. China has signed the gas contract with the former military government in Myanmar at the dawn of 21st century. However, when the national power was transferred to the new government in 2010, several projects invested by foreign companies were shelved by the new president, including the Myitsone hydropower project (Y. Sun, 2012; Turnell, 2011). Besides, the gas fields and docks can be influenced by local religious conflicts, and the pipelines have to go across the northern part of Myanmar, which is still in civil war (Y. Sun, 2012). Another potential risk for this corridor is that the pipelines must go through the mountains in southwest China, which makes the pipelines more expensive and vulnerable to storms, landslides, and earthquakes (W. D. Wang et al., 2009).
Russia can be a reliable gas supplier for China, with a Risk index of 0.4403. Russia has been proved to be home to the richest natural gas reserves and the largest natural gas exporter of the world. In fact, China has planned to establish gas pipelines from Russia to China since 1990s. However, their negotiation on the route and price has never reached an agreement until 2014, when CNPC, the largest oil and gas company in China, signed a 30-year, 400 billion USD and annual 38 bcm of natural gas deal with Russian energy giant, Gazprom (Weitz, 2014). To complete the gas delivery, Russia will build a gas pipeline, named Power of Siberia, from its Kovyktin and Chayandin fields in eastern Siberia to the eastern Sino-Russian border, about 1800 km (Koch-Weser & Murray, 2014). China will extend it through northeast China to the Beijing–Tianjin–Hebei metropolitan area in the north of China and the Yangtze River Delta in the east (Weitz, 2014). This is a reliable gas import corridor, because it does not involve the third party, and these two countries kept a tight economic and political communication and peaceful borders in recent decades (Hitt et al., 2004). The shortages for this corridor lie in two points. First, more than 3,000 km of pipelines need to be newly established, and most of them will go through the freezing cold Siberia, where frozen soil and low temperature may have some influence on the security of gas pipelines and shipment. Second, compared with other cross-border gas pipelines, China does not have any ownership over the pipelines in Russia, which may make it compromise to Russia in the future gas negotiations.
As to seaborne LNG imports, Australia, Malaysia, and Indonesia used to be China’s main gas suppliers before it imported pipeline gas from Central Asia. In fact, these three countries are also among the largest LNG exporters of the world. Compared with other LNG exporters, they have adequate LNG that can be shipped to China by traveling a much shorter distance. The shortest distance between China Mainland and Australia is about 3,900 km, from the Darwin Port in the northern Australia to Shenzhen Port in Southeast China. Another advantage is that these counties have a very close economic relationship with China. In fact, according to data from UN Comtrade, China has become their largest business partner during the past several years, and the close economic communication can enhance their cooperation in LNG trade. The risks of this corridor mainly come from geopolitics. Although it does not need to pass through the Malacca Strait, the territorial disputes in South China Sea in recent years may produce some influence on the security of freight shipment in this area (BBC, 2016). Besides, as one of the world’s busiest international trade routes, South China Sea and the waters near Indonesia and Philippines are also the most dangerous seas of the world with large amount of pirate attacks (Acharya et al., 2015; Graham, 2015). In addition, storms, hurricanes, and running around in the ocean can also bring great potential risks to the security of seaborne LNG transport (Dillon, 2015).
Compared with other corridors of natural gas importation, the route of LNG shipment from Middle East and North Africa to China is the least secure one, mainly due to the long shipping distance. The long transport distance has caused several barriers to the security of natural gas importation and shipment. The first one is high shipping costs. For example, the average landed prices of China’s importing LNG from Australia and Qatar are 0.19 and 0.93 USD/kg, respectively. However, since LNG price is linked to international crude oil market, it is obvious that the huge difference in final costs is caused by the shipping and insurance costs (Maxwell & Zhu, 2011). Second, the long shipping distance means passing through more transit countries and dangerous waters, and made it more vulnerable to offshore natural disasters. Third, the Middle East and North Africa is confronted with great geopolitical risks, and the Somali piracy along this route has brought additional risks (Caldara & Iacoviello, 2016; Malik, 2015). Finally, China’s gas companies only own a small number of LNG carriers, and most of them are used to deliver LNG imports in Asian Pacific regions (China Daily, 2018), so the LNG shipment from Middle East has to rent foreign LNG carriers, which brings extra expenses and risks from supply disruption.
Conclusions and Discussions
Many risks and factors may affect the security of China’s corridors of natural gas importation. In this article, it introduced the situation and trends of China’s natural gas consumption and importation, and identified five main corridors of China’s gas importation. Then, from a perspective of natural gas supply chain, it divided the process of natural gas importation into three stages: external dependence stage, transport stage, and external supply stage, and proposed 11 indicators that reflect the potential risks in China’s natural gas importation. After that, it aggregated these indicators into a Risk Index for evaluating China’s five corridors of natural gas importation with the hybrid model of Fuzzy AHP and TOPSIS. From which, we can draw some conclusions.
First, among these risk indicators, transport distance is the major obstacle for China to enhance its reliable and sustainable natural gas importation, followed by risk from stakeholders, resources risk, and political stability of gas suppliers. While, transport independence and financial cost seem to have limited influence on the risks of China’s natural gas importation. To reduce this risks of China’s natural gas importation effectively, regional political and economic cooperation is needed for China to build a friendly environment to acquire natural gas from Central Asia and Southeast Asia under the initiative of Belt and Road (Huang, 2016; Summers, 2016), and the Central Asia gas pipelines are one of the main achievements of this initiative. However, in Middle East and North Africa, China has proved its economic influence, but cannot exert crucial influence on regional political conflicts, although it has paid great efforts on keeping regional peace, managing conflicts, and seeking regional security (Chaziza, 2018).
Second, a relative secure situation has been observed for China’s natural gas importation, and the pipeline gas corridors are more secure and reliable access for China to convey its natural gas importation than the seaborne LNG shipment. To be specific, Central Asia–China gas pipelines are thought to be the most reliable and secure corridor for natural gas importation of China, and the close political and economic relationships between them also enhanced its role in ensuring China’s natural gas importation. The construction of Myanmar–China gas pipelines is more like a strategic consideration, which can provide China another access to external energy supply with much shorter transport distance. However, due to the instability of gas production and geographical barriers, this corridor is challenged and questioned by the high gas price and limited gas delivery. The Russia–China gas pipelines has experienced a long and difficult negotiation and are expected to deliver gas from late 2019, then reaching full capacity of 38 bcm by 2025. Russia owns about 20% of global natural gas reserves and could be a reliable and stable gas supplier of China, while the low temperature and frozen soil brings potential risks to the construction and operation of gas pipelines. The LNG corridor from Australia, Indonesia, and Malaysia can provide China with large amount of affordable LNG through a relatively short shipping route. While, the biggest threat to this corridor is the potential geopolitical conflicts and piracy attacks in South China Sea and nearby waters. Another seaborne corridor, the LNG shipping route from Middle East and North Africa to China has the worst security performance due to the long shipping distance and complex geopolitical factors in Persian Gulf and South China Sea as well as the rampant piracy attacks.
In addition, the diversification strategy of China’s energy policy has been proved successful. The importation of natural gas in China started from 2006, with a gas import volume of 1 bcm, which has grown up to 121.3 bcm by 2018, and made China the largest natural gas–importing country of the world (British Petroleum, 2019b). With the rapid growth of natural gas imports, more countries have been listed as external gas suppliers of China (as shown in Table 1), and gas supply structure has become more diversified. However, it seems that China is overwhelmingly dependent on the gas supply from Turkmenistan and Australia, which accounts for more than 55% of China’s total gas imports. With the completion and operation of Russia–China gas pipelines and Line D of Central Asia–China gas pipelines in the near future, Turkmenistan, Russia, and Australia are expected to provide over 75% of gas imports of China. Therefore, a balanced strategy is suggested to help reduce the risks of China’s external gas supply. There are also some other sources that provide natural gas to China, that is, Equatorial Guinea, Nigeria, and Angola in eastern Africa, and Trinidad and Tobago in Latin America. However, these sources faced up with great risks in transport distance, political instability, resource endowment, geopolitical risks, and other risk aspects.
To open up new gas corridor, China turned to the Arctic Ocean for gas acquisition. A geological-based assessment of the Arctic Circle conducted by the U.S. Geological Survey indicates that about 30% of the world’s undiscovered gas and 13% of undiscovered oil may be found there (Gautier et al., 2009). With global warming, resource exploitation in Arctic regions become economically and technically feasible, and the Arctic sea lanes opening up for longer and longer periods each year. In 2018, the first LNG cargo has been shipped to China from Yamal LNG project Russian Arctic region via the Northern Sea Route (Duran, 2018). Which means China has opened up a new gas corridor from Europe and the Arctic, which can deliver the LNG imports from Norway and other Arctic LNG projects to China more efficiently. Although this LNG corridor has short transport distance, resource abundance, no threat from piracy attacks, and less geopolitical risks, it is still criticized for lack of infrastructure, harsh natural environment, and threats from the floating ices and icebergs (Borch et al., 2016; Ghosh & Rubly, 2015). Besides, development of resources and navigation may accelerate the degradation of Arctic environment (Shapovalova, 2019). Anyway, the LNG corridor through the Arctic has great potential for enhancing the security of China’s natural gas importation but still faces issues in international legal system, icebreaking LNG carriers, and challenges of harsh natural conditions.
Finally, it is urgent to further develop and improve the gas pipeline networks, LNG terminals, natural gas storages, and other gas infrastructures, and enhancing the peak-shaving capacity and flexibility to natural gas supply networks. With the rapid increase of China’s demand for natural gas, the natural gas infrastructure has been improved greatly. Before 2016, the natural gas supply in China is adequate for the demand, and the capacity of the infrastructure for importing natural gas has not been fully utilized (Shan et al., 2016). In particular, the utilization rate of LNG terminals in 2015 has dropped to 47.7%, the utilization of Central Asia–China gas pipelines is also less than 50%, and that of Myanmar–China pipelines even bellows 15%, mainly because the steady growth rate of natural gas demand is slower than that of capacity of pipelines and LNG terminals (Chinabaogao, 2018). However, large-scale gas shortage has been experienced in China in the following years. Due to policy of energy structure adjustment and emission reduction, natural gas consumption was encouraged (NDRC and NEA of China, 2016). Gas consumption in chemistry industry, electricity generation, and industrial fuels grew rapidly. In addition, the rapid urbanization and the project of shifting coal to gas also led to the surging demand for natural gas demand, and vehicles and ships powered by LNG has also been encouraged. The soaring demand for natural gas magnified the shortage of gas supply and lack of peaking–shaving capacity of China’s natural gas supply network in winter. Therefore, it is really a top priority for China to complete its domestic gas pipeline networks and the gas storage infrastructures.
Footnotes
Acknowledgements
The authors are grateful to editors and anonymous referees for their very valuable comments and suggestions, which have significantly helped improve the quality of this paper.
Declaration of Conflicting Interests
The author(s) declared no potential conflicts of interest with respect to the research, authorship, and/or publication of this article.
Funding
The author(s) disclosed receipt of the following financial support for the research, authorship, and/or publication of this article: This research was funded by the Key R&D and Promotion Project (Soft Science Research) in Henan Province, China (grant no. 202400410068), the tendering project of Government Decision-Making Research in Henan Province (grant no. 2018B132), the Key Scientific Research Project of Colleges and Universities in Henan Province, China (grant no. 19A790020), and the Nanhu Scholars Program for Young Scholars of XYNU.