
Abstract
The objective of this study is to calculate and analyze the factors that determine household carbon emissions in Vietnam. The study uses a multivariate regression analysis model including variables related to household characteristics and characteristics of the household head based on data from the results of the 2020 Vietnamese household living standards survey conducted by the Vietnam General Statistics Office every 2 years. Carbon emissions or carbon footprint are estimated using a combination of emission factors collected from EPA, EXIOBASE, WRAP. Research results have shown that factors that positively impact total household spending will also positively impact the household’s carbon footprint and vice versa. Specifically, factors including income, household size, house area and number of cars have a positive impact on the household’s carbon footprint. Conversely, the age of the household head tends to shrink a household’s carbon footprint. In addition, households living in urban areas have a larger carbon footprint than households living in rural areas; Households living in apartments have a larger carbon footprint than households living in private houses; Male-headed households will generate larger CO2 emissions than female-headed households; Finally, households whose head of household has an education level higher than high school level will generate larger emissions than households whose head’s education level is higher than high school level or less. At the same time, the study proposes a number of recommendations and solutions to reduce carbon emissions, contributing to changing the amount of emissions causing the greenhouse effect.
Introduction
The relationship between climate change and CO2 emissions is one of the biggest challenges facing humanity today, requiring global cooperation to solve. The reason why climate change is becoming more and more complicated is because greenhouse gas (GHG) emissions are constantly increasing over time in countries around the world (IPCC, 2021). Therefore, countries need to reduce GHG emissions, mainly carbon emissions, which account for the majority on a global scale in consumption and production activities (Fischedick et al., 2014). Consumption activities stemming from household needs, from purchasing goods and services to energy use, affect carbon emissions (Tukker & Jansen, 2006). In other words, household consumption patterns (food, housing, travel, services, and tangible goods) contribute to climate change (Salo et al., 2021). Therefore, analyzing the factors that influence household consumption and carbon emissions is very important for designing policies to reduce GHG emissions.
According to a report by the World Bank Group (2022), Vietnam contributes 0.8% to total global GHG emissions, and per capita emissions in Vietnam are still less than half of those in other countries OECD organization. Although economic growth in Vietnam is rapid, this also entails a significant increase in per capita GHG emissions. From 2000 to 2018, this number increased fourfold and Vietnam now leads the world in the rate of increase in emissions. The report also points out that, in 2020, Vietnam suffered losses of about 10 billion USD, accounting for 3.2% of GDP, due to the effects of climate change. The report shows the need to prioritize investment to respond to the impacts of climate change.
Currently, many countries are having difficulty balancing economic growth and environmental protection, especially developing countries, including Vietnam. According to the National Report on Climate and Development, in 2020, Vietnam suffered losses of about 10 billion USD, accounting for about 3.2% of GDP, due to the serious impacts of climate change. The report also shows that although Vietnam’s contribution to total global GHG emissions is at 0.8%, GHG emissions per capita are increasing at the fastest rate in the world. From 0.79 tons of CO2 equivalent in 2000 increased to 3.81 tons of CO2 in 2018 (World Bank, 2022).
Realizing that controlling greenhouse gas emissions is becoming increasingly important, Vietnam has committed to achieving a net-zero emissions target by 2050 at the United Nations Climate Change Summit (COP26) in November 2021. This is an important step forward in Vietnam’s efforts to cope with climate change and promote sustainable development. There have been many research articles such as Agarwal et al. (2022) and Bui Duc, M, (2024) analyzing opportunities to reduce emissions in Vietnam’s economic production sectors, but there is no research on the consumption aspect of Vietnamese households. At the same time, in recent years, there have been many studies analyzing the carbon footprint of household spending in developed countries but very few studies in developing countries (Saras & Kristanto, 2021; Seriño & Klasen, 2015). Therefore, the study analyzing carbon emissions/carbon footprint of Vietnamese household consumption expenditure contributes to a more comprehensive assessment of the emission reduction strategy for the case of Vietnam.
What’s special about this study is that, in addition to estimating Vietnam’s carbon emissions, the study focuses on examining the spatial characteristics of Vietnamese households, including interactions between regions, areas, and urban form in the analytical model. This affects policy outcomes and conclusions regarding the role of these spatial characteristics. Next is the group of variables on socio-economic characteristics of the household including total income, type of housing, and number of personal vehicles that affect spending patterns, even when controlled. The impact of education through the educational level of the household head. Specific demographic characteristics of the household head include age, gender, marital status, and occupational status of the household head. The findings on the selection of these groups of variables, as well as the related policy conclusions, contribute to the discussion on how to analyze household consumption and carbon emissions/CF-carbon footprints.
Literature Review
Carbon Footprint
The term “Carbon footprint” has become popular in the context of increasing awareness of climate change and its impacts. Before the research of Wiedmann and Minx (2008), the academic concept of Carbon footprint had not been clearly defined and measurements had not yet reached consensus. Therefore, Wiedmann and Minx (2008) proposed the following definition for the term “carbon footprint” as a measure of the total amount of CO2 emitted directly and indirectly by an activity or cumulatively through the lifecycle stages of a product. This includes the activities of individuals, communities, companies, organizations, processes, industrial sectors, … Products include goods and services. In all cases, all direct (onsite, internal) and indirect (offsite, offsite, integrated, upstream, downstream) emissions should be considered.
Similar to Wiedmann (2009a) Carbon footprint is defined as the total GHG emissions in terms of CO2 emissions arising from the production and consumption chain of a good or service. Wiedmann emphasizes the importance of estimating Carbon footprint over the entire product life cycle.
Thus, the study of Wiedmann and Minx (2008) plays an important role in clarifying the definition of Carbon footprint as the total amount of GHGs emitted directly and indirectly from an individual, organization, event or product. The authors not only provide a unified definition of Carbon footprint but also provide a theoretical basis of Carbon footprint for empirical research.
Measure/Calculate/Estimate Carbon Footprint
Since the carbon footprint appeared, the academic world has considered it as the basis for calculating greenhouse gas emissions in general and carbon emissions in particular, aiming to reduce greenhouse gas emissions (Wiedmann, 2009a). When calculating carbon emissions/ carbon footprint, there is a distinction between direct and indirect emissions (Xi, 2023). Calculating direct and indirect CO2 emissions depends on the manner and source of emissions from consumer products. For products that use fossil fuels, such as cars, heaters, and combustion appliances, CO2 is emitted directly during use. For other products such as food, clothing, home furniture, … CO2 emissions do not occur directly during use but during production, transportation, and distribution. Therefore, these emissions are accounted for indirectly because they do not occur at the point of final use but in the supply chain.
Compared to direct emissions, indirect emissions are more complicated to calculate. Two popular methods for calculating indirect emissions while assessing the impact of consumer products on the environment are LCA (Life Cycle Assessment) process-based approach and IOT (Input - Output Analysis) input—output analysis (Wiedmann, 2009b). The LCA method comprehensively analyzes the environmental impacts of a product or service from raw material extraction to waste disposal. Meanwhile, the IOT analytical method is based on economic input—output tables to evaluate the environmental impact of economic activities. Therefore, environmentally extended input—output analysis (EEIOA) has the advantage of being able to assess the environmental impact of the entire economy and avoid common limitations (Steen-Olsen, 2016). However, both LCA and IOA methods have their own advantages and disadvantages, and which method to choose depends on the goals and scope of the research. Therefore, when calculating carbon emissions at the national level, researchers often use the EEIOA method (Wiedmann, 2009b). This is also a popular method that has proven to be the most suitable for consumer spending analysis and policy makers.
In recent years, a number of global multiregional input - output (MRIO) databases have been released (Minx et al., 2009; Steen-Olsen, 2016; Tukker & Dietzenbacher, 2013; Wiedmann, 2009a). This is a standard analytical framework for linking these databases with detailed household expenditure surveys regularly conducted by national statistical agencies, so it has the potential to provide analysts around the world a powerful tool for deeper analysis of carbon footprints as well as carbon emissions in countries (Druckman & Jackson, 2009; Feng et al., 2021; Ivanova et al., 2016; Steen-Olsen, 2016). Based on the calculation of carbon emissions/carbon footprints (CF) of countries, researchers simultaneously analyzed the factors affecting carbon emissions/CF. The researchers selected groups of spatial, economic, social, and demographic variables to explain variation and their contribution to household carbon emissions (Feng et al., 2011; Lee et al., 2021; Seriño & Klasen, 2015; Saras & Kristanto, 2021). Understanding the differences and contributions explained by these factors can help determine climate change responsibility and develop emission reduction strategies on the part of consumers across countries.
Factors Affecting the Carbon Footprint of Household Consumption Expenditure
Income
Income is considered the leading determinant in determining households’ carbon emissions. High-income households tend to consume more, especially in sectors such as energy, transportation, and luxury goods, leading to higher carbon emissions (Baiocchi et al., 2010; Büchs & Schnepf, 2013a; Weber & Matthews, 2008;). Studies (Büchs & Schnepf, 2013a; Büchs & Schnepf, 2013b; Druckman & Jackson, 2009) are consistent in showing that income inequality leads to carbon footprint inequality, with households wealthy families contribute a larger proportion to total CO2 emissions. Therefore, carbon reduction policies need to pay special attention to high-income households (Steen-Olsen et al., 2016), to limit emissions growth and promote consumption choices more sustainable.
Research hypothesis 1 (H1): Income has a positive impact on carbon emissions (Carbon footprint).
Living Area
Living area or geographical location is an important factor affecting the carbon emissions of households. Studies show that urban areas typically have higher carbon footprints than rural areas. The results were observed in studies focusing on developed countries such as the United Kingdom, the United States, and Germany (Baiocchi et al., 2010; Büchs & Schnepf, 2013a; Büchs & Schnepf, 2013b; Duckman & Jackson, 2009; Miehe et al., 2016) and supported by findings from the Finnish study (Salo et al., 2021). Studies highlight the role higher population density in urban areas can play leading to higher energy consumption, transport use and housing spending in driving urban emissions. Additionally, urbanization, with changes in lifestyle and increased consumption, is likely to contribute to increased carbon emissions in developing rural areas (Miehe et al., 2016). On the other hand, rural areas in developing countries such as the Philippines, China, and India (Lee et al., 2021; Seriño & Klasen, 2015; Sun et al. 2021) also have lower emissions compared to urban areas, mainly due to lower energy and commodity consumption.
H2: Carbon emissions in urban areas are higher than in rural areas.
Household Size
The number of members in a household, also known as household size, is one of the important factors that determine carbon emissions. Studies (Baiocchi et al., 2010; Miehe et al., 2016; Salo et al., 2021) agree that large households, or households with many members, have lower CO2 emissions per capita thanks to on the sharing of resources and energy within the household, helping to increase consumption efficiency. In contrast, small households or households with few members, especially single-person households, have higher emissions per capita due to the inability to optimize energy consumption (Büchs & Schnepf, 2013a, 2013b).
When analyzing in detail the number of young people (Children) in household size, young people have lower carbon emissions due to environmentally friendly consumption habits (Seriño & Klasen, 2015), using vehicles public transportation, and are less likely to engage in luxury consumption activities (Druckman & Jackson, 2009) than adults. However, unlike the number of young people in households, adults in households tend to emit higher CO2, especially in areas such as energy use and commodity consumption. (Büchs & Schnepf, 2013a, 2013b).
H3: The number of young people in the household has a positive impact on carbon emissions
H4: The number of adults has a positive impact on carbon emissions
Housing Acreage
In most studies it has been found that larger housing areas are associated with higher CO2 emissions, due to the energy demand for heating, cooling and maintaining larger spaces (Baiocchi et al, 2010). Larger homes require more energy to maintain comfortable living conditions (Seriño & Klasen, 2015) and this increases the Carbon footprint of households. Meanwhile, smaller housing areas tend to help reduce CO2 emissions because less energy is consumed, especially for heating and cooling activities (Büchs & Schnepf, 2013a, 2013b, Salo et al, 2021). In addition, Li et al.‘s (2014) study analyzed the effects of housing size in China and found that larger homes generate larger amounts of "embedded" carbon due to the use of materials construction and energy to build and maintain larger spaces.
H5: The area of a household’s residence has a positive impact on carbon emissions
Gender of the Head of Household
Although the gender of the household head has a certain impact on the household’s carbon footprint, it is not the most important factor because the overall impact of gender on total household emissions becomes insignificant. (Büchs & Schnepf, 2013a, 2013b; Miehe et al., 2016; Salo et al., 2021). Although there is no clear overall impact, significant gender differences in emissions by consumption sectors exist. There are indications that male-headed households tend to consume more energy for transport and personal vehicles, due to the habit of consuming energy for vehicles such as cars and other vehicles equipment consumes more energy than women. Women often spend more on essential living needs such as food and household care (Büchs and Schnepf, 2013a, 2013b). Women often spend more on essential living needs such as food and household care (Büchs and Schnepf, 2013a, 2013b). Even households with a higher proportion of male members tend to have greater emissions (Osorio et al., 2024).
H6: Men’s carbon emissions are higher than women’s
Age of the Head of Household
Researchers explored the relationship between the age of the head of household and CO2 emissions. The results show that the age of the household head has a significant influence on energy consumption and carbon emissions due to changes in consumption habits and energy needs according to each stage of life.
Büchs and Schnepf (2013a, 2013b) research shows that older households (over 65 years old) tend to have lower carbon emissions than younger-headed households. This may be because they use less transportation and have lower energy consumption, mainly because they are less likely to engage in energy-intensive activities such as commuting or traveling. In contrast, young household heads tend to have higher emissions, especially from vehicle use and consumption of goods and services (Baiocchi et al. (2010). Specifically, younger householders (under 40 years old) have higher emissions due to higher consumption of activities related to transportation, technology, and entertainment (Druckman and Jackson (2009).
H7: Age of household head has a significant impact on carbon emissions
Education Level of the Head of Household
The level of education of the household head is related to access to information, environmental awareness and consumption behavior, leading to differences in carbon emissions. Research results show that household heads with high levels of education often have greater energy consumption and carbon emissions, mainly due to higher consumption capacity in activities related to transport and industry technology and tourism (Baiocchi et al., 2010; Salo et al., 2021; Seriño & Klasen, 2015). However, people with higher levels of education often have a higher awareness of environmental issues that may lead them to adopt energy saving measures in areas such as home energy use. (Büchs & Schnepf, 2013a, 2013b). People with higher levels of education also tend to engage in more sustainable consumption behaviors, such as using energy more efficiently or choosing environmentally friendly transportation (Miehe et al., 2016). Thus, the education level of the household head strongly affects energy consumption and carbon emissions.
H8: The education level of the household head positively affects carbon emissions
viii. Type of house
Results from studies show that a household’s housing type directly affects a household’s energy consumption and carbon footprint, especially in the areas of energy used for heating, cooling, and household appliances. Studies highlight that differences between housing types (houses, apartments) have a strong impact on carbon emissions. Private or rural houses have higher energy consumption, mainly due to their larger area and lower energy efficiency. Private houses often have larger areas, requiring more energy to maintain basic comfort needs (Büchs & Schnepf, 2013a, 2013b). Studies show that households living in single-family homes emit significantly more emissions than those living in apartments, mainly due to higher energy costs for heating and cooling (Baiocchi et al., 2010). Meanwhile, apartments often have lower energy consumption thanks to more compact spaces and higher energy efficiency (Miehe et al., 2016; Seriño & Klasen, 2015; Steen-Olsen et al., 2016). Thus, housing type has a major impact on household carbon emissions.
H9: The carbon emissions of private houses are higher than those of apartments
Number of Cars
The number of cars a household owns has a strong relationship with its carbon footprint, especially in the transport sector. These studies show that the number of cars owned by households is closely linked to CO2 emissions from the transport sector. Households that own more than one car have a higher carbon footprint than those that own just one or no car. In particular, carbon footprints with two or more vehicles have significantly higher CO2 emissions from personal vehicle use (Büchs & Schnepf, 2013a, 2013b). At the same time, research in the Philippines (Seriño & Klasen, 2015) shows that car ownership is directly related to a higher carbon footprint, especially in urban households. Households with multiple cars often consume more fuel, increasing emissions from traffic. Meanwhile, households with fewer (or no) cars are more likely to use public transport, leading to lower carbon emissions. This shows that dependence on personal vehicles has a major impact on household CO2 emissions.
H10: The number of cars per household has a positive impact on carbon emissions
Research Methodology and Data
Data Sources
The study uses the cross-sectional data set of the Vietnam Household Living Standards Survey (VHLSS) 2020. The secondary data of this study was collected from a survey conducted by the General Statistics Office of Vietnam. The survey was conducted on the expenditures of about 9,389 households to collect detailed information on household consumption levels of all 64 provinces and cities across the country.
Sources for Calculating emission Coefficient
The study combines consumer spending data collected from the 2020 VHLSS spending survey results with an Environmentally Extended Multiregional Input – Output (EE MRIO) to determine the carbon emission coefficient/ carbon intensity of different economic sectors. EE MRIO is an important analytical framework that comprehensively describes the global economy and analyzes its environmental impacts (Steen- et al., 2012; Steinmann et al., 2018). The EE MRIO combines economic and environmental data to better understand the impact of economic activity on the environment, such as greenhouse gas emissions.
Due to the specific nature of the rather detailed collected data, when analyzing carbon emissions or other environmental impacts of Vietnam, the study not only performed tests between survey data but also combined recently released data from various sources such as EXIOBASE, EPA and WRAP.
EXIOBASE
Among the existing EE MRIO databases, EXIOBASE (Website: EXIOBASE Emission Factors (n.d.)) stands out because it provides details on various economic sectors making it a powerful tool for analyzing the environmental impacts of economic activity (Website: EPA).
The EXIOBASE standard is a resource and life cycle database, used to calculate CO2 emission factors in production and consumption activities. It can be understood to calculate the CO2 emission coefficient/CO2 emission intensity (carbon intensity). EXIOBASE uses the IOA method to measure energy resources and greenhouse gases during the product production and use cycle (Steen-Olsen, 2016). The carbon intensity/CO2 Emission Factor in EXIOBASE is calculated based on energy consumption and emissions data from different stages of the production cycle.
EPA
The United States Environmental Protection Agency (EPA) (Website: EPA Emission Factors, (n.d.)) provides a comprehensive database of CO2 emission factors through the GHG Emission Factors Hub. This database is designed to provide organizations with an easy-to-use, regularly updated set of default emission factors for greenhouse gas reporting. This CO2 emission factor is the amount of CO2 released into the environment for each unit of energy produced or consumed. This coefficient varies depending on the type of fuel, production process and technology used. And the commonly used method to calculate the CO2 emission factor is: Conversion of Energy to TOE (standard tons of oil): EPA often uses the conversion factor from energy consumption to TOE (standard tons of oil) to calculate the CO2 emission coefficient. The conversion value of 1 TOE is calculated based on the rate of 1 TOE = 41,870 MJ according to Intergovernmental Panel on Climate Change (IPCC, 2021).
WRAP
The study also used a combination of the Waste & Resources Action Program (WRAP) (WRAP, 2024) database, a non-profit organization in the United Kingdom. Their mission is to partner with businesses, individuals and communities to advance the circular economy. WRAP provides CO2 emission factors for a variety of materials and processes, helping businesses and organizations evaluate and reduce their carbon footprint. WRAP uses a modeling approach to simulate CO2 emissions from complex sources, such as cities or large areas. These models combine many factors, including operational data, meteorological conditions and emissions control technology, to estimate overall CO2 emissions. In addition, WRAP is also involved in changing design and production to create new markets for reuse and recycling, thereby reducing waste and pollution, saving resources and reducing emissions greenhouse.
Moreover, for calculating the amount of CO2 for electricity consumption, this study proactively uses the results of calculating the emission coefficient of Vietnam’s power grid in 2020 by the Department of Climate Change and the Ministry of Natural Resources Environment Vietnam announces annually according to document No. 1316/BĐKH-TTBVTOD dated December 31, 2021.
Method for Calculating CO2 Emissions
Due to the difference in emission coefficients and household consumption in the use of different currencies. Therefore the study uses 2020 average exchange rates collected from Exchange—Rates. According to Exchange—Rates in 2020 EUR/VND is 26,432 VND USD/VND is 23,226 VND.
The study uses the collected emission coefficients to calculate CO2 emissions for each household expenditure item, with the general formula as follows:

In which: CF is CO2 emissions; HS is the emission coefficient of consumption; TD is the amount consumed; j represents the consumption category; i is the serial number from 1 to 9,389 households.
Then, the study will calculate the total CO2 emissions of each household with the formula:

In which: CFj is total CO2 emissions; CFij is CO2 emissions; j represents the consumption category; i is the serial number from 1 to 9,389 households.
Empirical Models
To achieve the research goal of identifying factors that play an important role in carbon emissions, the study analyzed the trends and levels of factors affecting these emissions of households in Ho Chi Minh City. Specifically, using OLS regression analysis with the proposed research model is as follows:

Where Y is the natural logarithm of expenditure and CO2 emissions according to the Table 1 describing the following variables.
Description of Variable.

Research Results
Descriptive Statistics
The Figure 1 shows the average Carbon Footprint of a household in Vietnam is about 6,959kg CO2/year. Among them, households living in the Red River Delta have the largest average emissions, about 8,133 kg CO2/year. In addition, households living in the Northern Midland and Mountainous and the Southeast have carbon footprints larger than the national average, 7,182 and 7,402 kg CO2/year, respectively. In contrast, the regions with lower CO2 emissions than the national average are the North and Central Coast; Central Highlands and Mekong River Delta. Among them, households in the Central Highlands are the households with the lowest average Carbon footprint.
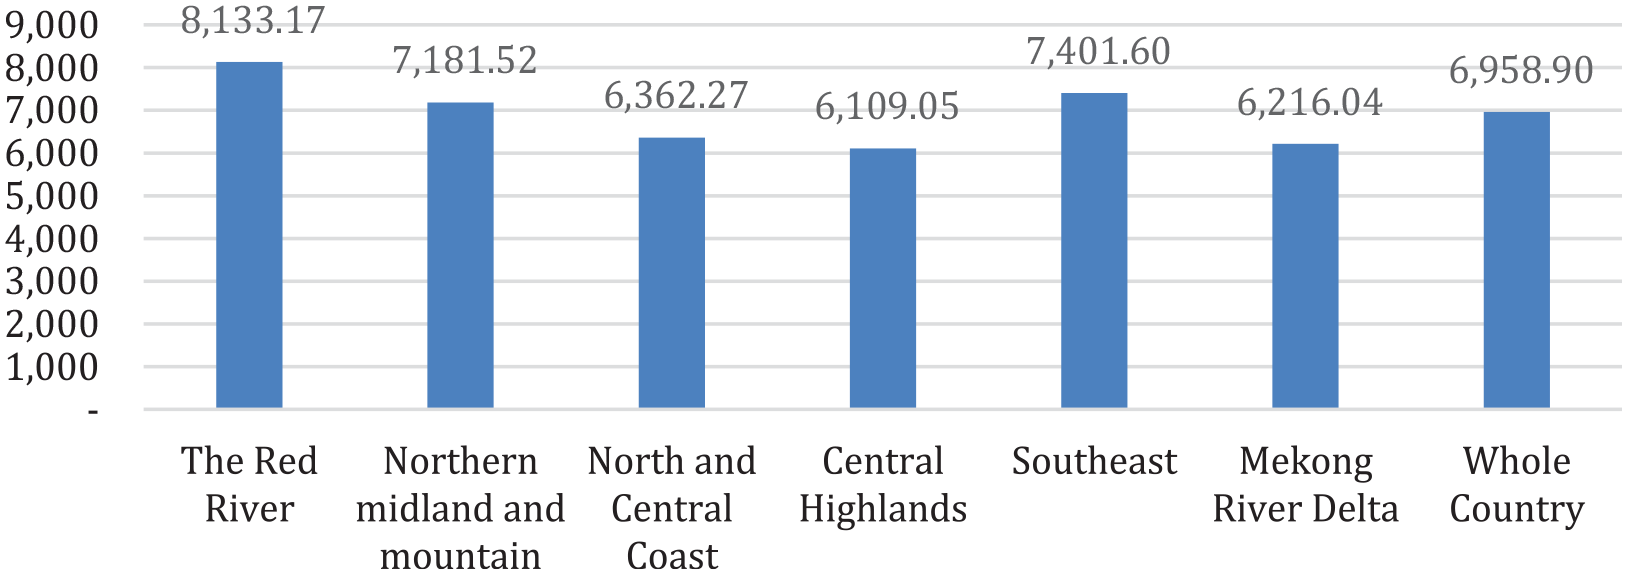
Average Carbon footprint of regions in Vietnam (Unit: kg).
Figure 2 denotes that households living in the Red River Delta region have the largest average carbon footprint in the country. The carbon footprint in this region has large differences between regions. In particular, Hanoi capital is the place with the most outstanding average emissions in the country. The carbon footprint of a household is about 10 tons of CO2/year, nearly double the province with the smallest footprint is Thai Binh province.

Average Carbon footprint of each household in the provinces in The Red River (Unit: kg).
The average Carbon footprint of households in the provinces of the Northern Midland and Mountain (Figure 3 below) is relatively evenly distributed, with the majority of the average carbon footprint of the provinces falling around 7 to 8 tons of CO2/year. Only two provinces, Ha Giang and Cao Bang are particularly low compared to the region at 6,323 kg and 5,543 kg CO2/year respectively.

Average Carbon footprint of each household in the provinces in the Northern Midland and Mountain (Unit: kg).
Figure 4 illustrated that households in Da Nang lead in CO2 emissions in the North and Central Coast regions, with emissions of 8,539 kg CO2/year. The carbon footprint distribution has a significant difference, as the province with the smallest footprint is only about 4,878 kg CO2/year and this is also the province with the smallest carbon footprint in the country.

Average Carbon footprint of each household in the provinces in the North and Central Coast (Unit: kg).
Figures 5 and 6 above show the average carbon footprint of each household in the provinces in the Central Highlands and Southeast. Specifically, as the region with the smallest carbon footprint, the provinces in the Central Highlands have a relatively low carbon footprint. The province with the largest footprint in this region, Dak Lak only has CO2 emissions approximately equal to the national average and the remaining provinces all have emissions below the average.
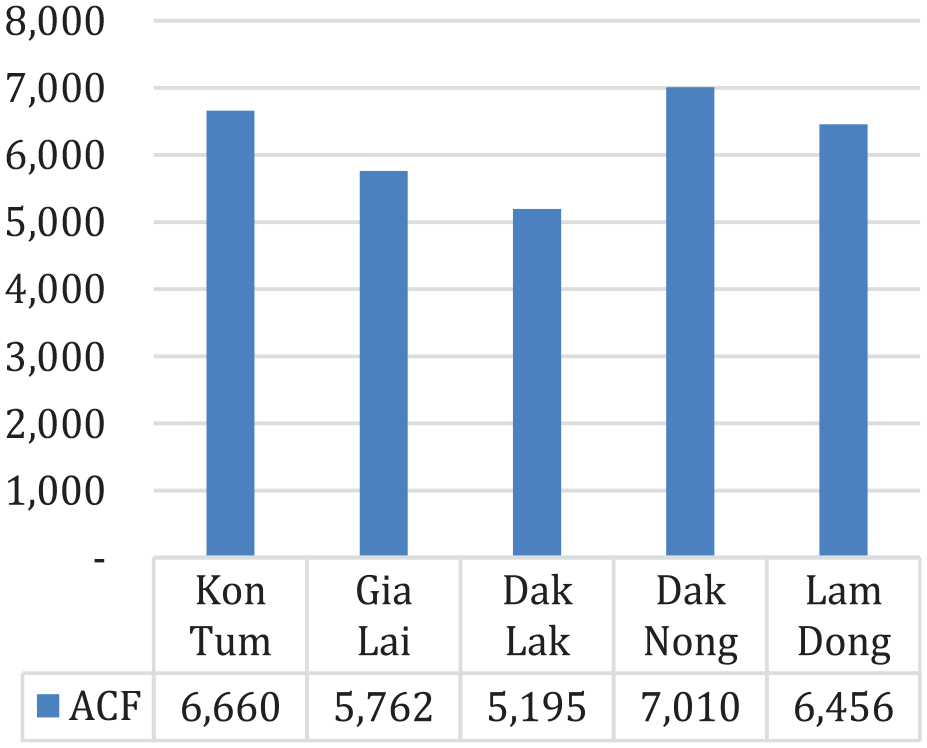
Average Carbon footprint of each household.

Average Carbon footprint of each in the provinces in the Central Highlands household in the provinces in the Southest.
Regarding the average carbon footprint of each household of the provinces in the Southeast region, this is an area where the difference between the carbon footprints of the provinces is quite large. The city with the largest carbon footprint is Ho Chi Minh City with an average household emission of 9,128 kg CO2/year/household and this city is also the city with the second largest carbon footprint in the country. Meanwhile, Binh Duong has a relatively low average footprint, only about 5,868 kg CO2/year/household.
The Mekong River Delta is the region with the second lowest footprint in the country, only 7 kg CO2/year/household larger than the Central Highlands. The province with the smallest footprint in the region is Ben Tre province, only about 5,429 kg CO2/year/household (Figure 7).

Average Carbon footprint of each household in the provinces in the Mekong River Delta (Unit: kg).
Looking at Figure 8, we see that the Food is the source of the majority of CO2 emissions, accounting for about 54.72%. In contrast, CO2 emissions arising from travel account for only a very small part, only about 0.33%. This is probably due to the lack of data from the Vietnam Household Living Standards Survey (VHLSS, 2020), the questions related to mobility were not complete, leading to the calculation of emissions possible mobility there are errors.
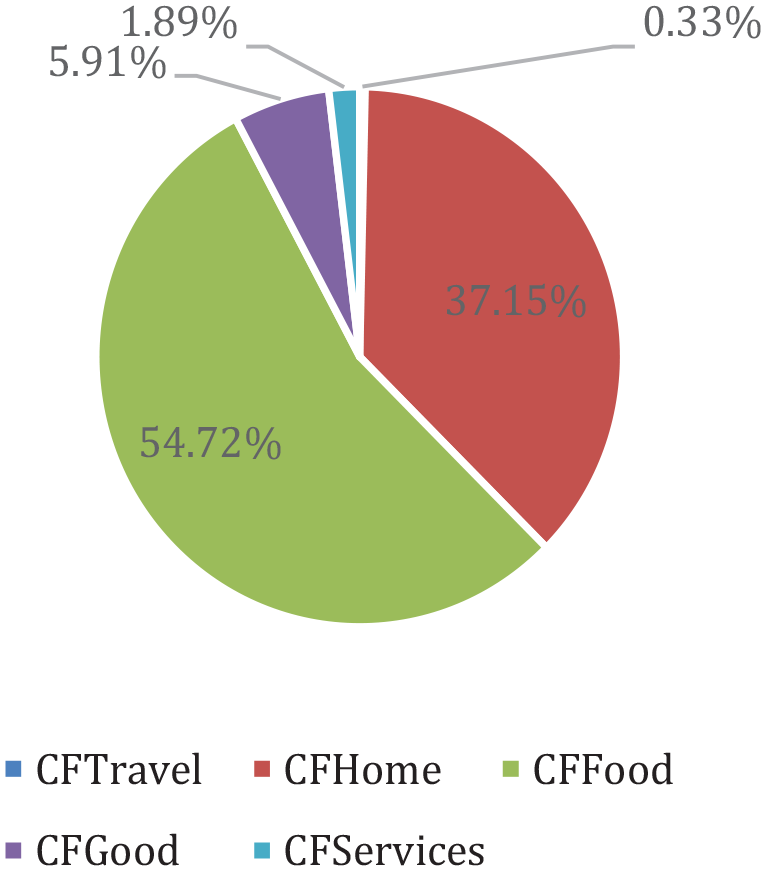
Carbon footprint ratio of components.
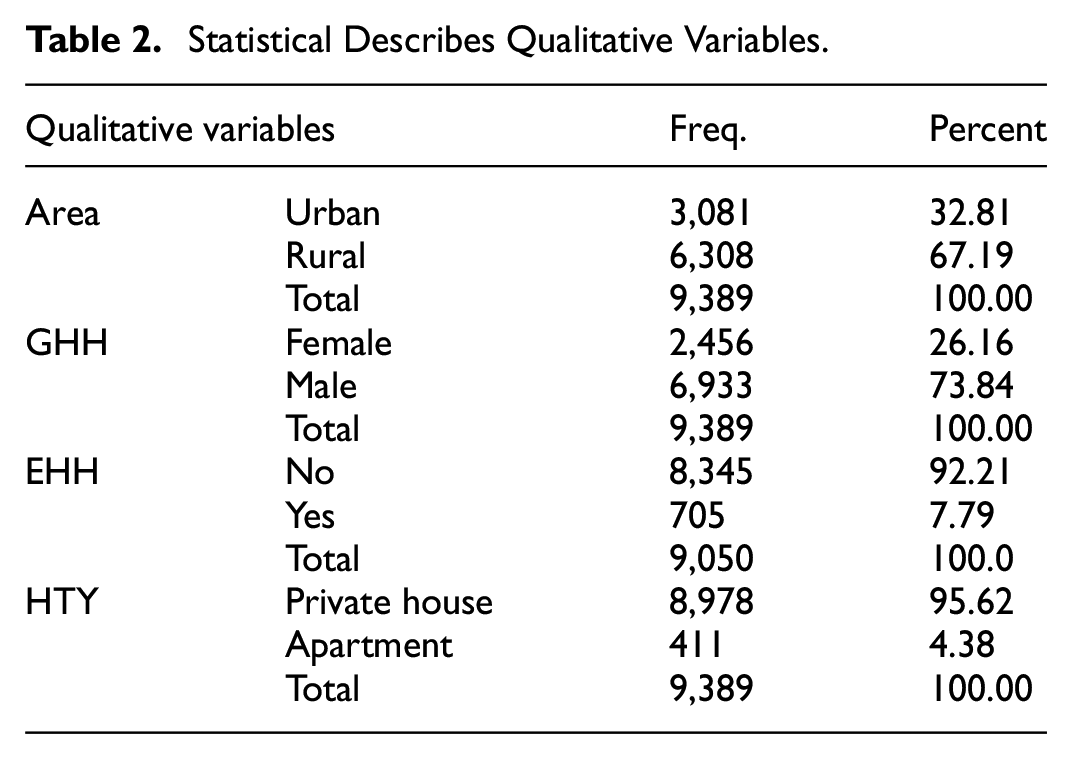
Descriptive statistical results in Table 2 show that most households in Vietnam live in rural areas, accounting for about 67%. The majority of households choose to live in private houses, nearly 96%. The number of male-headed households is three times the number of female-headed households. Meanwhile, the rate of household heads trained at post-secondary education levels is still quite low, accounting for only nearly 8%.
Statistical Describes Qualitative Variables.
A household in Vietnam has an average size of about 3 to 4 people, including 1 child and 2 to 3 adults. The average income of each household is about 178 million Vietnamese Dong (VND). However, the income gap between households is quite large, shown by the standard deviation of about 160 million VND. The household with the highest income is about 6,059 million VND, 1,156 times higher than the household with the lowest income, 5.24 million VND. The average expenditure of a household in Vietnam is about 70.8 million VND in a year. Similar to income, the difference in spending between households is quite large, the standard deviation is 72.5 million VND in a year—this number is even larger than the average spending level. And the household with the largest expenditure is 2,897 million VND, 2,455 times more than the household with the smallest expenditure. The average carbon footprint of a family in Vietnam is about 7 tons of CO2 a year while the household has the smallest carbon footprint, generating only 126 kg of CO2 each year (Table 3).
Statistical Describes Quantitative Variables.

Regression Analysis
Based on the results in Table 4, all independent variables affect a household’s spending. Among them, income is the factor with the greatest impact. When other factors remain unchanged, a 1% increase in income increases household spending by 0.465%. Regarding geographical location, under the same conditions of other factors, households living in rural areas have an expenditure level that is 0.116% lower than households living in urban areas. Household size also contributes to increasing household spending. When a household has one more person under 18 years old, spending increases by 0.0828%; When the household has one more person aged 18 or older, the spending level increases by 0.0971%. An increase in housing area of 1 square meter increases spending by 0.00124%. Regarding the head of household, if the head of the household is male, the household’s expenditure is 0.0491% higher than that of a household headed by a female; When the head of household increases by 1 year, the household’s spending level decreases by 0.00215%. Households living in apartments will have 0.0819% higher spending than households living in private houses. Finally, when a household has an additional car, it contributes to increasing household spending by 0.291%.
Regression Results With Y being the Natural Logarithm of the Expenditure Variables.

Note:***, ** and * represent significance levels of 0.01, 0.05 and 0.1 respectively.
The standard errors are reported in parentheses.
According to the results of Table 5, all factors in the model have an impact on the household’s carbon footprint. Like spending, a household’s carbon footprint is most positively and strongly affected by income, which is consistent with the research results of Salo et al., (2021) and Baiocchi et al. (2010). Specifically, when income increases by 1%, the household’s carbon footprint increases by 0.302%. And income has a positive impact on all components of the carbon footprint, the strongest being the impact on emissions generated from the use of services—emissions from this source will increase by 0.889% if income is increased household income increased by 1%. This result once again confirms that income is the leading determinant of carbon emissions. Income not only helps direct research more accurately, but also provides a scientific basis for building fair and effective policies in reducing emissions.
Regression Results With Y Being the Natural Logarithm of Carbon Footprint Variables and Components.

Note:***, ** and * represent significance levels of 0.01, 0.05 and 0.1 respectively.
The standard errors are reported in parentheses.
Households living in rural areas will have a carbon footprint 0.0597% smaller than households living in urban areas, which is contrary to the results of Büchs and Schnepf (2013b). More specifically, households living in rural areas have smaller emissions from all components, except for emissions from food consumption. The results show differences in carbon emissions between rural and urban areas in Vietnam, which shows that local context (economic, social, cultural, infrastructure,…) has significant impact on carbon emissions. With this finding, this study not only provides important practical evidence in Vietnam but also makes a significant additional contribution to international research: encouraging scientists not to rely solely on hypotheses or trends global direction, but needs to examine the specificities of each region or country.
Similar to the results of Salo et al. (2021), when a household has an additional member (including children and adults), it will increase the carbon footprint of that household. Specifically, when a household has an additional child, the household’s carbon footprint increases by 0.115%; If a household has one more adult, that household’s footprint increases by 0.132%. These additional emissions come from sources such as: household energy use, food consumption, and use of goods and services. Particularly, emissions arising from transportation will decrease when a household has an additional child and are not affected by an increase in the number of adults in the household. Research results have shown a direct relationship between the number of household members and carbon emissions, providing a scientific basis for analyzing the impact of household structure on the environment; At the same time, it also makes an important contribution toward sustainable development, especially in the current context of population growth and increasing environmental pressure.
The family’s living area is a factor that increases the household’s carbon footprint, this is similar to the conclusion of Salo et al. (2021) and Xiaodong et al. (2014). When living area increases by 1 square meter, the household’s carbon footprint increases by 0.00138. The component emission sources subject to this impact are household energy use, food consumption, and use of goods and services. The research results have added important quantitative data on the impact of living area on carbon emissions, and also provided a basis for more detailed analysis of related emission sources; Through this, the results of this research also serve as a basis for guiding policy design, housing planning, and raising community awareness about sustainable living space management and consumption, contributing to reducing minimize emissions affecting the environment.
Male-headed households will have a larger carbon footprint than female-headed households by 0.0634%, which is consistent with the results of of Büchs and Schnepf (2013b); Osorio et al., (2024); Zen et al. (2022); and Carlsson Kanyama et al. (2021). The larger emissions are due to the fact that male-headed households have larger emissions from household energy use and food consumption than female-headed households. This finding adds important evidence about the role of gender in carbon emissions, contributing to the development of theories related to consumer behavior and environmental impacts; At the same time, it expands the theoretical basis on the relationship between social factors (gender) and consumer behavior related to the environment.
The older the household head is, the lower the household’s carbon footprint, which is consistent with the results of Salo et al. (2021), but contrary to the results of Büchs and Schnepf (2013b). In Table 5, when age of the head of household increases by 1 year, the household’s carbon footprint decreases by 0.00128%. This is because as the head of household increases in age, emissions from energy use, consumption and goods decrease. This result enrich the understanding of the role of demographics, especially age, in influencing household carbon emissions.
The education level of the household head has an impact on household carbon emissions. Specifically, if the head of household has a higher level of education (continues to study after high school), the emissions are 0.0743% higher than those with a lower level of education (do not continue to study after high school). This result is consistent with previous studies and research hypotheses. This finding contributes to a better understanding of the link between educational attainment and carbon emissions, confirming that education not only affects the economy but also the environment.
Households living in apartments have 0.0701% larger carbon emissions than households living in private houses, which is consistent with the research results of Shigetomi et al. (2021) but contrary to research hypothesis. This result suggest that research needs to expand understanding of the relationship between housing type and carbon emissions, and promote discussion of influencing factors that were not considered in the original hypothesis.
The number of cars a household owns has a positive impact on its carbon footprint, which is similar to the conclusion of Salo et al. (2021). When a household owns an additional car, its footprint increases by 0.174%. The results of this study provide clear quantitative data on the impact of personal cars on carbon emissions, contributing to the theoretical foundation of factors affecting household emissions. Thereby, this finding is also an important basis for developing policies and solutions to limit carbon emissions from household cars.
Finally, the level of explanation of each model (Tables 4 and 5) is mostly in the range from greater than 34% to 61%, this shows that the estimated model is quite good at explaining the impact of the factors is related to the change in the dependent variable (carbon footprint). However, the level of explanation of the model assessing the impact of factors on carbon emissions from travel is quite low. This can be explained because synthesizing relevant data on this indicator is difficult and may not fully reflect the nature of the problem.
In general, the direction of each factor’s impact on carbon footprint is the same as the direction of that factor’s impact on a household’s spending level. For example, income positively impacts both spending and carbon footprint and its components. However, some differences do exist (highlighted and marked in red in Table 6). For example, rural households have lower spending on food consumption than urban areas, but the amount of emissions arising from this source of rural households is higher than that of urban households. Or, household spending on goods is not affected by whether the household lives in urban or rural areas. However, the emissions from this activity of households living in rural areas are lower than those of urban households.
Summary Table of Impacts of Factors on Expenditure and Emissions.

Conclusion and Discussion
To achieve the goal of the study, the authors compiled statistics and calculated the total spending and carbon emissions emitted from spending in 2020 of households in Vietnam. Tobe specific, the study performed calculations for each spending category including spending on travel, energy consumption, food, goods and services. These calculations are based on CO2 emission factors collected from EPA, EXIOBASE, WRAP. Additionally, the study identified factors that impact household spending and carbon emissions.
The results of the study provide evidence showing the relationship between factors related to carbon emissions from household spending. This result is consistent with the hypotheses stated in the literature review, specifically: research results have shown that factors that positively impact total household spending will also positively impact the household’s carbon footprint and vice versa. Specifically, factors including income, household size, house area and number of cars have a positive impact on the household’s carbon footprint. Conversely, the age of the household head tends to shrink a household’s carbon footprint. In addition, households living in urban areas have a larger carbon footprint than households living in rural areas; Households living in apartments have a larger carbon footprint than households living in private houses; Male-headed households will generate larger CO2 emissions than female-headed households; And finally, households whose head has an education level higher than high school will generate larger emissions than households whose head has an education level of high school or less.
Based on the research results, to solve the problem of minimizing carbon emissions from household spending in the current context, policymakers need to deploy general and comprehensive solutions that does not affect the development of the economy.
First of all, because income is a factor that positively impacts all spending categories, thereby significantly increasing a household’s carbon footprint. However, to reduce emissions by limiting income and spending is impossible because that would go against the trend of stimulating demand to stimulate the economy as well as promote a country’s development. Therefore, it is necessary to encourage sustainable consumption through the application of carbon taxes on polluting products and subsidies for environmentally friendly products. This helps direct household spending without reducing income or negatively affecting the economy.
Second, for households with large scale, large house area and owning many cars—factors that increase carbon emissions, it is necessary to implement policies to encourage the use and development of renewable energy sources such as solar energy, wind energy, water energy… Besides promoting environmentally friendly energy sources, saving energy is also an inevitable solution. The government needs to review and evaluate the development of documents such as the law on economical and efficient energy consumption, which are truly necessary solutions to promote energy saving. This can contribute to saving on household energy costs as well as reducing household emissions; Inspect and review vehicles to ensure National Standards (TCVN 6438:2018, (2018)—the standard for the maximum allowable limit of emissions on road vehicles. In addition, policymakers can build and develop policies aimed at promoting the development of “green” products such as environmentally friendly materials and recycled products as well as encouraging the use of public transportation systems.
Third, for households living in private houses and apartments, it is necessary to apply smart urban development policies, focusing on building energy-saving apartment buildings and using sustainable materials and environmentally friendly design. These policies not only help reduce emissions but also improve the quality of life of residents.
Fourth, it is necessary to create conditions for older generations to share experiences on sustainable lifestyles with the community. This can be done through education and communication programs, aimed at changing the consumption behavior of young people, especially men, focusing on using public transport, reducing energy consumption and prioritize environmentally friendly products. In addition, support initiatives to develop and use energy-saving equipment, and create conditions for qualified high education households to access and apply this technology to help them raise awareness about energy-saving equipment consume more responsibly.
Finally, to address the difference in emissions between rural and urban households, it is necessary to focus on investing in developing clean energy infrastructure in rural areas, helping to improve living conditions without does not increase emissions. At the same time, policies need to promote equality in access to environmentally friendly products and services, to reduce emissions gaps between regions and household groups.
Overall, this research has made important contributions in both theory and practice. The study expands understanding of the factors that influence household carbon emissions in the context of a developing economy. From there, the research provides data and analysis to support the design of sustainable consumption policies. However, the research still has certain limitations such as the cross-sectional nature of the data and potential omitted variables (e.g., regional energy policies or programs). Therefore, it is necessary to consider expanding this issue for future research.
Footnotes
Acknowledgements
The authors would like to thank Ho Chi Minh City Open University for their financial support for this research.
Ethical Consideration
The study did not conduct any testing on animals or humans.
Funding
The author(s) disclosed receipt of the following financial support for the research, authorship, and/or publication of this article: This research is funded by Ho Chi Minh City Open University.
Declaration of Conflicting Interests
The author(s) declared no potential conflicts of interest with respect to the research, authorship, and/or publication of this article.
Data Availability Statement
Data is available on request.