
Abstract
The accessibility of urban structures poses an issue for contemporary urban design and development. The character of urban form can be recognised by its plot pattern, which is the smallest generative unit to shape the urban context and has particular spatial configurations and fine characteristics. This study chose four case studies and a limited number of parameters to examine plot characteristics. Two fundamental variables play a key role in formulating the plot’s character, specifically perimeter and size. This paper examines the changes that occurred through the transformation from old traditional patterns (pre-modern movement), which reflect local physical and socioeconomic characteristics and were based on a spontaneous order, to a modern pattern that represents a pre-planned system, from fine-grained activities to pre-determined uses which are driven by new development policies. The study adopts a case study approach to develop an understanding of the disparities between the chosen urban pattern samples. The case study samples were located in different regions of Baghdad city, and the plot-based map was extracted using up to date georeferencing sources. The findings analyse each selected neighbourhood, by making comparisons and identifying correlations among the four chosen samples. The outcomes found that the perimeter and size of plots perform a significant role in creating the block pattern and influence the level of connectivity and accessibility. Also, the transformation from a traditional pattern to a different urban structure impacts the plot parameters, meaning the plot is a miniature generative entity that formulates and affects the urban form.
Introduction
Despite the ubiquity of urban morphology and typology in treatises on urbanism and cities, these concepts are more frequently associated with discourse and expression within practice, such as “garden-city,”“block-city,” and “grid-city,” than formal research. These two terminologies tend to be loosely defined which does not allow for precise quantitative comparisons between different areas or cities. Formally, definitions and studies of typo-morphology have been exclusively published in the interdisciplinary field of urban morphology, which has witnessed a large range of varied studies (Berghauser Pont et al., 2019; Cataldi, 2003; Conzen, 1960; Whitehand, 2001). Nonetheless, previous studies have mostly adopted a historic-qualitative approach where the critical issue has been the genealogy of the urban fabric and its ingredients, such as built elements. Although previous investigations have yielded a good understanding of the city and its morphological elements, which have evolved over time, they have not enabled more detailed comparisons or links, such characterisations, to their performance (Berghauser Pont et al., 2019). From a typo-morphology perspective, more prevalent urban forms can be defined.
Due to the micro-morphological characteristics of the urban form and its typo-morphology, there are potential benefits to employing a quantitative method. For example, Martin used a quantitative approach to develop a theory based on three generic building forms (blocks, slabs, and detached houses) (Martin & March, 1972), while Steadman (2014) used this approach to consider urban density. Moreover, in the 1982s, Rossi highlighted the benefits of traditional and historical building types when he adopted the notion of typo-morphology (Rossi, 1982). The concept prompts both an investigation of a city’s historical layers and further interest in urban processes. Indeed, the primary objective of typo-morphology, as developed by the Italian School, was to focus on how a city was built and its indicative design. This specifically focused on the historical city where “the present is not [a] complete break from the past, and the past offers several different models for the future” (Al-Saaidy, 2019a, 2020b; Moudon, 1994, p. 306; Moudon et al., 1997). Moreover, Kropf highlighted that “typomorphological analysis systematically distinguishes these different elements and element patterns in the fabric of a town and brings them together in the concept of urban tissue … the notion of urban tissue is a fundamental element in typomorphological studies. It is also the key to realizing the principles of typomorphology within a system of form-based zoning. As a tool in analysis and explanation, it helps us to understand both the physical structure and historical development of urban areas and the relation between urban areas and individual buildings” (Kropf, 1996a). Moreover, Kropf (1996a) accentuated the definition of elements, “the outline of an element is specified by describing its external boundaries in terms of its shape, size and proportions” (p. 726).
Many scholars have made significant contributions to the theory and methodology of typo-morphology, and their achievements have enabled the development of a quantitative approach involving multiple scales, parameters, and variables. For instance, Pont used a multi-variable technique to assess built density by applying theory to practice (Pont & Haupt, 2010; Steadman, 2014). They also adopted quantitative methods in typo-morphology by applying inter-scalarity and arithmetic classification methods (Pont & Haupt, 2010). Moreover, Colaninno et al. (2011) employed approaches to categorize building patterns, while street patterns and their characteristics were examined by Gil et al. (2011); Serra (2014); Barthelemy (2017); and Serra et al. (2017). In addition, both Hausleitner and Berghauser Pont (2017) and Fusco & Araldi (2017) addressed the urban fabric while Tarbatt (2012) and Demetriou et al. (2013) addressed plot properties.
In the theory of typo-morphology, the generative unit within a historical pattern (represented by plot) plays a key role in formulating the urban fabric. This hypothesis follows key processes which employ a bottom-up approach. In contrast an “up-down” order governs modern urban patterns, where the plot is recognised as a symmetric element and a duplicative, rather than a generative, unit. This mechanism for creating urban form has led to a wide spectrum of investigations and research across a multilevel urban scope. The current paper seeks to highlight the characteristics of plot pattern as independent factors and to draw greater attention to recent urban trends including potential links between urban form ingredients (plot) and other dependent factors (sustainability, resilience, vitality, and the 15-min city | for future research).
The main trends in urban studies could be summarised as urban sustainability, resilience, vitality, and the 15-min city. From a morphological perspective, the ingredients (plot, block, street, and neighbourhoods) shape the independent factors by measuring the dependent factors. These dependent factors have recently become a more significant trend in urban vitality. Based on different taxonomical and terminological expression regarding urban constituents, such as tissue, structure, pattern, tessellation, and form, a plot can be recognized as a miniature generative unit (Al-Saaidy, 2020a, 2020b, 2025).
Urban sustainability requires an integrative approach to quantify the measures adopted in the development of a sustainable metropolis. By applying diverse spatial modelling methods, Khodakarami et al. (2023) stated that three categories of factors can be presented in three definite sets: urban structure, ecosystem services, and environmental hazards. Moreover, Zhao et al. (2023) analysed the attributes of urban spatial form to define the urban grain, thereby underlining the size of urban parcels; they found that fine grain is paramount in promoting urban adaptability, improving urban vitality, and encouraging sustainable urban development. Hence, plots can contribute significantly to the primary map of sustainable schemes when examining urban morphological ingredients and enhancing urban vitality. Indeed, C. Chen et al. (2024) addressed plot patterns to understand urban living and the factors that enhance urban life. They stated that “the performance of plot patterns—a fundamental unit for precise control when measuring urban quality—influencing living convenience requires in-depth exploration” (Abstract). They stated a more crucial finding was that “small-scale plots, shape has a strong impact, while, for large-scale plots, the division and construction intensity within a block has a stronger influence” (C. Chen et al., 2024, Abstract).
Furthermore, Marques et al. (2024) contended that “resilience has a multi-scalar perspective within the metropolitan context and should be integrated with planning policies at different scales from a coordinated vision” (Abstract). Even though urban resilience involves the global and local levels of urban morphology, macro and micro scales might also be crucial. At the micro level, plot patterns and their characteristics play a significant role in shaping street edges and, in turn, block patterns and neighbourhoods. Indeed, Sharifi and Yamagata argued that resilience will become a more substantial issue in the ecological science and policy processes which control future urban evolution. Resilience will, to a large extent, be paramount in enabling urban designers, planners, and decision-makers to comprehend where their communities stand and to originate approaches and action plans that form more resilient metropolises (Sharifi & Yamagata, 2016).
Vitality has recently become an expectation within urban life, and a crucial measure in evaluating dynamic and sustainably built environments. According to Kang (2024), “Urban vitality is a core feature of sustainable cities and neighborhoods. Acknowledging the significant role of the spatial and physical attributes of built urban landscapes in influencing urban vitality” (Abstract). His study assessed the design and layout of cities and neighbourhoods and analysed their effects on urban vitality at different morphological scales. He suggested that urban planners and designers could consider the spatial configurations of buildings and streets as well as residents’ behaviour when examining urban vitality and street life (Kang, 2024). Nevertheless, improvements to the awareness of fine-grained blocks and plots requires inherent knowledge of the impact of blocks and plot patterns on urban vitality. Gan et al. (2021) showed that block size has a nonlinear threshold control on urban vitality, which verified the influence of small block size on this quality, and suggested that urban planners and designers could contribute to urban planning strategies with shorter residential blocks.
More recently, urban trends have pioneered the 15-min city as a fundamental parameter for measuring different aspects of the built environment. This measure becomes a significant criterion when examining various morphological dimensions. From a morphological perspective, plot property is an independent factor that controls and manages other dependent parameters. Khavarian-Garmsir et al. (2023) determined that a 15-min neighbourhood depends on the seven principal values of human-scale urban design: human scale, density, diversity, flexibility, proximity, digitalisation, and connectivity. By employing different methods, these values contribute to social, economic, and environmental sustainability. Moreover, Ma et al. noted that urban design schemes have radically transformed from “land-orientation” to “human-orientation”; for example, cities have focused on 15-min life-circle community development. They examined the performance of urban living facilities involving fairness, accessibility, diversity, and services related to health and emergency services (Ma et al., 2023). Also, Murgante et al. (2024) adopted the same criteria as controls for the 15-min neighbourhood, to optimise occupants’ access to indispensable amenities and encouraged sustainable approaches to transportation by altering public areas into multi-functional places.
These four urban trends (sustainability, resilience, vitality, and the 15-min city) are generally considered significant urgent issues and are likely to share similarities, such as accessibility, connectivity, permeability, proximity, street network, and urban morphological patterns (such as plots). Plot patterns represent one of the main entities of urban form and an underlying pattern of urban morphology. The current research does not examine the interrelationship between the plot and other urban topics but rather pays attention to the delicate characteristics of the plot. Plot patterns and their association with the four trends represent the primary arguments and topic of negotiation in prospective searches. The specific trigger for a bottom-up approach could be considered the primary method in which to capture and identify the plot features.
Nevertheless, this paper searches for a morphological technique and delivers knowledge on the plot as the smallest entity within urban tissue. Its focus is to underline the approach, result, or procedural problems associated with urban form by considering its fundamental scope and by placing it within multi-dimensional layers such as plots, blocks, streets, and buildings. Existing literature has examined a range of primary and secondary issues related to the urban morphology of Baghdad city (Al-Saaidy, 2019a, 2020c).
Theoretical Framework
Based on Conzen (1960)“burgage cycle,” this study asserts that a plot is one of the predominant elements of urban form, and adopts a cross-sectional approach (case studies of four neighbourhoods) to explore its significance. The urban plot is the smallest generative unit to characterize urban morphology. According to Bobkova et al. (2021, p 1) “(t)he importance of the plot (also referred to as ‘proper’) as one of the fundamental elements of urban form is well recognized within the field of urban morphology.” It represents the most substantial social and economic feature within urban and planning design. Other fundamental urban ingredients are the street pattern, building footprint, and urban block which emerge from growth processes over time and offer evidence of variety and complexity (Vialard, 2012). These interrelated urban ingredients govern different aspects of urban life such as the socio-cultural, functional, ecological, and economic indicators of the built setting (Abusaada et al., 2020; Al-Saaidy, 2019b, 2020a, 2020b, 2020c; Al-Saaidy & Alobaydi, 2021b; Alobaydi, 2017; Alobaydi et al., 2016, 2020; Aziz et al., 2020; Beiglu et al., 2019; Conzen, 1960; Jrew et al., 2019; Marcus, 2001; Mohammed & Alobaydi, 2020; Okeke et al., 2020; Schierup & Alund, 2020; Southworth & Ben-Joseph, 2013; Southworth & Owens, 1993; ).
Urban plots formulate the main character of the street and the entire urban form, while the degree of accessibility and connectivity affects the quality of urban life. Furthermore, morphological studies are a key approach to appreciating the formation and transformation processes of urban ingredients at the micro, macro, local, and global levels (Al-Saaidy, 2020a, 2020b; Griffiths & Vaughan, 2020; Moudon et al., 1997; Shakibamanesh & Ebrahimi, 2020; A. Zhang, Li, et al., 2020). Therefore, to understand the characteristics of urban ingredients at different levels, the physical quantities and spatial configuration of urban plots should be studied, analysed, and discussed. Previous studies around the globe have considered different urban patterns such as plot, block, street, and their characteristics, although most have focused on Asia, Europe, and North America (Berghauser Pont et al., 2019; Boeing, 2019; Cetinkaya et al., 2015; He et al., 2020; Le Fort, 2014; Li et al., 2020; Malcovati, 2019; Oikonomou, 2015; Pilehforooshha & Karimi, 2020; Rohloff, 2013; Scheer, 2020; Scheer & Ferdelman, 2001; Shakibamanesh & Ebrahimi, 2020; Sharifi, 2019; Sonne, 2009; X. Zhang et al., 2012).
Thus, research into the fine ingredients of urban form in Middle Eastern cities has not yet been conducted in detail. Most existing research has considered urban blocks rather than plots as the key influence on urban character (Asami & Niwa, 2008). For instance, Boffet and Serra (2001) employed orientation, proximity, and angularity standards to determine the characterization of the city when discussing the identification of spatial structures within urban blocks. Their approach applied gestalt theory within a visual study that defined free space and the alignment of urban blocks. The study determined how that leads to improved generalization processes through the configuration of spatial structure, the characterization of mainstay buildings, and the determination of structure (Boffet & Serra, 2001). Moreover, other studies have considered the building footprint; for example, by using cartography and topography data to determine the interrelationship between building patterns. They considered the buildings’ functions in relation to urban land use and how these affect urban vitality on a street scale at the block level (A. Zhang, Li, et al., 2020; X. Zhang et al., 2012, 2013; Y. Zhang, Qin, et al., 2020).
Moreover, He et al. (2020) proposed another valuable measuring technique to compute any two buildings’ spatial continuousness and orientation. When assessing three types of dataset and linking quantitative measures, the outcomes demonstrated that the technique could identify collinear and curvilinear building patterns. Nevertheless, the procedure is not based on grid configurations, but rather linear (collinear and curvilinear) building patterns (He et al., 2020). In contrast, Wang and Burghardt (2019b) examined urban grid patterns in order to generalize building clusters. Their model consists of three stages: forming a mesh, removing triangular meshes, and identifying the latterly formed buildings including their number, position, and exemplification. The results revealed that the characteristics of an authentic grid pattern are retained by typified buildings (Wang & Burghardt, 2019a). Furthermore, Yu et al. (2019) used a heuristic analytical method to track the disorganized building clusters found mostly in villages and suburbs. Their study offered a model on which to trim the serrated borders of polygonal buildings (Yu et al., 2019). The study by Z. Chen et al. (2019) examined the relationship between adjacent graph models and building polygons with spatial organization standards. In comparison, Elshater et al. (2019) developed a conceptual framework for a unified space syntax technique from two Egyptian samples. They achieved this by conducting interviews and questionnaires on urban singularity. Their findings revealed five sets of indicators, namely: the way of thinking, design ideas, the roles of stakeholders, learning the history, and the design-oriented method. Their main conclusion was that a replicable conceptual framework could be adopted to examine urban contexts in relation to urban policies and authorities’ roles and fields of specialisation (Elshater et al., 2019). According to Efeoglu et al. (2023), “the plot system not only defines the road network with its front edges, but also shapes the built environment through the design codes it specifies. This can lead to different typologies for buildings, streets, and eventually, diverse activities. In this context, the plot can be considered as the element of physical form and an element of control which conditions the property relation and functional characteristics of the city” (p. 2).
Plot Parameters | Plot Characteristics
Berghauser Pont et al. (2019, p. 2) employed three urban elements (street, plot, and building) to “(integrate) multi-variable geometric descriptions with inter-scalar relational descriptions of urban form.” They established a link between quantitative analysis (geometric and configurational measures) and theory by examining two theoretical proposals in urban morphology—the concept of the burgage cycle (Conzen, 1960) and the theory of natural movement (Berghauser Pont et al., 2019; Hillier et al., 1993; Marcus, 2000; Vialard et al., 2017). Moreover, accessible plots, their variety and density can be crucial variables when studying the urban form and its correlation with other factors such as social indexes like age groups and business fields (Al-Saaidy & Alobaydi, 2021b; Marcus, 2010). Furthermore, Kropf (1996a) employed six components based on Conzen’s and Caniggia’s conceptions: streets and blocks (or plot series), plots, buildings, rooms or spaces, structures such as walls or roofs (encompassing the details of construction), and materials (pp. 725–726) (Figure 1).

The elements of urban tissue according to Kropf’s views.
It might be argued that the typologies in these studies offer categories of built patterns, which can be clustered in terms of formal structure, blocks, streets, and plots. Moreover, they predominantly employ categories, and multiple variables and parameters, although some apply multi-scalar definitions of urban form. When assuming that the generative asset of a plot represents the microgenetic entity of urban form, it is essential to adopt the geometric characteristics of the plot parameter (Bobkova et al., 2017). Vialard (2012) adopted block dimensions when examining building footprints and their impact on performance. This performance considers the ability of blocks and building footprints to permit changes to land use and respond to the connectivity and intelligibility of an entire city (Vialard, 2012, 2013). Thus, Bobkova (2019, p. 3) stated that “the structure of plot systems plus the building layer may be the driver of more intense and diverse use of occupational space.” In addition, Usui (2018) focused on three parameters, building lot frontages, the density of buildings, and roads in the residential environment.
Although existing literature has addressed different building patterns and the attributes of urban form at varying urban scales, the fine characteristics of urban plot and their parameters are still limited. Nonetheless, in Middle Eastern cities, few studies address their geometrical properties and urban spatial systems or conduct comparisons and correlations. Some studies have examined urban blocks and building patterns in relation to other urban parameters such as: building-networks and generation methods; centrality analyses (Wang & Burghardt, 2019b); urban morphologies; and outdoor comfort via genetic algorithm-driven urban block design (Xu et al., 2019); the classification of building patterns using spatial vector data (Yan et al., 2019); a spatial adaptive algorithm framework for building pattern recognition (Bei et al., 2019); the multi-scale spatial patterns of building footprints (Jochem et al., 2020), and landscape patterns and building functions (Y. Zhang, Qin, et al., 2020). Hence, the primary contribution of this paper is to highlight the essential function of urban plot in formulating the urban character of a city where individuals can actively or passively interact, transact, and respond to the street edge. Scrutinizing the fine characteristics of urban ingredients regarding the physical properties of the plot pattern illustrates its role as the smallest generative unit to configure spatial urban structure at a micro and macro scale.
Furthermore, to determine the range of this research it is critical to address the urban form at different city scales (micro, macro, local, and global), while four selected areas are included to represent different urban patterns (Al-Saaidy, 2022; Al-Saaidy & Alobaydi, 2021a). However, this paper will address the physical form of the built environment, as represented by the plot, since this plays a crucial role in shaping the street and dominates important realms, namely public, semi-public, semi-private, and private. According to Oliveira (2016, p. 23), “the definition of the plots system in a given territory is an essential element of its urbanisation process and has considerable stability over time. The decision on what would be the new structure of private ownership in a territory might involve the subdivision of a set of large plots.” Plots offer a distinction between wide or narrow frontages and between those with long or short sides on the edge of the block (Kropf, 1996a). Plot-based urbanism represents a substantial theme when designing new neighbourhoods, examining and analysing the urban structure, or highlighting the need to maintain current urban areas (Barbour et al., 2016; Porta & Romice, 2010; Porta et al., 2011; Romice & Porta, 2015). Moreover, studies frequently refer to accessibility and connectivity as priorities when designing a block (Al-Saaidy, 2019b, 2020c; Kropf, 1996a, 1996b; Marshall, 2005; Porta et al., 2014; Shay et al., 2003; Thwaites et al., 2013).
This research enhances urban design and planning by defining and understanding the potential quantities of urban plot, and its impact on the quality of the urban life of a typical Middle Eastern city such as Baghdad (Alobaydi & Rashid, 2017; Dabbour, 2020; Elsheshtawy, 2004; Elsheshtawy et al., 2008; Saliba, 2016). The perimeter, shape and size of urban plots depend—amongst others—on local architectural regulations, the building pattern, and spatial associations. Plus, urban plots are spatially surrounded by street networks, and offer versatile opportunities for those who use the street for different purposes (Bourdic et al., 2012; Porta & Romice, 2010). Urban plots are definite polygons which determine the main border of the neighbourhood’s block pattern, and in turn, delineate the primary boundary between the private and public edges of the adjacent street. At the micro and macro level, urban plots formulate and control the level and degree of interaction between the private and public realms or between people who experience the street edge.
This study was conducted as follows: first, a review of preceding studies was conducted to define the research scope and identify the study gap; second, the method was applied which comprised different techniques (including metric and statistical information) to assess the physical and spatial parameters, namely the perimeter and size of the plot pattern in the four selected neighbourhoods. Thirdly, each parameter of the examined urban plot was reviewed and discussed, and the findings were compared. Finally, the conclusion helped to outline sustainable guidelines at different urban levels (micro, macro, local, and global), and highlighted the need to promote the quality of existing neighbourhoods or to design new ones (Figure 2). The boundary of the selected samples was subjected to further analysis to extract other parameters of urban form.
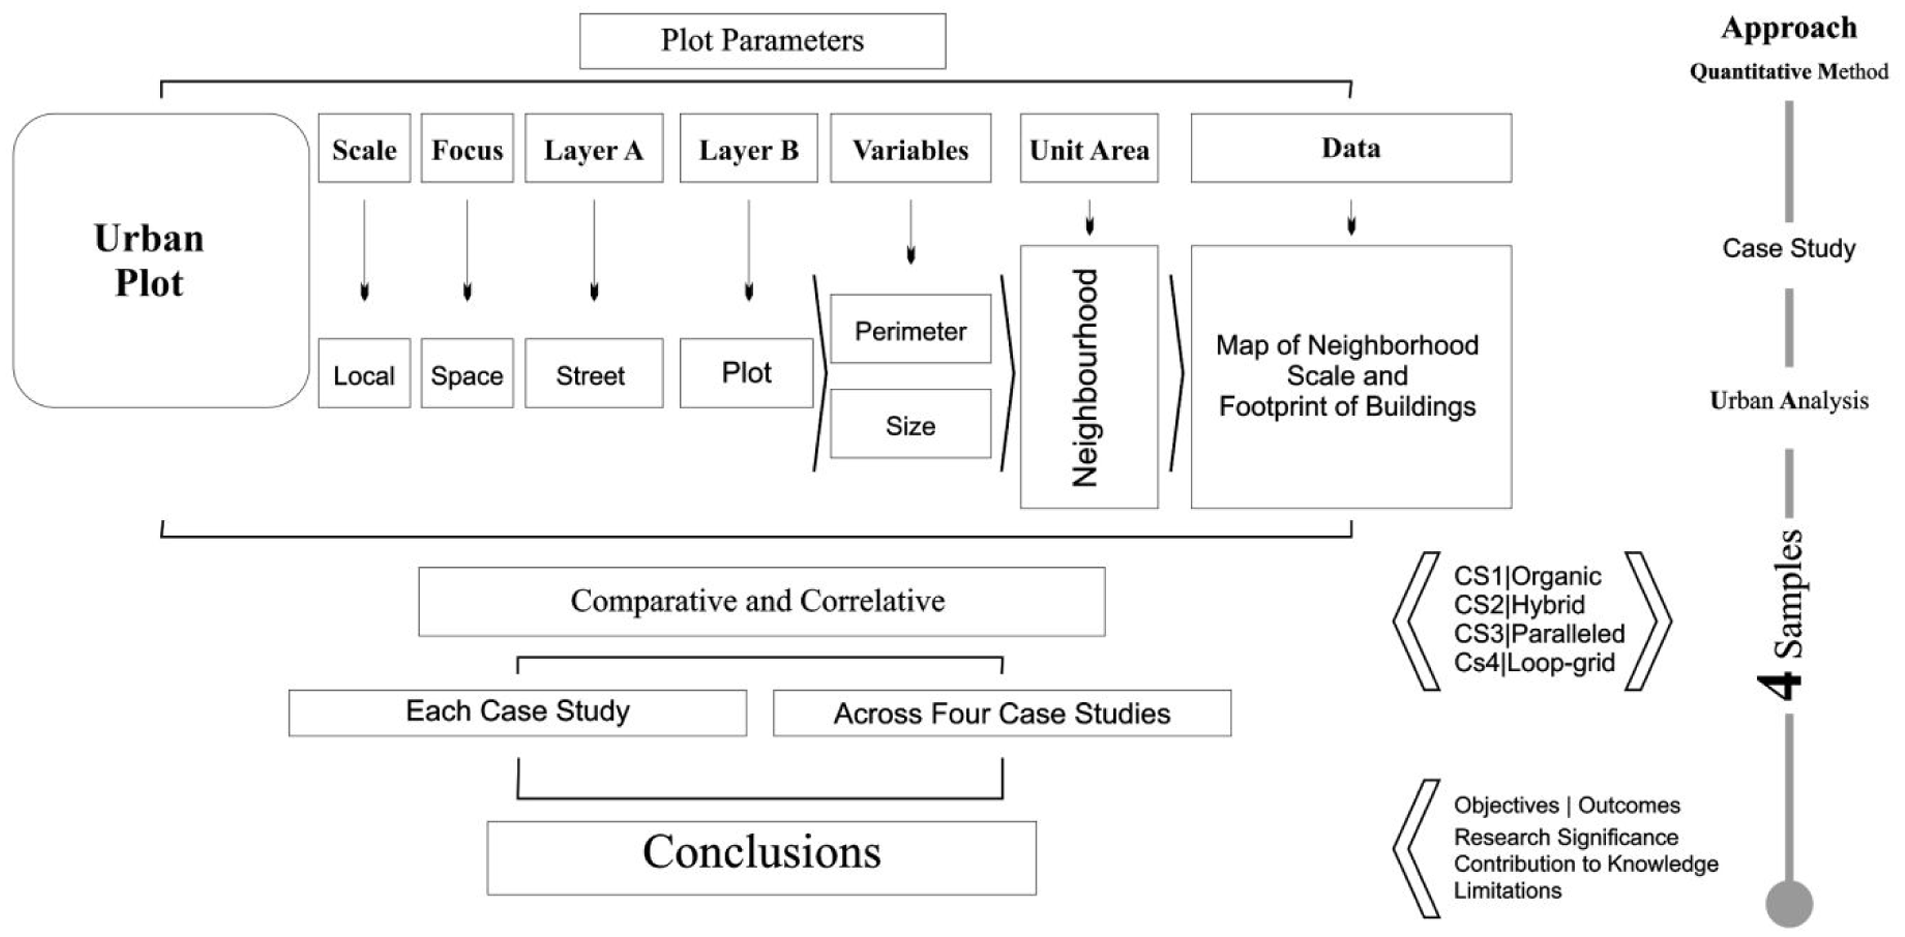
The structure of the research.
Research Methodology and Materials
Based on the burgage cycle Conzen (1960), this study assumes that a plot is one of the principal objects of urban form. Thus, the research adopts a cross-sectional quantitative method (case studies of four urban areas) that examines morphological characteristics at the micro level of urban form (plot). The study consider two parameters from the chosen samples that constitute the plot, perimeter and size; these represent significant characteristics on a micro-scale as they shape the morphological identity of the plot. Therefore, the research process map starts with inductive reasoning in order to capture the differentiation and similarities among selected neighbourhoods. The quantitative approach is crucial in comprehending knowledge about cityscapes on micro, macro, local, and global scales. Likewise, the micro level can be established on plot pattern criteria and the fine characteristics of the built environment.
The techniques and methods adopted enable the analysis and comparison of the four chosen urban areas. To measure the nominated parameters of the urban plots and their variables, different research tools are employed. These capture the fine characteristics of the plot pattern with regard to geometry and topology, and enable greater reliability and validity when measuring the parameters and variables of the four selected urban plots. In terms of the physical and spatial characteristics of the plots, the variables of two parameters (perimeter and size) are extracted and applied to an equation. All plot perimeters across the four selected areas are computed separately, and for classification purposes and statistical procedures, the study refers to a block as a boundary that surrounds a group of plots. To track the boundary of each plot, a georeferencing map with a high resolution was employed. This map provides one of the fundamental datasets to demarcate the plot’s polygon and was authorised by G.I.S. Department (Cartographer) (2016) and Remote Sensing and G.I.S. Unit (Cartographer) (2017). In this study, graphic programmes were created to sort and analyse the data, which included GIS-ArcMap 10.2.2, QGIS 2.18.3, and AutoCAD Map 3D 2021. Then, using primary statistical standards, the plot’s parameters were described and verified. Due to the considerable amount of data on the four areas, this paper employed a basic statistical method to compute the different values. Furthermore, the study also defined the selected urban area and analysed the plot pattern parameters.
However, due to critical security issues within the chosen neighbourhoods in Baghdad, it was necessary to secure permission to conduct the survey. Consequently, several official letters were sought and received by the author which proffered support. Moreover, some difficulties arose concerning whether to obtain official letters as it was essential to consider the bureaucratic procedures for site surveys and observations.
Defining the Selected Urban Area
Research can examine a phenomenon within its surrounding environment and/or isolated from its context. According to Yin (2014), the scale involves the examination of an existing phenomenon within a defined frontier between an event and its background. In this respect, an urban inquiry that examines all aspects of an unspecified area would be challenging and imprecise. Hence, it is necessary to define the study area by considering relevant criteria which focus on the environment and the research aim. The research examined several variables and multiple sources of evidence. Often, these variables tend to deal with quantitative rather than qualitative methods. Bourdic et al. (2012) recommended two scales to verify the borders of a case study area, which is subject to urban indicators. The first scale selects an area of 200 m × 200 m × 400 m × 400 m, while the second scale spans from one to four blocks (Figure 3). Both dimensions preserve the coherence and consistency of the urban context, where “morphological parameters are particularly increasing on the block scale and in urban configurations consisting of adjoining or homogenous buildings” (Salat, 2009 as cited in Bourdic et al. 2012, p. 594).
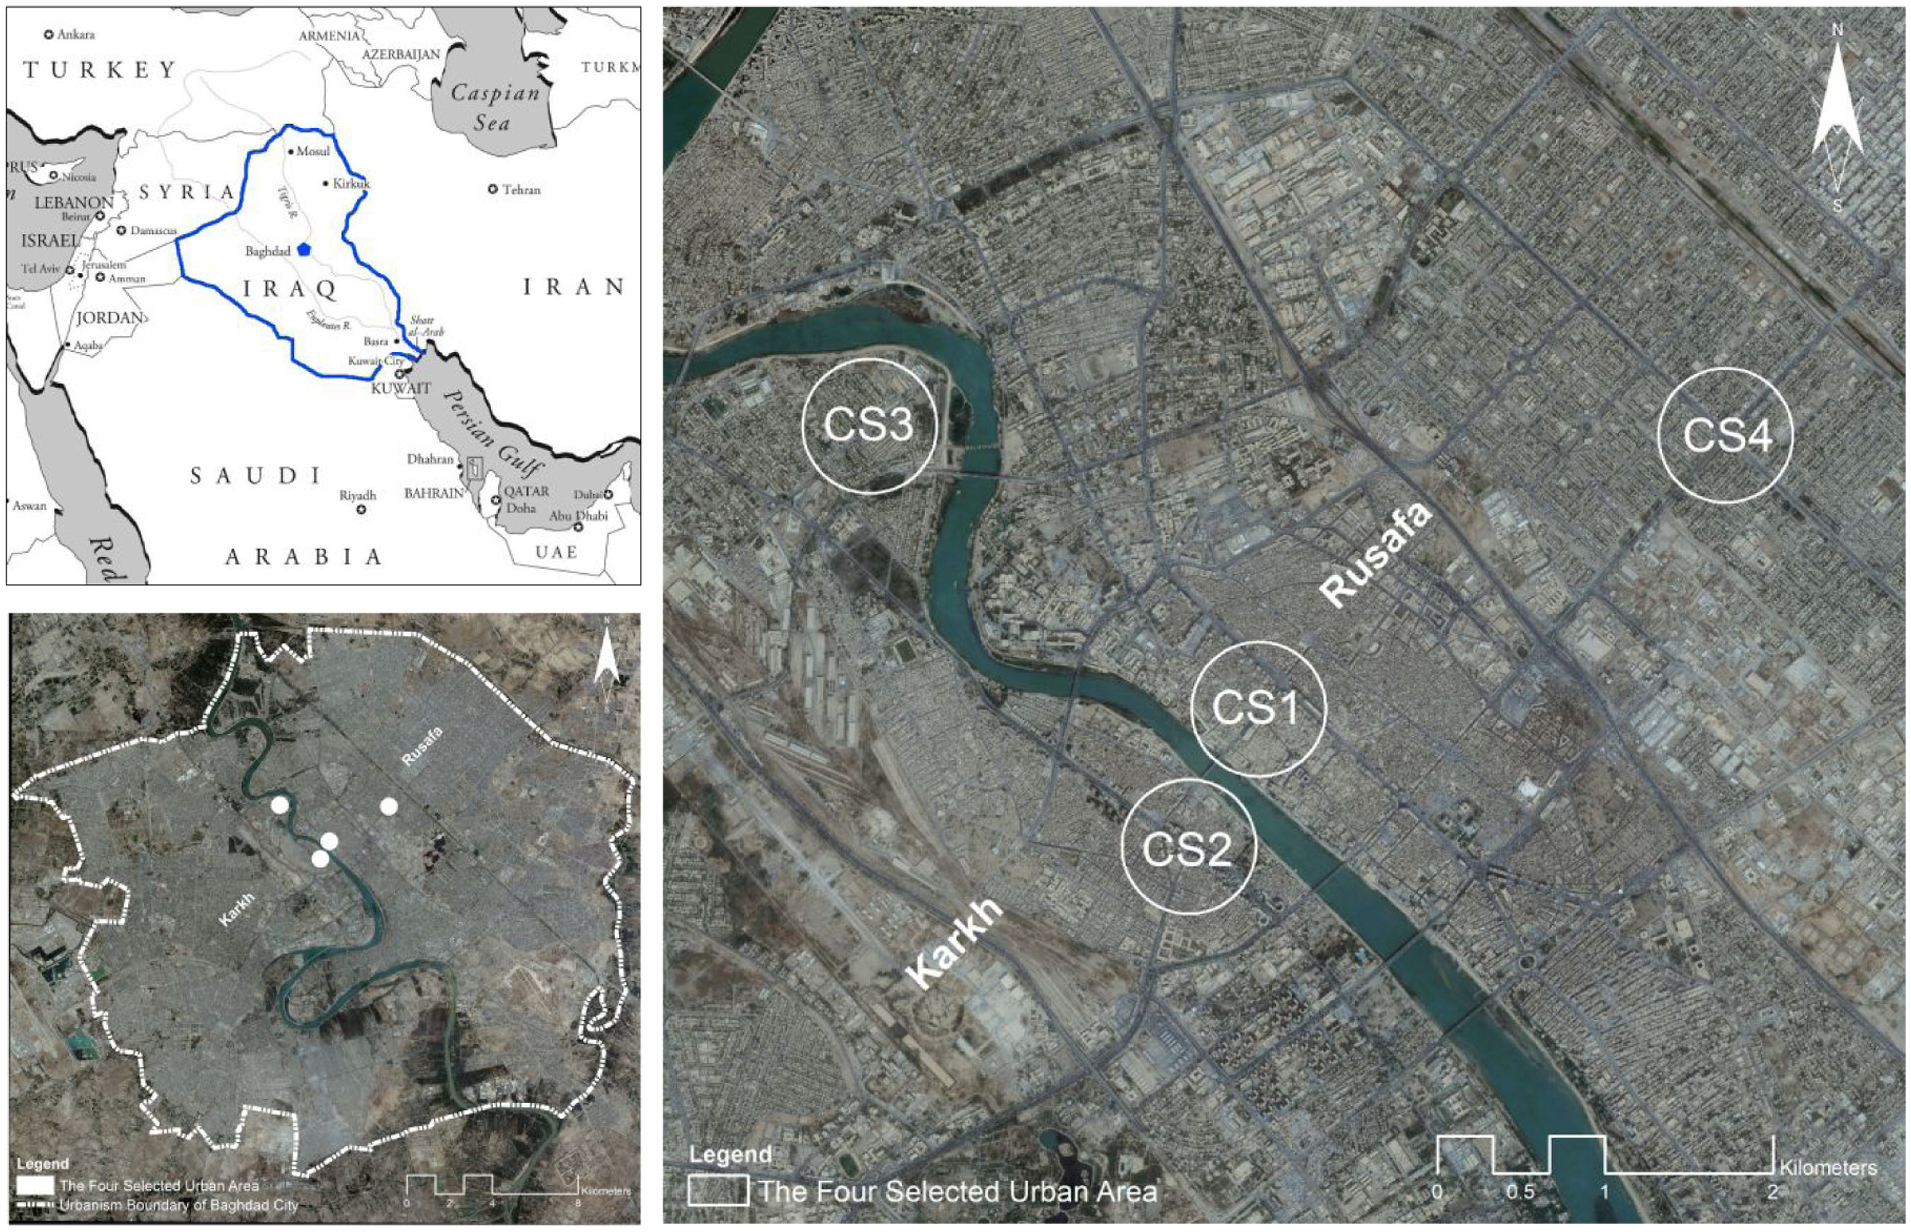
Georeferencing Satellite Imagery of Baghdad City illustrates the boundary of the case study area for the morphological analysis and the urbanism boundary (left) and includes the four selected urban areas (radius 400 m) (right).
For this study, the boundaries of the four selected areas are defined by a circle with a 400m radius. This is based on the commonly cited acceptable walking distance and signifies the threshold of a 5-min walk (Al-Saaidy, 2019b; Aultman-Hall et al., 1997; Mehaffy et al., 2010; Randall & Baetz, 2001; Remali, 2014; Tal & Handy, 2012). The case study of Bagdad involves four urban areas, namely: CS1 an organic pattern; CS2 a hybrid pattern; CS3 a paralleled pattern, and CS4 a loop-grid pattern. In Figure 3, it is possible to differentiate between the two fundamental elements of Baghdad’s city form, human settlement and the Tigris River, and the boundary of the selected areas. Diachronically, four samples of neighbourhoods are selected. The historical pattern (CS1) represents the oldest in the city, followed by CS2, CS3, and CS4. In Baghdad, most historical areas share the same characteristics, which is also reflected across Iraq as a country. In comparison, the contemporary neighbourhoods of Baghdad were formalized according to the concepts of modernism. Additionally, Figure 3 illustrates the four cases, each comprising a 400-m radius. The two maps (Figure 3) were authorised by (Remote Sensing and G.I.S. Unit (Cartographer), 2017).
Analysing the Plot Pattern Parameter
The plot covers a considerable number of indicators that define the physical characteristics of the built environment. These attributes play a key role in assessing connectivity and accessibility and enable people to move from one place to another. The plot signifies the smallest generative component of an urban form. It can be defined as an essential element that formulates a place’s spatial configuration. In this regard, plot analysis can be adopted to study the plot pattern according to two variables: perimeter and size.
The four selected cases—CS1, CS2, CS3, and CS4—exemplify a variety of plot types and patterns. From the old pattern (organic) and hybrid model to the paralleled and loop-grid patterns, there is considerable distinction between such plots in terms of their shape, dimension, and the way they are organised. To compute the plot values, this study used the overall area of the plots within a particular block. The ID names both the plot and block; for instance, AB1P1 represents the following: A signifies the case study where A = CS1; B identifies the block; 1 is the digit ID of the block; P is the plot; 1 is the number ID of the plot. This numbering system was applied to all cases to enable the tracking of each plot (Figures 4 –7, right).

An example of the numbering system used in case study CS1.
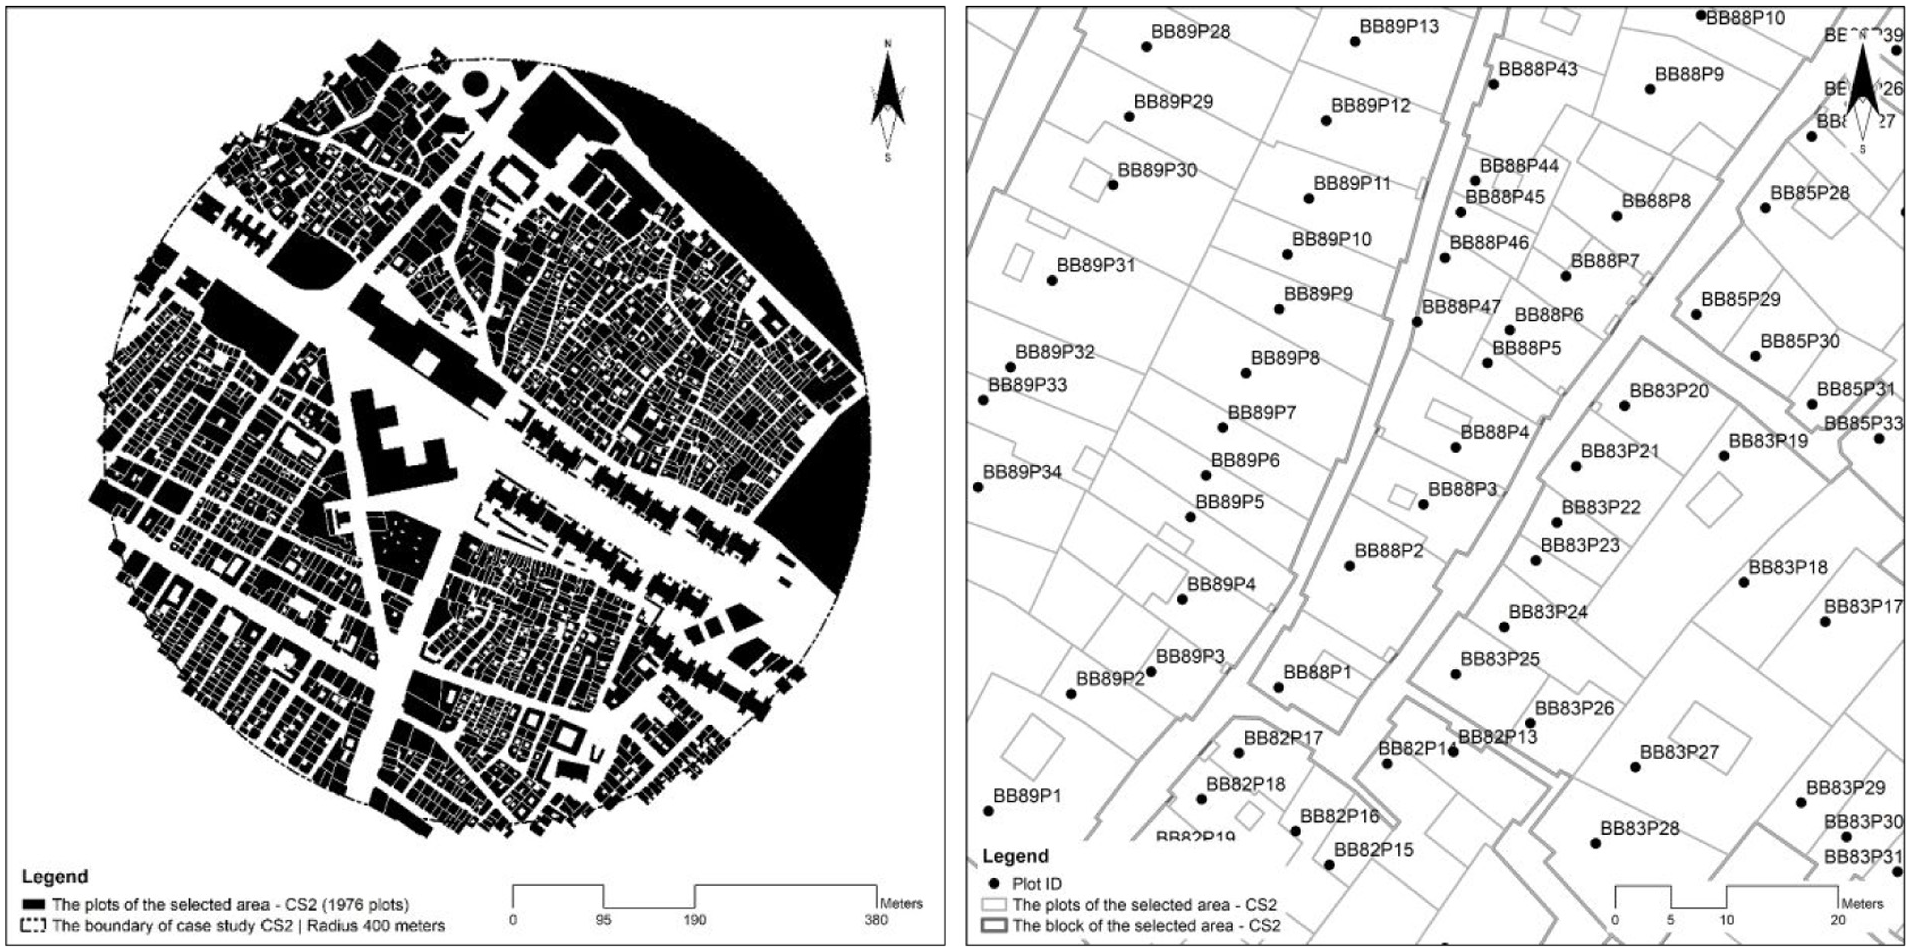
An illustration of the coding method employed in case study CS2.

A demonstration of the coding technique used in case study CS3.

A demonstration of the coding technique used in case study CS4.
Extracting the Quantity Characteristics of the Plot Parameters and Perimeter-Size
Before conducting the operational analysis, each plot was drawn and tabled; these tables show all related information, measurable content, and the plot ID (Tables 1–4). The tables list the values which define the plots’ characteristics across the four chosen neighbourhoods in Baghdad city. The plot pattern analysis helps regulate which patterns have greater arithmetic characteristics and higher parameter values than other patterns, which depends on the systematic and technical method applied.
Case Study CS1.

Note. The statistic of plots in a selected area—circle (radius 400 m with area 502,654.8246 m2).
Case Study CS2.

Note. The statistic of plots in a selected area—circle (radius 400 m with area 502,654.8246 m2).
Case Study CS3.

Note. The statistic of plots in a selected area—circle (radius 400 m with area 502,654.8246 m2).
Case Study CS4.
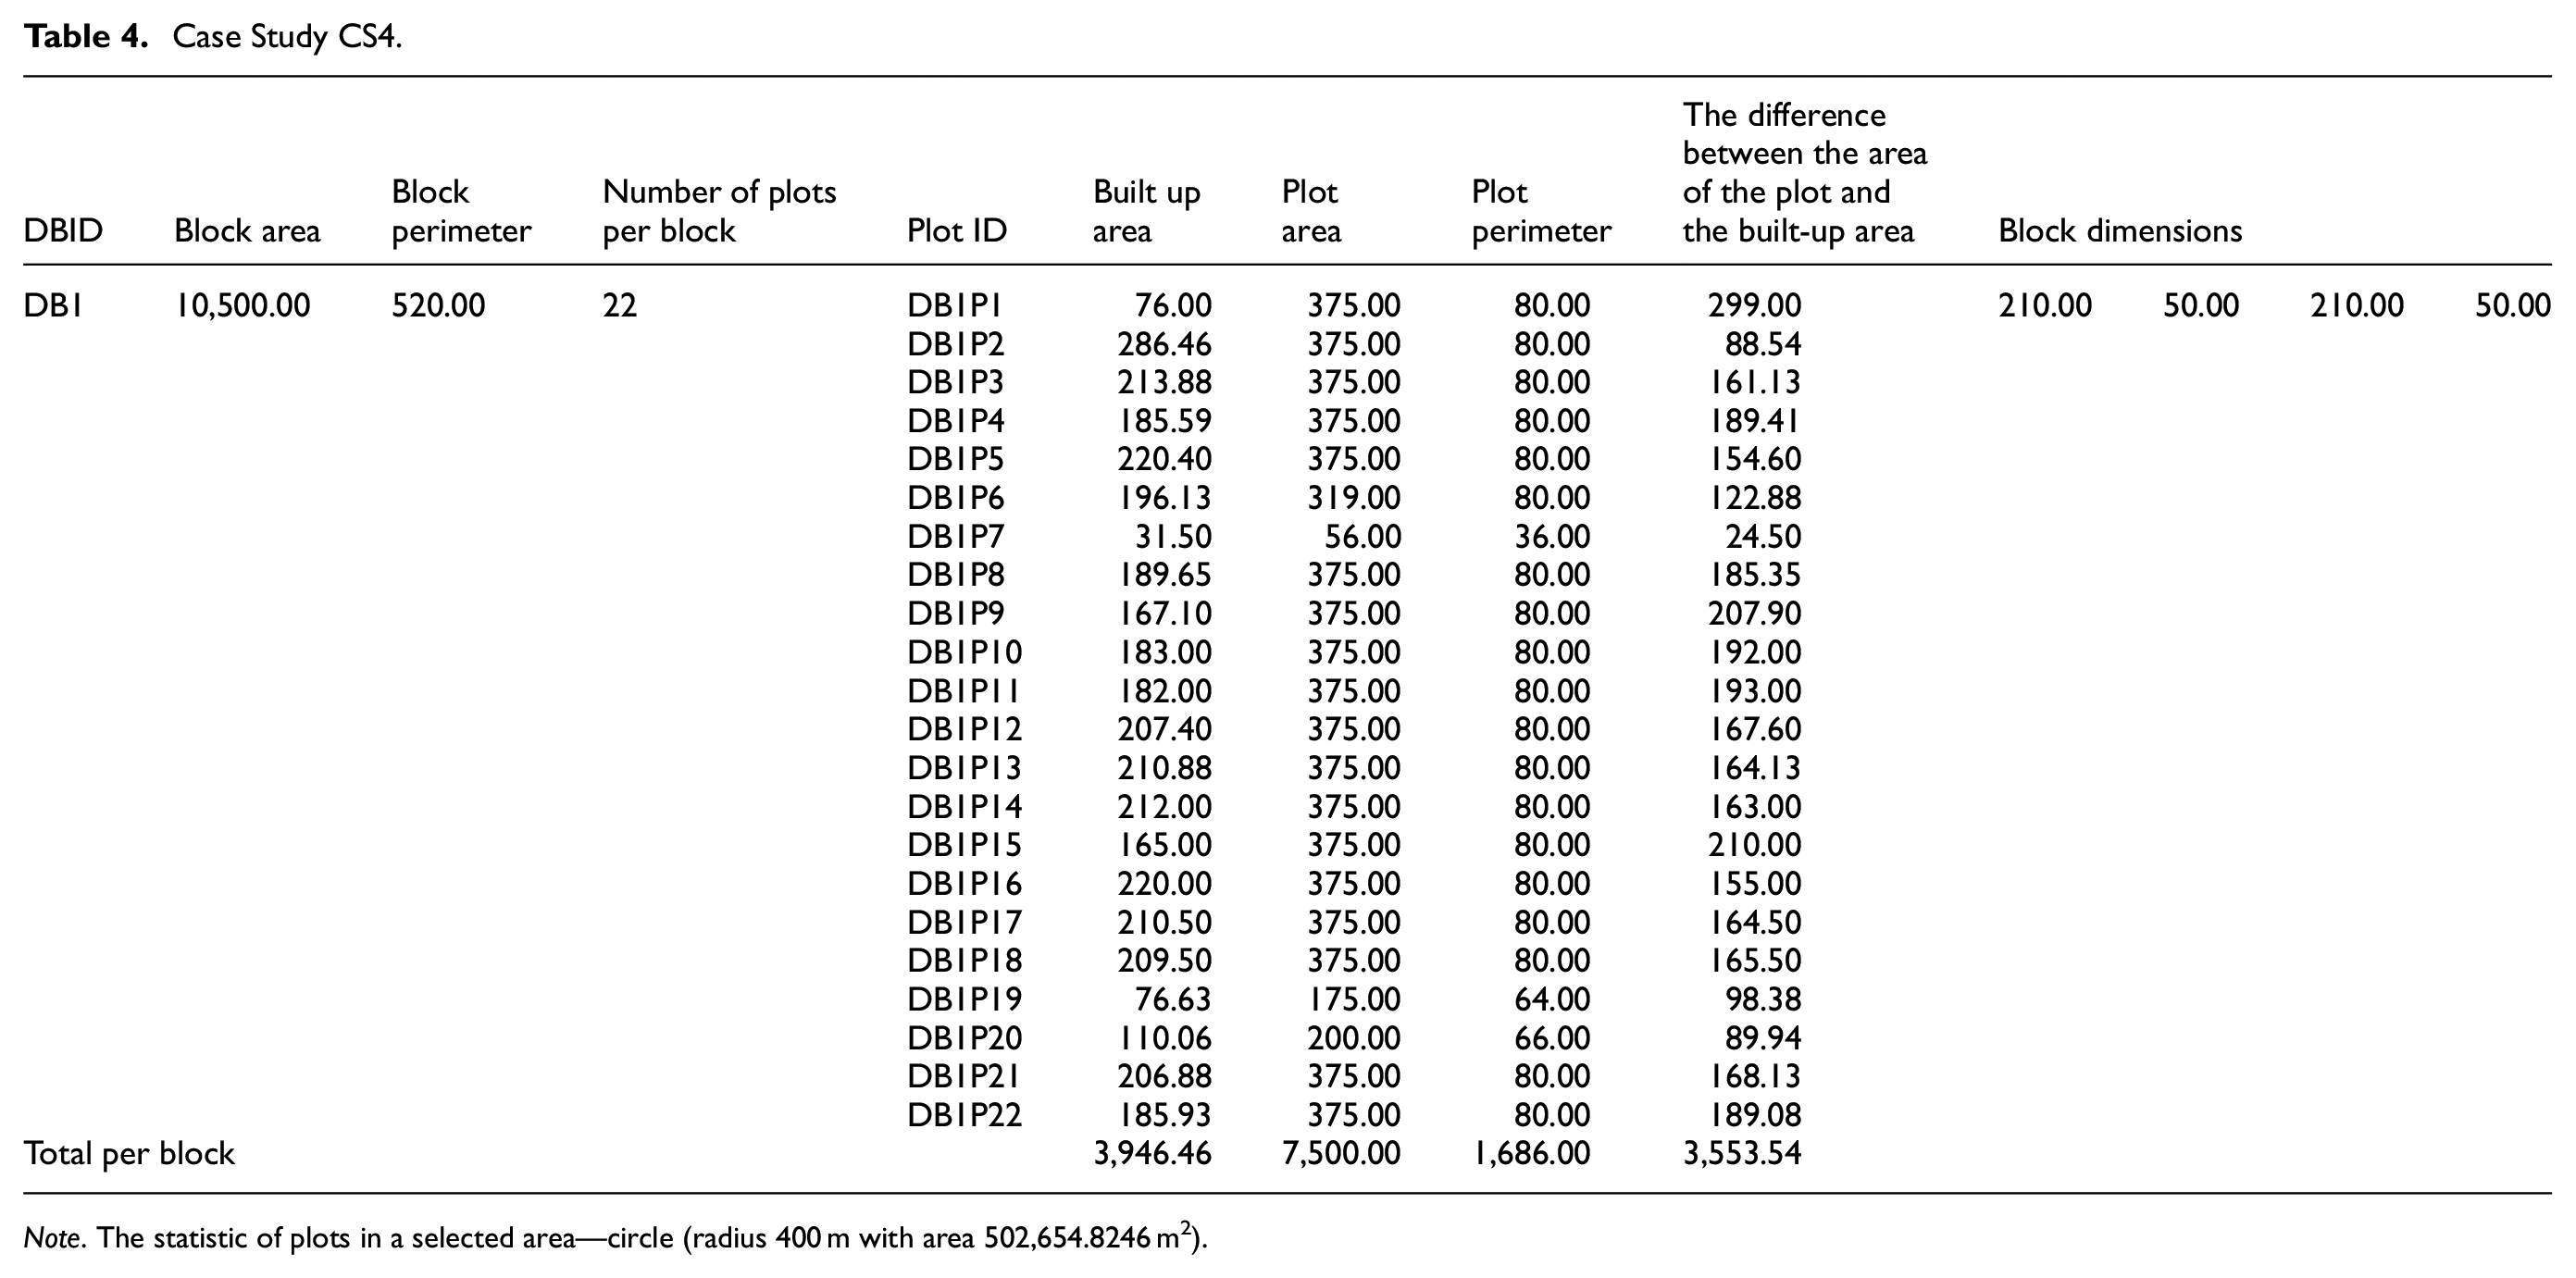
Note. The statistic of plots in a selected area—circle (radius 400 m with area 502,654.8246 m2).
Perimeter
Amongst the four samples, there are diverse plot sizes and shapes, and some comprise an irregular outline, such as those in the oldest zone of Baghdad, which are marked as CS1 (case study 1). Although in some studies, the perimeter is frequently demarked by blocks (Al-Saaidy, 2019b; Cervero & Kockelman, 1997; Remali, 2014), in this study, a perimeter is implemented to compute the disparity of blocks in terms of their capability to exert control. Therefore, the plot perimeter for this study involves all plots, whether they are located within the selected areas (400-m radius) or across the borders of cases.
The principle on which to calculate the perimeter is the sum of the value of each plot:

Where Pl is the perimeter per plot, PPl is the total perimeter value of the plots, and n is the number of plots. Each set of plots are organised within a block. Therefore, one block refers to the total perimeter of plots within it.
Case Study 1 (CS1)
The fringe side of the plot in sample CS1 is varied, and it is rare to find two identical plots together, even in the same block or alley. The arrangement of plots is spontaneous and subject to a bottom-up method. Therefore, the clustered irregular outline of plots precedes the formation of asymmetrical blocks (illustrated in Figure 8). The interrelationship between the contiguous plots mainly includes interlocked rather than adjacent edges. CS1 represents the most complicated area among the four samples; it exhibits a high plot density due to its quantity and shape, and its interlinkages are characterized as a crisscross pattern. Thus, there are 138 blocks and 1,753 plots within a 400-m radius.

Enlarged slice of sample CS1 to illuminate the interrelationship between plots. These are determined by the interlinked edges rather than the adjacent side. There is no observable module to employ in regulating the periphery of the plots, instead, each a new plot on the existing scheme shows a spontaneous and organic pattern.
The perimeter value for each plot has been calculated. The large number of plots in CS1 means splitting the perimeter across two levels: first, by grouping the plots according to their blocks and second, by making a comparison between all plot perimeters. Each plot is marked (Pn = Plot and number) and preceded by the case and block identification (ABn = case A, block B and number n). The results from applying the perimeter equation are illustrated in Figure 9.

Case CS1. The overall perimeter of the plots (1,753—2 riverbank) per block (138—2 riverbank). It illustrates a great disparity between the chosen blocks about the plot borders. Each block differs from the others in terms of the number of plots and their perimeters.
Fifteen blocks expand outside the sample, and plots are included that fall inside the frontier or intersect with it. These blocks are: AB14, AB43, AB44, AB47, AB48, AB58, AB62, AB63, AB64, AB126, AB129, AB130, AB131, AB133, AB134 (Figure 4, left). In CS1, there are 138 blocks (only two are excluded as they are adjacent to the riverbank) and 1,753 plots. The blocks include a diverse total number of plots; moreover, the plots also differ regarding their perimeter. According to Figure 9, CS1 demonstrates significant differentiation among its blocks, as each is a unique unit that includes a set of plots and differs from other surrounding neighbourhoods. Also, it exhibits the four values (minimum, median, average, and maximum) of the overall plot perimeter within the block. For one block, there is a considerable gap between the lowest (60.70 m) and highest (2,857.69 m) plot perimeter per block.
The total perimeter of CS1 is:

The total perimeter of 1,751 plots (excluding the two riverbank plots) within CS1 is 101,843.68 m.
Case Study 2 (CS2)
The plots in CS2 combine an irregular and a regular layout. In general, the plot pattern is less complicated than CS1, with the exception of the old area, which is like the traditional area of CS1 in the spatial structure of its plot arrangement. The remaining areas consist of plots that were created according to a planned scheme. The distinct line between the plots is a continuous, clear edge rather than interlocked like the traditional area. In CS2, there are 1,976 (– 1 riverbank) plots that are organized within 125 (– 1 riverbank) blocks (Figure 10). In this regard, CS2 is less complicated than CS1 due to its smaller traditional area.
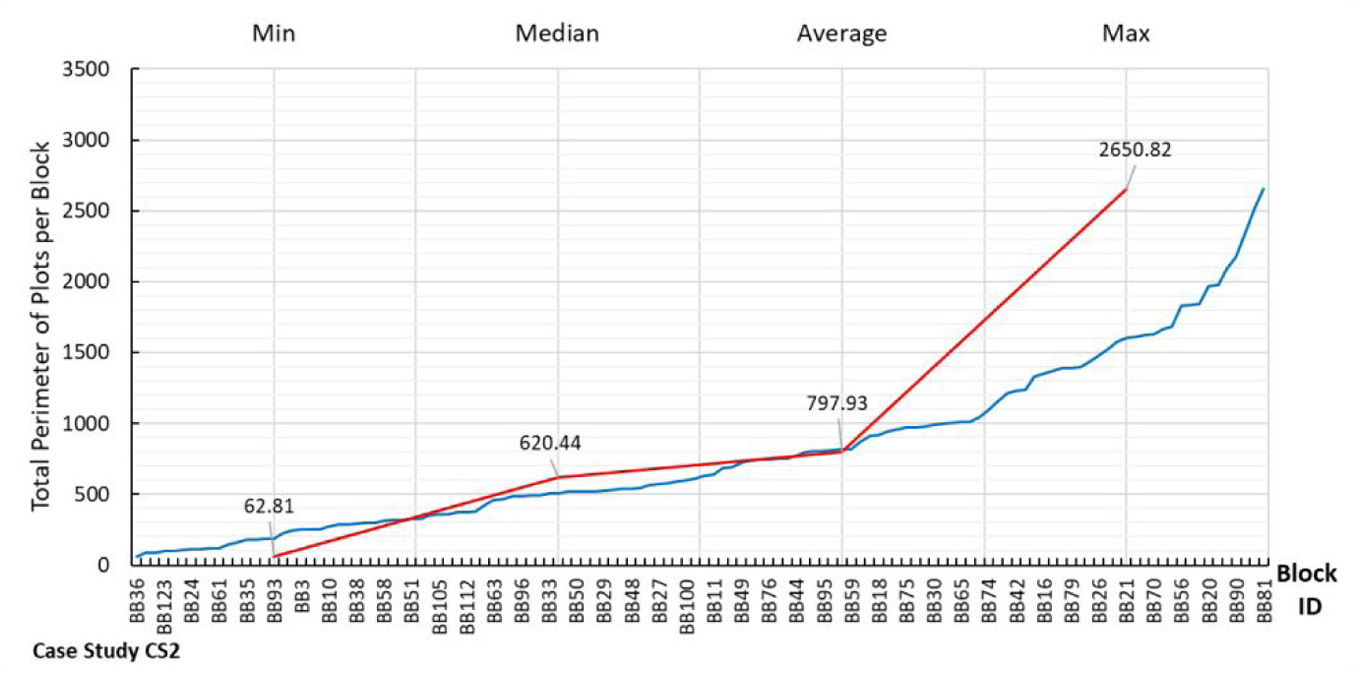
Case CS2. The total perimeter of 1,975 plots per 124 blocks. It displays a high variation between selected blocks around the plot edges.
By using the perimeter’s equation:

The computation of the plot’s perimeter depends on the block to which it belongs. Figure 10 demonstrates the perimeter of 1,975 plots which are marked by the block and plot ID. The four significant values to consider when examining a plot’s border are minimum, median, average, and maximum. As in CS1, the value difference between the smallest and greatest perimeter is substantial (62.81 and 2,650.82 m). This differentiation is due to the variety in block size, especially in the traditional area where there is no systematic block shape to encircle the group of plots, nor a uniform block size.
Fifteen of the blocks intersect the boundary of the case study, and some extend beyond the border; nevertheless, the plots that belong to the case study area are counted. These blocks are BB3, BB4, BB13, BB32, BB33, BB34, BB35, BB36, BB60, BB110, BB115, BB116, BB117, BB123, and BB125 (Figure 5, left). Typically, the total plot perimeter within these peripheral blocks does not cover all plots, as it omits those located on or intersecting with the border of the case study.
Case Study 3 (CS3)
CS3 can be classified as a “more advanced phase” than CS1 and CS2. The plot order is distinct; it is possible to determine the edges of a plot, while the separator line between any two contiguous plots is straight and uncomplicated. In this case, 849 plots are embedded within 49 blocks. The sizes of the plots are similar, whether in the same or different blocks. Additionally, the plot is a generative entity, and in this sample, it often maintains a regular shape. Hence, the block layout is more systematic than in CS1 and CS2. The number of plots per block varies, which alters the block dimension and the length and width proportions.
Based on the perimeter plot formula, significant values were recorded across 847 plots (two were excluded as they are outside the boundary), which were subjected to the four statistical operations, minimum, median, average, and maximum. Their values are 144.57, 1,037.66, 1,426.22, and 4,550.97 respectively, as shown in Figure 11.

The total quantity of plot perimeters in CS3 is 67,032.31 m (excluding the two plots encompassed by blocks CB47 and CB48, which are green areas). The variance between the lower and upper values (limits) is high. The smallest amount can be found amongst the peripheral blocks situated at the boundary of the case study due to the exclusion of the plots outside the border. In this example, there are 10 blocks, namely: CB5, CB23, CB34, CB36, CB38, CB39, CB40, CB43, CB44, and CB49 (Figure 6, left).

Case CS3 shows the considerable values across (849—2 green areas) plots that are subjected to four statistical standards (minimum, median, average, and maximum) and their values are 144.57, 1,037.66, 1,426.22, and 4,550.97, respectively.
Case Study 4 (CS4)
CS4 is the most recent of the four cases, where the plots are comparatively orderly, and their sides are designed to form regular blocks with equable proportions. The plot perimeters are distinctive, and combine to represent a contiguous plot via a straight edge, which differs from the sinuous lines within CS1 and CS2. The buildings tend to partially cover the plot area to sustain a considerable metric depth which offers an intermediate space between the street edge and buildings. In this example, there are 55 blocks and 11 green and open areas. Meanwhile, there are 720 plots excluding the 11 green area plots and undeveloped land; therefore, the total number of plots is 709.
For the perimeter plot, the results for the four standards (minimum, median, average, and maximum) are 205.79, 1,206.02, 1,353.99, and 3,470.70 m, respectively (Figure 12). Within its 400-m radius, the quantity of plots for CS4 is the lowest among the four samples. The difference between the smallest and greatest plot perimeters is notable, as reflected in the three cases above. In addition, the number of peripheral blocks is greater. The outline of CS4 is subjected to the plot-block order, and its arrangement illustrates the street network as a planned structure. Seventeen blocks extend beyond the border, while their plots are considered regardless of where they are located within the chosen area.

The total quantity of plot perimeters in CS4 is 60,929.60 m (excluding the 11 plots located within the green areas and undeveloped land) (Figure 7, left).

Case CS4 and its plots’ perimeter is around 60,929.60 m of 709 plots. The statistical standards are minimum (205.79), median (1,206.02), average (1,353.99), and maximum (3,470.70) m per block.
Size
The notion of plot size has been adopted by scholars, such as McGlynn et al. (1985), Hess et al. (1999), Marcus (2000), Reilly and Landis (2003), Dill (2004), Kim (2007), Bobkova et al. (2017), Marcus et al. (2017), Al-Saaidy (2019b), Berghauser Pont et al. (2019), and Bobkova et al. (2021). The plot maintains two kinds of size, plot area and built-up area, which can be determined throughout the four chosen samples. In this research, the plot size examines only the plot area where, morphologically, the plot signifies the smallest urban form element within the spatial configuration. The physical characteristics of the plot in terms of size, shape, and relationship to others has analytical value. By employing the two authorised maps, the four samples were analysed in detail after tracing the boundary of each plot and built-up area.
In this research, all plots were calculated regardless of land use; as such, both plot area and built-up area were calculated. Consequently, the value of the plot and built-up areas per block were computed using the following two equations:

Where P is plot, PA is plot area, and n is a number of plots

Where P is plot, PB is built-up plot area, and n is number of plots.
The aim was to differentiate between two significant values (the plot’s area and the built-up area of the plot per block) in a particular case and then across the four samples. The ratio was based on the assumption that an area is used regardless of the type of land use. The proportion of the two values is a simple index that can be formulated as:

Where RC is the ratio between the built-up area of the plot and the plot area itself, where both values are calculated per block.
Case Study 1 (CS1)
In CS1, the size of the plot is wide-ranging in terms of shape, and it has the highest number of zigzag edges. The built-up area dominates the total plot size, where the building is completely adjacent to the plot’s edges. CS1 contains 1,753 plots which are dispersed over 138 blocks involving open or green areas, and every block has a different number of plots. The two equations of plot size are:

The degree of coverage in CS1 is determined by the ratio between two values:

According to these calculations, CS1 has the most substantial covered area, which is derived from dividing two values—the built-up area and the plot area—as shown above. Moreover, Figure 13 shows the overall vacillation between the two values, indicating that the two trendlines are close and the disparity is minor.

The two trendlines: plot area and built-up area of sample CS1. It is calculated for each plot and then classified according to the block. The differentiation between the two values is small, where most buildings cover the plot area.
Case Study 2 (CS2)
This sample has different patterns in its plot-block system which determines the relationship between its plot size and built-up area. The oldest part of CS2 considers the degree of land coverage, while the ratio of plot area to building is mixed. CS2 contains 1,976 plots within 125 blocks; these cover all plots regardless of land use. According to the three equations, the results are as follows:

The degree of consumption for CS2 is calculated by the ratio between these two values:

The result shows that CS2 has a substantial covered area (70.81% of the total of plot area), but less than for CS1 (79.82% of the total plot area). In Figure 14, the relationship between the two values—plot area and covered size—fluctuates slightly, particularly within the large plot. However, across all CS2, both lines stand for a degree of rapprochement. This means the plot is often covered by buildings which means the private edges directly link with the public edge, and there are no intermediate spaces to separate inside and outside areas.

In sample CS2, the two trendlines (plot area and built-up area) are counted for each plot and arranged according to a particular block. The disparity between the two values, such as case CS1, is minor.
Case Study 3 (CS3)
In CS3, there are 849 plots and 49 blocks, and the area shows a more orderly plot-block system than CS1 and CS2. Nevertheless, it comprises a smaller number of plots and blocks. The values of plot size and covered area are calculated for each plot and then sorted per block. Moreover, in this case, the ratio of covered land varies.
Based on the three values—plot area, built-up area and the ratio between them—the results are as follows:


The ratio of coverage in CS3 was calculated by dividing the two values above:

An assessment of the plot and built-up areas is shown in Figure 15. The chart reveals a significant gap between the two standards; as such, most plots have been partially used by buildings. The metric depth in plots illustrates an increasing gap between the plot size and covered area. Additionally, a decrease in the ratio of land use is indicated, at 43.59%. This sample is subject to the plot-block system as per planned neighbourhood structures, which defines the relationship between the private and public edge.

In sample CS3, the chart shows a substantial gap between the two values of the area; as such, most plots have been partly covered by houses.
Case Study 4 (CS4)
CS4 denotes the loop-grid pattern for the spatial configuration of plots and blocks. The area consists of 55 blocks and 720 plots. In this respect, the case covers a smaller number of plots and blocks among four cases. Based on the three values—plot area, built-up area and the ratio between them—the results are:


The ratio of coverage in case study CS4 was computed by dividing the two values above:

The chart in Figure 16 illustrates a significant gap between the plot area and built-up area. In this example, most plots are moderately covered by buildings. The metric depth maximises the differentiation between plot size and covered area. Also, it leads to a decrease in the ratio of exploited land, at 48.93%.

The chart shows a significant gap between two values: plot area and built-up; in this instance most plots are moderately covered by buildings.
Discussion: Comparative and Relational Analysis of the Four Case Studies
The results can be interpreted from the analytical framework which encapsulates the results of this paper. The findings illustrate more significant considerations regarding plot parameters, specifically when comparing the historic core of Baghdad city and other more recent areas. It could be argued that the study represents an example of a significant grouping, whether in the number of plots per sample or the number of case studies (four neighbourhoods). A significant difference is apparent when comparing the total perimeter of plots per block among the four cases. Variety across these samples was identified as each case has a distinct number of blocks: CS1 (138-2 riverbank), CS2 (125-1 riverbank), CS3 (49-2 open areas), and CS4 (55-11 open areas). The total number of plots, whether per block or in one selected area, differs between the cases; for example, CS1 includes 1,753, CS2 has 1,976, CS3 has 849, and CS4 has 720 plots. According to Figures 17 and 18, sample CS3 contains a high value for the plot perimeter per block; however, it has a lower number of blocks than CS1 and CS2. CS4 has the second highest value for the total plot perimeter per block, as it is higher than CS1 and CS2, but lower than CS3. Thus, CS4 has a higher number of blocks than CS1 and CS2. As Figure 18 shows, the lines for both CS3 and CS4 are parallel. Excluding a few block numbers, CS1 has the lowest value in terms of plot perimeter. Nonetheless, this sample includes many blocks (136) and plots (1,751), although the boundary of the plot is small compared to the other three examples. In CS2, the trendline for the total plot perimeter per block is the third highest after CS4 and CS3, despite containing a high number of plots (1,975) and blocks (124). Additionally, the trendlines for CS1 and CS2 are relatively parallel. These two examples represent an organic and spontaneous spatial configuration, although CS2 also reflects a mixed pattern.

The evaluation among the four samples CS1, CS2, CS3, and CS4 in terms of plots’ perimeter. The trendline of each sample displays different perimeter values and tends to group two cases such as CS1 with CS2, and CS3 with CS4.

Comparative analysis of the four samples CS1, CS2, CS3 and CS4 in terms of the whole plots’ perimeter per block. A important diversity occurs among them, especially between the two group clusters, CS1, CS2 and CS3, CS4.
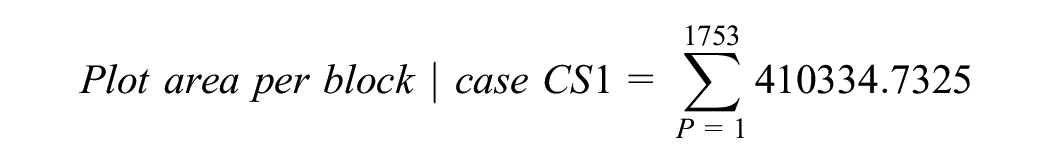
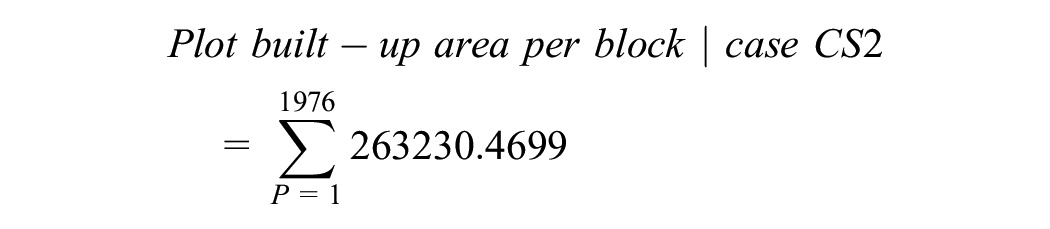
The trendlines for CS1 and CS2 seem equal, while the same occurs for CS3 and CS4. Generally, Figure 19 shows a considerable transformation from the traditional area of CS1 to the modern pattern of CS4 with CS2 and CS3 containing elements of the two patterns. In CS1, the plot area represents 410,334.73 m2 and represents the greatest value within a 400-m sample radius. CS3 has the second highest value with about 383,441.59 m2 plot area, followed by CS2 at 371,732.40 m2. Lastly, CS4 has the lowest total plot area at 332,882.43 m2. The trendline for the plot area in Figure 19 moves slightly from CS1 to CS4 through CS2 and CS3. For the built-up area, the trendline shows a significant decline from CS1 through to the other samples. CS1 attains 327,532.21 m2, while cases CS2, CS3, and CS4 reach 263,230.47, 167,130.73, and 162,880.44 m2, respectively. In CS3 and CS4, the difference between their built-up areas is low in comparison to the variation between CS1 and CS2 or CS1, CS3, and CS4 (Figure 20). Accordingly, the coverage ratio in the selected samples result from the dividing relationship between the built-up area and the plot area. CS1 records the highest rate at about 78.82%, meaning that the area is semi-covered by buildings, while CS4 records the lowest rate at just 48.93% coverage, where there is a high ratio of open areas and metric depths that separate the private and public edges. When comparing CS2 and CS3, the former has a greater value at around 70.81%, while the latter comprises around 43.59% of the coverage area. Furthermore, the descending line between CS1 and CS2 is slight, and their values are close. On the other hand, the decline between the first group CS1–CS2 and CS3–CS4 is steep, while the last two values—CS3 (paralleled pattern) and CS4 (loop-grid pattern)—also seem close (Figure 21).

Three lines that represent diverse standards of the overall plot area, coverage ratio, and overall built-up area. These standards are related to the four samples. The graph exhibits a considerable diversity among the selected samples: organic, mixed, paralleled, and loop-grid.

Plot area and comparison of the four cases. Each couple of samples CS1–CS2 and CS3–CS4 move together up to a point.

(Above) Plot area and comparison of the four cases and (below) the built-up area and comparison of the selected cases. Each couple of samples CS1–CS2 and CS3–CS4 move together up to a point.
From the comparison and relational analysis emerge the implications for knowledge, which is one of the contributions of this paper. Starting at the smallest entity of urban form (plot) could be classified as a milestone and a key start in understanding how the whole urban morphology materialised and grew over time. Historically, spontaneity and improvisation characterised the management of plots as generative units within the urban pattern; this followed the implicit processes of the community that shaped their order while regulations were also designed to meet their needs. This could be described as “plot-genetic planning” and was founded on a bottom-up approach. Thus, the plot originally governed the morphology of a city where blocks, streets, and the urban fabric later became dominant. In contrast, modern and contemporary neighbourhoods have been subject to a pre-planned system where the plot might represent the final step of the planning process, although this could be perceived as a top-down approach where the plot is a foregone conclusion. Thus, in modern planning, subtle geometric patterns tend to dominate, whereas in plot-genetic planning, the urban fabric can be characterised as an organic pattern.
From previous studies, C. Chen et al. (2024) highlighted a significant interrelationship between plot patterns and convenience for urban living. They found that the plot can be understood as an elementary unit for defined control when measuring urban quality and its influence on demand for convenience. Also, C. Chen et al. indicated that shape has a strong impact on small-scale plots, while division and intensity of construction within a block have a stronger influence on large-scale plots. In this regard, the current study shows that the historical area (CS1) has irregular plot patterns that allow for increases in the variety and distinction of plot characteristics and make the pattern more resilient and adaptable than the other three samples. Moreover, “the performance of plot patterns is essential, as it directly influences how urban spaces can be utilized most effectively to benefit residents’ daily lives” (C. Chen et al., 2024, p. 2).
Scholars have addressed the importance of comprehensively studying plots including the relationship between plot patterns and optimising the utilization of urban space by developing livable, business-friendly, and sustainable ecological patterns. Besides, plot patterns represent a manageable and controllable dimension and play a role in governing urban design, urban planning, land-use regulation, and infrastructure development, which in turn optimizes resource provision, promotes sustainable urban progress, and improves the overall livability of urban areas (Baker et al., 2021; C. Chen et al., 2024; Cordingley et al., 2015). The main concern with the historical plot is its compact pattern, as other regulations and urban policies cannot accommodate the mechanism for plot generation in this type of urban form. While for the other patterns (CS3 and CS4), this issue might be under control and involve a manageable process, for the mixed plot sample (CS2) there is a need to authorize applicable and controllable regulations to manage the urban pattern. However, this approach could be successful when utilizing plots, as this elementary operational unit permits a rational spatial pattern that is linked to a human-centric trend and aligned with morphological criteria (Araldi & Fusco, 2019).
The importance of plot characteristics has mostly been discussed by scholars and based on different objectives, research scopes, and trends. Efeoglu et al. (2023) explored plot patterns of the retail landscape by employing three dependent variables- distribution, agglomeration, and diversity—to consider independent morphological variables, namely, plot size, plot frontage ratio, angular integration of the plot, angular betweenness of the plot, and plot frequency. They found that the principal elements of spatial capacity for a sustainable retail system were the shape and location of plots, which play a key role in formulating the pattern and the spatial capacity of plots, which contributes to the vitality and viability of a space. Also, the results identified that an increased subdivision of land into plots with small sizes and low frontage ratios can create conducive spatial conditions for street-based retail activities. This allows for high connectivity and betweenness centrality on a neighbourhood scale and can promote the street as an ecosystem for retail activity (Efeoglu et al., 2023). The current research found that each selected neighbourhood (CS3, CS4) has a distinct plot pattern with a unified form which also partially features in the sample (CS2). On the other hand, CS1 involves a significant plot pattern that varies in shape, location, size, and even the adjacent relationship to each other. The tessellation of such a historical pattern (CS1) has the highest value in terms of size and perimeter, and this urban area is likely to offer potency and latent order when developing and promoting urban vitality and sustaining street life. In comparison, the other three cases (CS2. CS3, and CS4), may require further attention when considering the main regulations and land-use criteria due to their plot pattern. As CS2, CS3, and CS4 already exist, they could help to diagnose dysfunctional patterns and how to effectively address the street edge and social life.
Venerandi et al. referred to the interrelationship between plot patterns as urban form and socioeconomics. Their study particularly highlighted the organic pattern as its characteristics are similar to the other naturally-occurring patterns such as CS1. The greatest variety in plot pattern can mostly be seen in the historical centre of a city and is typically characterised by different sizes and perimeters, cardinal orientations, and direct alignments with the street edge. The heterogeneous fabric of such a historical area plays a key role in increasing density, proximity, connectivity, and complexity (Venerandi et al., 2024). This historical-organic pattern developed informally, in a piecemeal fashion, through the plot-based densification processes which occurred over time. However, this tends to differ with most modern and contemporary urban tissue that develops through up-down procedures, which create less compact and dense plots (Venerandi et al., 2024). This modern pattern phenomenon was witnessed in CS3, CS4, and partially in CS2. Although this does not mean the historical area is valued less than other, more modern urban patterns, rather its properties and morphological characteristics offer a map from which to benefit from its advantages and urban design standards.
Research Scope: Rationale, Objectives, and Limitations
It is necessary to understand the fine characteristics of urban form and its ingredients across different morphological patterns, particularly when studying old and traditional patterns which emerged spontaneously as opposed to more recent pre-planned strategies. Two principal limitations—time and place—influence the research design; time governs the research process and its scope, while the four selected samples in Baghdad provide the spatial parameters which reflect the distinct morphological pattern of the chosen areas. Therefore, based on a case study approach, this study examines four chosen neighbourhoods with different characteristics, which include the historical area of Baghdad city and other more recent, modern areas. The aim is to comprehend the differentiation among the four selected urban areas, as each sample represents a different morphological pattern. Moreover, one of the designated samples represents a more complicated morphological pattern where it is rare to find two identical plots together, even in the same block or alley. The layout of any plot derives from a spontaneous bottom-up approach rather than a pre-planned scheme. Subsequently, the groups of irregular shaped plots comprise asymmetrical blocks.
Also, the interrelatedness of the neighbouring plots frequently comprise interlocked edges rather than straight adjoining edge. Moreover, this sample shows a high density of plots in terms of quantity and shape compared to other case studies. It reflects the level of interlinkage between plots, which is represented as a crisscross pattern. This paper’s objectives are to comprehend the old pattern of Baghdad city, and to compare this with other chosen urban areas to explore the relationship between the variables and confirm their level of interrelationship, demonstrate changes in the morphological pattern, and determine the association between the plot, block, and street network. One of the limitations of adopting only two plot variables is the unique nature of the selected historic urban area as the nominated parameters may not be appropriate and applicable to other urban patterns which may impact wider generalisation. While the mathematic technique employed in conjunction with GIS can deliver quantifiable information, this will not entirely capture the qualitative features. In the historical area, there is a strong association between plot layout and building print, while in modern neighbourhoods, this association is unnecessary. This is why only two parameters were chosen to examine the plot’s characteristics: perimeter and size. In addition, to generate georeferencing digital maps the author has used aerial maps, satellite imagery, and paper maps. However, the generation process was more complicated for the historical core of Baghdad, due to the irregular plot layout and the effort required to track each property.
Moreover, adopting two plot parameters in this study does not prevent the study of other indicators, as the digital map of the chosen area could be used to extract more variables and parameters in future research. Other parameters could be examined to determine how they could affect other dependent factors, such as the accessibility and connectivity of urban tissue, which in turn could influence the vitality of urban life. Likewise, the perimeter and size of the plot could, to a large extent, affect the walkability, permeability, and visual consistency of streets. Furthermore, with their multiplicity of land uses and building types plot characteristics contribute significantly to the increased liveability of the neighbourhood. It could be argued that the outcomes of the study may be generalizable to other cities, regardless of whether they closely reflect the selected pattern for this research. Including other plot parameters or identifying correlations with other variables (dependent, independent) within the built environment could help to enhance urban form and urban life. Comparing the four selected neighbourhoods of Baghdad helps to understand the plot as the smallest ingredient of urban tissue and the points of convergence and difference between the spontaneous urban pattern and other patterns of areas which were subjected to the pre-planned order.
The selection of the perimeter and the quantitative method will be further discussed for each plot. After Baghdad was invaded in 2003, changes occurred to most plot parameters (perimeter, shape, size, cover area). This led to the restructuring of land use beyond any orders, regulations, or policies. Moreover, as enforced interventions, the transformations to urban morphology focused on the micro-level, namely the plot and street scale. In turn, changes to the microdomain contributed dramatically to the metamorphosis of both block and neighbourhood characteristics.
Implications for Procedures and Forthcoming Research
The current study could significantly support key beneficiaries, such as decision-makers, planners, urbanists, and architects, who deal with the fine ingredients of urban form (plot). These specialists should have knowledge and experience of not only most modern urban patterns but also the historical areas of Baghdad. Understanding an asset area deeply rooted in the historical pattern helps to identify how to sustain and develop such a traditional pattern. To optimise the different aspects of urban trends like sustainability, resilience, vitality, and the 15-min neighbourhood, it is necessary to be aware of the fine characteristics of the plot, in particular, the historical pattern. Also, there is a critical point situated between the historic zone and its adjacent neighbourhoods that could be perceived as a fluctuating zone and intermediate space without a distinct urban identity. For this reason, articulation spaces between Baghdad’s old city centre and other urban patterns should be considered in any urban development.
However, this would probably not occur if the historical area is considered from a single, more traditional perspective. Instead, further and deeper analysis of the underlying layers of historical patterns means additional research into the different aspects of these patterns from a multi-perspective. The comparison among the four selected samples is significant in deriving other parameters and variables and weighing the priority of each parameter. While the first trigger for the analytical processes of urban patterns is the historical zone of Baghdad, this does not imply it is not generalisable or likely to be used to adjust to other urban patterns. To further benefit from the plot characteristics and how that varies among the chosen neighbourhoods, future studies could adopt other case studies to examine more variables and parameters. Also, they could capture both independent (plot parameters) and dependent features (urban life, e.g.) as other correlated factors. The current study, however, does not exclusively focus on the geography of the whole city of Baghdad or on the spatial distribution of certain urban form characteristics but rather on the distinctive patterns of the historical pattern of the city centre and how that compares with the three other selected patterns.
Conclusion
This paper addressed one of the primary elements of urban form—the plot—across four selected areas in Baghdad: CS1 (organic pattern), CS2 (hybrid pattern), CS3 (paralleled pattern), and CS4 (loop-grid pattern). It focused on the metric characteristics of plot, and the analysis considered the indicators of perimeter and size. The study highlighted the significant differences among these indicators across the four samples. The traditional part of the city (CS1) exhibits more exceptional values as its spatial configuration follows a spontaneous plot pattern, which responds to the implied and inherent order of the community. Due to its bottom-up approach in developing the plot layout, a substantial variety in plot size and plot perimeter is evident, which subsequently affects the block size and block perimeter. CS2 (hybrid pattern) also includes a significant variety in plot size and perimeter, although it also represents the new era of development, which significantly affects its plot size. The values of CS1 and CS2 are close as both have the highest quantity of plots at 1,753 and 1,976, respectively.
The pre-planned order distinguishes CS3 and CS4, where urban areas are subject to a top-down approach in the development of plot layout. Therefore, there is less variety regarding plot perimeter and plot size than CS1 and CS2, while the regularity of plots affects other elements of the urban form like the block. There are fewer plots in CS3 and CS4 than CS1 and CS2, as CS3 consists of 849 plots, while CS4 has 709. Thus, the plot analysis illustrates a significant disparity between the four samples. The difference in plot was apparent between the historical, spontaneously ordered area (CS1) and the modern areas, which followed a pre-planned system. Plot perimeter and size play a critical role in formulating the block pattern, while the transformation of the urban structure from traditional to modern affects the block parameters. Consequently, the plot is acknowledged as a miniature generative unit in the urban structure, and the specific order of plots shape the urban block, whether spontaneous or planned, organic or geometrical.
It would be difficult to deliberately develop a new morphological pattern that echoes a spontaneous, organic pattern like CS1, as this approach emerged gradually and is therefore distinct from the prepared, planned schemes. Baghdad city’s historical and traditional core was based on standard human requirements such as walking distances, the human scale, ecological aspects, and the norms and ethics of the community. These criteria informed the plot parameters of traditional urban patterns but could be updated to influence the formulation of new principles and regulations to improve existing neighbourhoods or generate new metropolitan areas.
Future researchers could apply this method with more case studies to analyse different morphological patterns across a range of cities. Also, future studies could incorporate a larger dataset by examining other plot parameters, while opportunities could be taken to correlate plot against other urban parameters that include socioeconomic characteristics, social activities, and behavioural settings. Moreover, land use could be considered in future studies as it plays a significant role in formulating different movements.
Generally, future studies could focus on more recent trends in urban design such as the concept of a 15-min city. This would offer valuable opportunities to examine the fine characteristics of urban fabric in relation to micro-functional patterns. However, it is essential to understand a city on the micro-scale and how this could support its people. Moreover, there is a need to comprehend the significant but minor differences between traditional patterns and modern structures as this influences the physical environment and its functional patterns and shapes people’s responses to different urban characteristics. Furthermore, future studies could focus on the sustainability of traditional historic urban forms compared with the modern pattern of a city. This would help to identify and understand the key indicators of urban sustainability and the mechanisms used when developing a metropolitan area.
The main contribution of such the paper is the examination of plot-derived urban form by quantifying the plot characteristics of different urban patterns in Baghdad, Iraq using specific samples of urban fabric. Despite the particularity of the cases to Baghdad, the findings could be generalised to capture the different characteristics of urban form across cities globally, especially those formed by traditional patterns. Expanding the case study samples to other cities in different countries would help to formulate a framework of multiple parameters, variables, and indicators of urban plot, which could help to direct the strategies of decision-makers and stakeholders towards a bottom-up approach. Moreover, plot represents the smallest generative unit of urban form to establish a sustainable scheme for the whole. It also enables the study of interrelationships between different plot patterns and other aspects of urban development such as vitality, resilience, and the criteria for a 15-min neighbourhood. The study reduces the gap between different plot patterns and, (1) other urban morphological elements (block, street, building), and (2) other urban trends such as human-oriented development and plot-centred approaches. In fact, the current study could significantly help different beneficiaries, such as planners, urbanists, architects, decision-makers, and stakeholders, focus on the soft ingredients of urban morphology. Furthermore, as urban policy is likely to be a critical point in helping countries achieve their Human Development Index (HDI), which is not a mere indicator for measuring a developed or developing country, but rather related to the built environment.
Footnotes
Funding
The author received no financial support for the research, authorship, and/or publication of this article.
Declaration of Conflicting Interests
The author declared no potential conflicts of interest with respect to the research, authorship, and/or publication of this article.
Data Availability Statement
Data sharing not applicable to this article as no datasets were generated or analysed during the current study.