
Abstract
This paper assessed the adoption intensity of CSA practices and their effect on food security among farming households in Guna Begemider district, South Gonder Zone, Ethiopia. A semi-structured questionnaire was administered among 217 randomly selected households from four kebeles of the district. Food security was measured in two ways; per capita calories (as a continuous variable) and the daily minimum dietary energy requirement for an average adult to function actively (dummy variable with a cut point at 2,100 kcal). Descriptive analysis, multiple linear regression and binary logistic regression were employed to analyse the data. The study found that the great majority of the households adopted CSA practices and the average adoption intensity was 7 out of the 19 practices. The average daily per capita dietary energy was 2,130.21 kcal with a minimum of 352.18 kcal and a maximum of 7,456.03 kcal. However, about 59.45% of the households live below the minimum daily calorie requirements (2,100 kcal). Adoption intensity of CSA practices and agricultural experience were found to have a positive effect on food security both in measurements of per capita calories and daily minimum dietary energy requirement. On the contrary, household size and kebele of residence showed a significant but negative effect on food security in both measurements. The study concludes that adopting a layer of CSA practices can make a crucial contribution to address the potential impact of climate change on agriculture and food security.
Plain Language Summary
The purpose of this study is to assess the adoption intensity of climate smart agriculture (CSA) practices and its effect on food security among farming households in Guna Begemider district, South Gonder Zone, Ethiopia. Semi-structured questionnaire was administered among randomly selected 217 households. Food security was measured into two ways; per capita calorie and daily minimum dietary energy requirement for an average adult to function actively. Descriptive and regression analysis were employed to analyse the data. The study revealed that most households adopted multiple CSA practices to establish a shield from the effect of climate variability and change through a layer of practices. Such layer of CSA practices (adoption intensity) in turn positively and significantly affected food security. Capacity building (training) and location-specific CSA practices are thus needed to enable accelerate adoption of multiple CSA practices that can meaningfully increase food security. Although the study captured CSA adoption intensity through the frequency of multiple CSA practices adopted by household, further study is recommended to capture intensity in other forms and its link with food security.
Introduction
Climate change continues to be one of the threats of the 21st century, given its tremendous social, environmental, and economic impacts. Agrarian communities are the most vulnerable social groups to the consequences of climate change which has continued to pose higher risks to agricultural production and food insecurity (FAO, 2017). Agriculture today stands at a critical juncture in the face of climate change and increasing food demand from a growing global population projected to grow from 7.8 billion to 9.9 billion by 2050 (FAO & IFAD, 2019). While agriculture constitutes the larger share of employment by providing earnings to some 2.6 billion people worldwide, it is one of the most vulnerable sectors and a significant contributor to climate change (World Bank, 2016).
Today’s industrial agriculture is producing a large amount of food for global markets at high environmental expenses due to the input-intensive crop monocultures and industrial-scale animal feed production (IPES-Food, 2016). Paradoxically, despite the rise in food production, food insecurity has continued to be a global issue, and the number of people affected by hunger has been slowly on the rise since 2014, and the trend is more noticeable in Africa (FAO et al., 2020). Food insecurity is a common phenomenon in Africa and the problem is severe when it comes to Ethiopia, where millions of people are annually affected by food shortages due to climate calamities and environmental degradation.
Agriculture is the mainstay of the Ethiopian economy. It contributes to 33.9% of the gross domestic product (GDP) and employs 66% of the population (FAO, 2020). In Ethiopian agriculture, climate change has a high degree of influence since it affects the two most important direct agricultural production inputs, namely, rainfall and temperature (Amede et al., 2015). Heavy reliance on rain-fed systems has made the sector particularly vulnerable to climate variability in general and unpredictable rains and droughts in particular. In some years, the complete failure of seasonal rains in drought-prone regions is linked to climate change (Ministry of Foreign Affairs, 2018). The country is also characterized by low agricultural production and productivity mainly attributed to traditional production systems and environmental factors such as soil erosion, land degradation, and pest incidence (Jirata et al., 2016). It is projected that climate change may decrease the nation’s GDP by 8% to 10% by 2050. On the other hand, adaptation actions could cut climate shock-related loss of livelihood and damage by half, and thus food shortage could be mitigated (CIAT & USAID, 2017).
There is a wider recognition that increasing food security, while building resilience to climate change, requires shifting to a climate smart agricultural production system. Such a shift involves promoting agricultural practices that are more productive, use inputs more efficiently, have more stability in production, and are more resilient to risks, shocks, and long-term climate variability (FAO, 2017). Climate Smart Agriculture (CSA), which emerged as a path for connecting agriculture with climate change (Newell & Taylor, 2018), aims to achieve three interrelated objectives (pillars), namely, increasing agricultural productivity and income (food security), enhancing adaptation and building resilience to climate change, and reducing or removing greenhouse gases (GHGs) where possible (FAO, 2014, 2021).
Given these interrelated objectives, CSA has gained attention in the policy and institutional sphere of Ethiopia. Although there is no direct mention of CSA in the country’s Climate Resilient Green Economy (CRGE) Strategy, it is taken as a crucial part of the country’s effort to reduce climate impacts and help build a more resilient, food-secure, and economically competitive agricultural sector. Further, CSA is mentioned in the national adaptation plan, as one of the actions to reduce vulnerability to the impacts of climate change by building adaptive capacity and resilience (Federal Democratic Republic of Ethiopia, 2019). The strategy envisions Ethiopia to become a carbon-neutral middle-income country by 2025, and institutions that facilitate the implementation of various CSA interventions are in place (CIAT & USAID, 2017; Eshete et al., 2020). However, the adaptation rate of CSA in Ethiopia is still low and equally challenged due to a lack of tools, capacity, and experience (Jirata et al., 2016).
Various researches around the globe show the importance of CSA in enhancing production and productivity. De Pinto et al. (2020) reported that the widespread adoption of CSA practices can contribute to increasing agricultural production while improving soil fertility and reducing GHG emissions. Similarly, McCarthy et al. (2011) indicated the benefits of various CSA practices such as an increase in food production and adaptive capacity of food production systems, and a reduction in emissions or enhancement in carbon storage in agricultural soils and bio-mass. From a different perspective, Terdoo and Adekola (2014) showed that CSA has a strong effect in aspects of sustainable use of natural resources while it was found to be weak in areas of compensation and equal distribution of benefits and costs. In Ethiopia, Kifle (2021) showed that the adoption of CSA practices contributed to both farm income and household food availability. Similarly, Zerssa et al. (2021) noted CSA’s contribution to increasing food security. However, they stated that smallholder farmers’ adoption of CSA practices is limited. This limitation is mainly linked to the shrinking of farmland over time, land tenure issues, lack of adequate knowledge about CSA, slow return on investments, and insufficient policy and implementation mechanisms.
Although studies of CSA in Ethiopia are emerging, there is a huge gap in understanding the adoption rate of CSA, its contribution to food security and income, resilience, and emission reduction. This might not be unique to Ethiopia but it is a feature of other developing countries where emission and adaptation accountings are weak.
As stated above, the adaptation rate of CSA practices in Ethiopia is low (Jirata et al., 2016; Zerssa et al., 2021). Jirata et al. (2016) further stated that CSA data in Ethiopia are insufficient at all levels and there is a lack of adequate research findings on CSA practices for the various agro-ecologies. On the other hand, CSA is not a set of practices that can be universally applied, but rather it is an approach that involves different elements that are embedded in specific contexts and tailored to meet local needs and thus requires site-specific assessments to identify suitable agricultural production technologies and practices (FAO, 2013). Ethiopia is a country with diverse agroecologies comprised of 49 agroecological zones (Ministry of Agriculture, 1998). Given the country’s high level of agroclimatic diversity, existing empirical studies on CSA practices for the different agroecological zones and socioeconomic conditions are insufficient (FAO, 2017).
Furthermore, the existing CSA adoption studies worldwide are fundamentally inclined towards capturing CSA practices merely as a dichotomous variable (adopted or not) while largely ignoring the adoption intensity and its effect on food security. Sharma et al. (2011) indicated that many existing studies model technology adoption using a dichotomous variable but it is not appropriate to do so as it is the combination of technologies employed that matters rather than as a simple dichotomous choice. This is particularly the case when it comes to CSA as a recently emerging agricultural strategy in the face of climate change, where studies of adoption choice are scarce let alone adaptation intensity of CSA. Nowadays, farmers adopt several CSA strategies or practices in search of a better-layered shield from the intensified impacts of climate change and extreme events. In such an increasing trend among farmers, it is flawed to capture CSA adoption as a dummy adoption choice rather than a reflection of several practices. In light of these research gaps (CSA’s location specificity, adoption intensity, and its effect on food security), this research intends to contribute to the empirical literature on CSA by assessing the adoption intensity of CSA practices and their effect on food security, which is rarely studied in the past.
Literature Review
Climate smart agriculture (CSA) is a concept framed following the recognition of climate change’s likely intensification of existing production constraints and the difficulties it imposes on feeding the growing population. This called for agriculture to transform itself to feed the population, and serve as a basis for economic growth and poverty reduction in the face of climate change (FAO, 2013). Although the practices of CSA existed before, FAO (2010) is credited for coining the concept and defined it as an agriculture that sustainably increases productivity, enhances resilience (adaptation), reduces greenhouse gases emission (mitigation), and enhances the attainment of national food security and development goals. Similarly, Lipper et al., (2014, p. 1068) defined CSA as “an approach for transforming and reorienting agricultural systems to support food security under the new realities of climate change.” FAO (2013, 2021) further described CSA encompassing three main objectives (pillars), namely, sustainably increasing agricultural productivity and income; adapting and building resilience to climate change; and reducing and/or removing greenhouse gas emissions, where possible.
Since its introduction, the idea has evolved and reshaped through the involvement and interactions of the many parties engaged in its development and execution (Lipper & Zilberman, 2018). Nevertheless, there are still debates that revolve around the role of agricultural mitigation and its funding in developing nations, the deployment of agricultural development technologies, agricultural approaches to be climate smart, the absence of clear guidelines and relationship between the objectives of CSA, the role of CSA in addressing social equity and justice, and the possibility of business-as-usual industrial agriculture designed to serve the interests of agribusiness and the financial industry (Alexander, 2019; Chandra et al., 2017; Lipper & Zilberman, 2018; Neufeldt et al., 2013; Newell & Taylor, 2018; Saj et al., 2017; Totin et al., 2018).
Despite these debates and disagreements, CSA has attracted a wider attention both domestically and internationally with the intention of reorienting agricultural systems to support food security under the new realities of climate change (Rani & Reddy, 2023). It involves conceiving agriculture to be resistant to a changing climate while keeping it viable in the long term, and shaping it to be resilient while providing mitigation benefits (Arslan et al., 2015; Katel et al., 2022). With the view of finding locally relevant solutions, it aims to address the disputes without trying to prescribe universal solutions, and its usefulness and practicality will ultimately be assessed by how well it integrates climate change response efforts into local sustainable agricultural development actions (Lipper & Zilberman, 2018). In line with this, FAO (2013, 2019) indicated that CSA is not a single globally applicable agriculture technology or technique but it is a strategy that necessitates site-specific assessments to determine the best agricultural production technologies and procedures in the localities. By integrating climate-resilient practices and technologies into local contexts, CSA seeks to enhance the resilience of farming systems to climate change, thereby contributing to improved food production and security, food affordability, poverty reduction, and environmental preservation (Adebisi et al., 2022; Ali et al., 2022; Katel et al., 2022; Rani & Reddy, 2023; Scherr et al., 2012; Steenwerth et al., 2014). Even if CSA targets to attain the three objectives, it does not presuppose every solution (practices and technologies) in all locations generating triple wins; rather the comparative importance of each objective and solution should be viewed in the context of localities and the possible synergies and trade-off between the objectives (Lipper et al., 2014).
It is guided by this framework (CSA practices are local and site-specific) that this study assesses the effect of CSA practices on food security. CSA practices include technologies and practices that are expected to enhance productivity, income and food security, contribute to adaptation, and reduce GHG emissions, wherever possible. The practices in Ethiopian context encompass a range of practices which include composting, mulching, use of improved varieties, precise fertilizer and bio-fertilizer application, crop rotation and intercropping, reduced tillage, rainwater harvesting, plant nutrient management, integrated crop-livestock management, integrated watershed management, integrated soil fertility management, integrated pest management, conservation agriculture, agroforestry, crop residue management, sustainable land management, and improved livestock feed and rangeland management (Belay et al., 2023; CIAT & USAID, 2017; Jirata et al., 2016; Teklewold et al., 2018).
Materials and Methods
Description of the Study Area
The study was conducted in Guna Begemider woreda (district), South Gonder Zone of Amhara region, Ethiopia. It is one of the 10 districts of South Gonder Zone created after splitting from Farta district in 2016. The district has 17 rural kebeles (the lowest administrative units in Ethiopia) and 1 urban kebele. Kimir Dingay, the capital of the district, is about 100 km north of the regional capital, Bahir Dar (Amhara Region), and 690 km North of Addis Ababa. The location of the district is between 110 40’ North latitudes and 380 45’ East Longitude and it is bordered on the south by Este district; on the west by Farta district; on the north by Ebenat district; and on the east by Lay Gayint district (Plan Commission, 2013). The average annual rainfall of the district is higher than the national average, which is 815.83 mm while the temperature is lower than the national average, which is 22.61°C (World Bank, 2021). The district has a total population of 109,518 among which, 49.07% are females.
The topography of Guna ranges from mountainous to foot plains with an altitude range of 2,600 to 4,230 m above sea level. Mixed farming (crop production and livestock rearing) is the major farming activity of the district. There are seasonal and recurrent streams in the district that contribute to the Tekeze River, one of the major tributaries of the Nile River. The district is generally characterized as food insecure, although its agroecology is favourable for diverse agricultural production and it is one of the regularly cultivated areas in South Gonder Zone (Plan Commission, 2013). Teff, barley, wheat, maize, beans, sorghum, chickpea, lentils, and peas are among the major types of crops grown in Guna district (Kasalem, 2019; Figure 1).

Map of Guna Begemider district.
Sampling Technique and Data Collection Instruments
Multiple stages of sampling were employed to draw sample kebeles and households. First, to determine the sample size of the study, Yamane’s (1967) statistical formula was adopted.

Where n is the sample size (household), N is the total household in the district, and e is the level of precision.
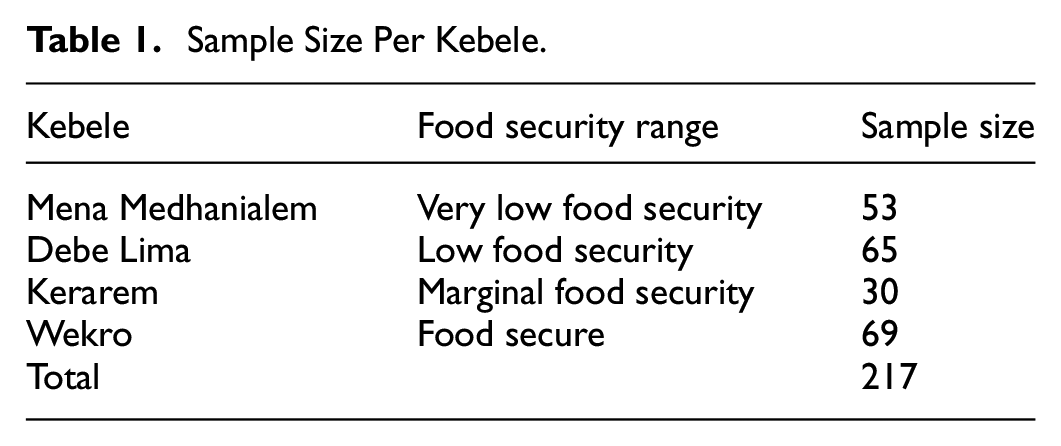
Using the above formula, with a sampling size precision level of 7%, the minimum household sample size became 202. By assuming 10% for contingency, up to 222 households were considered for the survey. Second, based on information from the district, all of the 17 rural kebeles were stratified into four categories as very low food secure, low food secure, marginally food secure, and food secure. Using stratified random sampling, one kebele from each stratum was selected to ensure a better representation of the district. Then, the sample size of the households in each kebele was taken using proportional sampling and data was secured from 217 households. The number of sample households in each kebele is shown in Table 1 below.
Sample Size Per Kebele.
A semi-structured questionnaire was administered to collect socioeconomic and agriculture related data from the sampled households. The questionnaire was translated into Amharic and data was collected with the full consent of the respondents. In addition to the survey questionnaire, a focus group discussion was held with 12 members of the peasant association (8 men and 4 women; 3 from each sample kebele) which were selected based on their designation in the association (chairperson, secretary, and member) to further discuss on CSA.
Method of Data Analysis
Descriptive statistics were used to summarize and compare data and analyse the level of CSA adoption intensity among farming households and describe general demographic, socioeconomic, and institutional characteristics of the respondents. To achieve the main objective of the study (the effect of adoption intensity of CSA practices on food security) econometric analysis was employed. Accordingly, multiple linear and logistic regression models were employed.
Measurement of Food Security
Although various indicators to measure food security are available in the literature, there is no consensus among scholars (Manikas et al., 2023). Kilocalorie is the most frequent sole measurement of food security used in low and middle income countries by employing a uniform caloric threshold (Cardell et al., 2024; Manikas et al., 2023). This measurement of food security is even regarded as one of the gold standards for measuring food security (World Food Programme, 2008). In this study, food security was measured through kilocalorie availability and was captured in two ways; in kilocalorie per capita, as a continuous variable, and as a dummy variable (constructed based on kilocalorie per capita cut point at a minimum of 2,100 kcal required by a person).
Per Capita Kilo Calories (kcal Per Capita)
A useful indicator of food availability is the per capita dietary energy supply measured in kilocalories (kcal), which is the measure of the average daily food available to each person in a household (FAO/WHO, 1998). To quantify the per capita food availability at household level, the household food balance model was adopted (Tolossa, 2002) and measured based on the annual major crops grown in the study area and consumed by the households. The household food balance model is expressed as follows:

Where,
NGA: Net grain available per year per household
TGP: Total grain produced per year per household
TGB: Total grain bought per year per household
QFA: Quantity of food aid obtained per year per household
TGG: Total grain obtained through gift per year per household
PHL: Post-harvest loss per year
QGU: Quantity of grain reserved for seed per year per household
AGS: Amount of grain sold per year per household
AGV: Amount of grain given to others within a year
The net food grain available was computed based on the data collected on the households’ annual available food grain using the above model to find the balance between grains gained and lost. This net food grain available was then converted into its equivalent dietary calories based on the Ethiopian Health and Nutrition Research Institute’s (EHNRI) food composition table. The converted results were then divided by household size and days of the year to get available calories (dietary energy) per day per member of the household (per capita calories), and by doing so food availability, as a proxy indicator of food security, was captured as a continuous variable.
Food Security as a Dummy
This measurement was used to categorize households as food secure and food insecure based on the per capita kilocalorie calculated as indicated above. According to World Food Programme (2018), an average adult requires 2,100 kcal to carry out basic body functions, and thus 2,100 kcal is used as a cut-off level for classifying households into food secure and food insecure. Hence, households with greater than or equal to 2,100 kcal/day/person were categorized as food secure, and if less than 2,100 kcal, then the households were categorized as food insecure (food poverty households). With a cut point of 2,100 kcal, food poverty headcount ratio, food poverty gap/depth, and severity were calculated using the Foster-Greer-Thorbecke (FGT) equation, given as:

Where P is the food poverty index; Yp is the minimum adult equivalent daily calorie requirement per person (2,100.00 kcal); Yi is the kcal of the poor person; and N is the total sample size. When α takes 0, it provides the headcount index, and when it takes 1 and 2, it yields food poverty gap and severity of food poverty, respectively.
This measurement and categorization (capturing food security as a dummy with a cut point at 2,100 kcal per day per person) has several limitations. First, it assumes all members of the household, regardless of sex and age, require an equal amount of calorie requirements. Second, the cut point at 2,100 kcal is also arbitrary and might differ from society to society. For instance, categorizing a person with a kilo calorie of 2,099 as food insecure, and another person with 2,100 kcal under food security, only with a difference of 1 kcal, is less convincing. In light of these limitations, this measurement of food security (as a dummy) was thus supplemented with a continuous variable, per capita kilo calories, described above.
Measurement of Adoption Intensity
In this study, 19 CSA practices were recorded among farmers (Appendix 3). In the literature, adoption intensity is measured basically in two ways; by farm area coverage of technologies and practices, and the frequency of technologies and practices. Capturing adoption intensity in the context of climate change adaptation or adoption of CSA strategies through farm area coverage is less practical as farmers apply most of the adaptive strategies in the total land that they possess, and thus less likely to have variability in adoption intensity. In light of such practice, the total number of strategies adopted by households was taken to measure adoption intensity. As stated by Isgina et al. (2008), using the total number of technologies as a measure of adoption intensity has been a common practice in the literature. Thus, following Isgina et al. (2008), Kolady et al. (2021), Lohr and Park (2002), Nkegbe and Shankar (2014), and Sharma et al. (2011), adoption intensity in this study was captured through the number or frequency of CSA practices adopted by households.
Specification of the Models
Multiple linear regression was employed to predict the effect of CSA practices’ adoption intensity on per capita calories. This model was chosen because the regression analysis helps to describe how the change in adoption intensity of CSA practices (independent variable) is related to a change in the per capita calories (dependent variable) while controlling other relevant independent variables. The model is given by:

Where,
Description of the Variables.

Binary logistic regression was employed to predict the effects of CSA adoption intensity on food security. As stated above, food security, in this instance, is binary (dichotomous) which takes 0 (food insecure) or 1 (food secure), and thus requires an application of either logit or probit regression models. However, logit is preferred over probit due to the relative simplicity of the equation and its direct interpretability as log-odds.
Accordingly, the following logit mode is built for the analysis and prediction of the outcome variable, food security.

Where, Pi is the probability of the household being food secure; Xi is a set of explanatory variables of the ith household; β0 is an intercept; and β1 is a vector of parameters. For simplicity, replacing β0 + β1Xi in Equation 2 provides Equation 3:

The possibility of being food insecure (1 − Pi) can thus be depicted as:

From the above two equations, the odds ratio in favour of food security could thus be:

By adding the disturbance term (

X1, X2, X3… Xn are independent variables affecting food security of the household. These variables are listed in Table 2. The variables in both models (multiple linear and logistic regressions) were selected based on previous empirical studies.
Results and Discussion
Demographic, Socioeconomic, and Institutional Characteristics of Respondents
Of the total sampled households, 81.1% were male-headed households, while women-headed households accounted for 18.9% (Appendix 1). The average age was 47.7 years, while the average household size of the respondents was 5.1. The average household size is slightly higher than the national average, which is 4.6 (Population Reference Bureau, 2020). Whereas, households were composed of three working age group members on average. Concerning education (ability to read or write), 41.0% of the respondents were literate either being exposed to non-formal or formal education, while 58.0% were illiterate and cannot read and write.
The average landholding size among the households was 0.89 hectares, which is very slightly smaller than the national level of 0.96 hectares (Headey et al., 2014). The average TLU was 3.38 per household. Although rural households in Ethiopia are dependent on agriculture, about 12.2% of the respondents in the study area were engaging in non-farm economic activities. Households maintained an average contact of three times per cropping season with extension agents. The majority of the households (65.6%) did have access to credit services. However, a smaller portion of the respondents (35.5%) were members of cooperatives or farmers’ union, and only 36.3% and 24.7% had regular access to weather information and market information, respectively. In terms of self-reported food security status, the majority of the sampled households (56.6%) lived under food shortage.
Food Availability and Status of Food Security in the Study Area
Among the food crops, wheat constituted the highest dietary energy supply for the households with a 36.2% contribution, barley comes second at 27.6%, teff third with 17.3%, and maize with a dietary energy contribution of 10.2% is fourth. Beans, chickpea, lentils, and peas constituted the least contribution to dietary energy in the study area (the detail is presented in Appendix 2).
As shown in Table 3 below, the average daily per capita dietary energy per household member stood at 2,130.21 kcal with a minimum of 352.18 kcal and a maximum of 7,456.03 kcal. This average value is slightly higher than the daily minimum requirement for an average adult to function actively (2,100 kcal; World Food Programme, 2018). The incidence of food poverty was 59.5%, that is, 59.5% of households lived below the minimum daily calorie requirement (2,100 kcal) while 40.6% got equal to or above 2,100 kcal. This shows that the majority of the sample households did not have sufficient food and enough dietary energy required by an average person to function. This result aligns with the results of the descriptive statistics, which showed 56.6% of the sample households encountering food shortages (Appendix 2).
Food Poverty Among the Households.

Source. Own survey (2021).
On the other hand, the average daily per capita dietary energy per household member among the food insecure households (living under food poverty) was 1,321.6 kcal. The depth of food poverty (average normalized food poverty gap [FGT1]) was 22%, that is, on average, the poor had calorie shortage of 22% of the minimum dietary energy requirement. In other words, on top of the current level of daily consumption by the poor, an additional 462.8 kcal per day per household member is required to eliminate food poverty (to bring them to the food poverty line). Whereas, the level of severity of food poverty (average squared normalized poverty gap) was 10.7%. This index places higher weight on the poor who are further away from the food poverty line and it is used to show the level of severity of food poverty and inequality among the poor. Thus, the result shows 10.7% kcal intake inequality among the poor household members, which is very high within the same group.
Adoption of CSA Practices and Its Intensity
Although the level of adoption varies from household to household, the results of the survey shows that the majority of the farming households, about 84.7%, adopted CSA practices, whereas a very small percentage of the households (15.3%) did not adopt any of the CSA practices at all. Among the 19 CSA practices adopted by the households, the top 5 most adopted practices include, crop rotation/cereals with legumes (adopted by 74.7%), Terrace (63.6%), compost and manure usage (62.2%), reduced tillage (57.9%), and efficient fertilizer application (56.2%), while the least adopted five practices include rainwater harvesting (adopted by 10.1%), year-round cropping (13.8%), bio-fertilizer application (20.3%), efficient water utilization (21.2%), and adoption of new crops (23.5%). The other CSA practices in between the most and the least adopted practices include adoption of short seasoned crops (adopted by 50.2%), intercropping cereals with legumes (39.2%), high-yielding varieties (38.3%), mulching (35.9%), tree-based conservation agriculture (34.1%), growing drought tolerant crops (adopted by 30%), use of disease tolerant varieties (28.6%), use of improved varieties (26.7%), and integrating crops with trees (24.4%). A summary of CSA practices adopted by the households is presented in Appendices 3 and 4.
Of the 19 CSA practices, the majority of the sample households (about 43.8%) adopted from 6 to 10 CSA practices, while a small percentage, about 1.4%, adopted above 15 CSA practices. Averagely, the households adopted about 7 practices. Relatively, the majority of households (13.4%) adopted 9 of the practises, followed by 9.7% who had adopted 10 of the practices. At the third level, 5 of the practices were adopted by 8.3% of the households, and at the fourth level, 11 and 7 of the practices were adopted by each 7.4% of the households. This shows that most households adopted multiple CSA practices to establish a shield from the effect of climate variability and change through a layer of practices.
Effect of Adoption Intensity of CSA Practices on Food Availability and Security
Several compulsory econometric diagnostic tests were carried out particularly for the multiple regression estimation. Accordingly, the model passed multicollinearity and linearity tests with VIF values of below 3 for multicollinearity (as a rule of thumb, VIF should be below 10) and insignificant values for linearity test (the values of hatsq being insignificant), an indication that there is no linearity problem. However, heteroskedasticity was found to be a problem, and transformation of per capita calories into natural logarithm effectively solved the problem.
As shown in Table 4, intensity of CSA practices, training, access to vehicle road, membership in informal institutions, agricultural experience, household size, and kebele of residence have statistically significant effect on per capita calories. On the other hand, the logistic regression results indicate a significant effect of adoption intensity, agricultural experience, household size, and kebele of residence on food security status. Below is the discussion of these significant variables.
Multiple Linear and Logistic Regression Estimation.

Note. For multiple reg: Obs = 201, F(20, 180) = 7.71, Prob > F = .0000, Adj R-squared = .4616. For the logistic reg: Obs = 201, Log likelihood = −93.808041, Chi2(20) = 81.76, Prob > chi2 = .000, Pseudo R2 = .3035.
***, **, and * stand for significance level at 1%, 5%, and 10%, respectively.
Adoption intensity is found to be statistically significant at 10% and 5% levels for per capita calories per day and food security, respectively, and it is associated positively with both. The coefficient (0.0196) of the multiple regression indicates that an increase in adoption of one CSA practice increases per capita calories per day per household member by 1.96% and the odds ratio of the logistic regression (1.1214) shows that the likelihood of being food secured (be in the category of >2,100 kcal) increases by 1.12 times for every additional CSA practice adopted by the household. This result is clear in the sense that the more households adopt several CSA strategies, the combination of strategies might provide households with better defence against the impacts of climate change on their agricultural activities. In line with this, Wekesa et al. (2018) and Habtewold (2021) reported that CSA practices, if used in combinations, have the potential to increase food security and alleviate poverty among smallholder farmers by increasing income and consumption as a result of improvement in production gain. Similarly, Subedi et al. (2019) reported positive results in crop yield attributed to using different climate smart practices.
Training is also found to be statistically significant at 5% level and positively associated with per capita calories but not with food security status. Per capita calories per day increases by 25.3% for households that took training on CSA. Training helps to equip households with the necessary knowledge and skills to understand climate change and respond to its impacts on farming and their livelihoods. Empirical studies also suggest that training on conservation agriculture with a combination of interventions that promotes various CSA practices could help to enhance household food security (Abafita &Kim, 2014).
Access to vehicle road is another variable which is statistically significant at 5% but negatively associated with per capita calories. However, it does not have a statistically significant role in food security. For households having access to vehicle road, per capita calories per day decreases by 20.7% and this is a strange result compared to other studies that reported a positive association between access to vehicle road and food security (Ahmed et al., 2017; Shively & Ganesh, 2017). The result of this study could be related to the heavy dependence of the farming households on food aid and in such instances, access to vehicle road might not have a positive impact on per capita calories even though villages are connected by roads. In addition, farmers might not effectively use the roads to go to markets as they might lack own production to sell outputs and face financial constraints to purchase agricultural inputs which in turn affect production.
Membership in informal institutions such as Idir (social association) and Iqub (financial association) is another important factor found to be statistically significant at 5% level and positively associated with per capita calories. The coefficient (0.3699) of the multiple regression indicates that per capita calories per day increases by 37% for households who are members of informal institutions. Other studies also indicated the positive influence of social capital such as informal institutions on household food security which can be related to kilo calorie intake (Joseph et al., 2015; Sseguya, 2009). Among poor communities and smallholder farmers, informal institutions serve as platforms to access information on weather, agricultural activities, productive technologies, and CSA practices, particularly where formal institutions are deficient, and this in turn contributes to crop yield and production increment which eventually leads to rising in per capita calories.
Agricultural experience is found to be statistically significant at 5% level and positively associated with both per capita calories and food security. The result shows that an increase in 1 year of agricultural experience results in an increase in per capita calories per day by 0.6%. On the other hand, the likelihood of being food secured increases by 1.038 times for every additional year of agricultural experience. This result corroborates with the findings of other studies which reported that experienced farmers are in a better position to know alternative techniques that could boost agricultural productivity and hence improve food security. Wekesa et al. (2018) and Abegunde et al. (2019) indicated that experience in farming is positively associated with a higher likelihood of adopting CSA practices, and improved adoption of these practices could help reduce food insecurity among small-scale farmers.
Household size is another statistically significant factor which negatively affected both per capita calories and food security at 1% level. The coefficient of the regression (−0.1690) shows that an increase in one member of a household could lead to a decrease in per capita calories by 16.9%. Similarly, the odds ratio of the logistic regression shows that the likelihood of being food secured decreases by 0.50 for every additional member of a household. This result is clear that every added member in the household shares the available food, thus contributing to the decline of available food per person. Other empirical studies also suggest that large family size has a negative association with per capita calories and household food security (Mota et al., 2019; Olayemi, 2012).
Kebele, the place of residence where the sample households live (Debe Lima, Kirarem, Mena Medhanialem, and Wekro kebeles), is found to be statistically significant at (1%) level and negatively associated with both per capita calories and food security, taking Debe Lima as a reference kebele. The coefficients for Wekro (−0.8260), Mena Medhanialem (−0.5806), and Kirarem (−0.9100) indicate that per capita calories per day decrease by 82.5%, 58%, 91% respectively as compared to per capita calories in Debe Lima. In a similar fashion, the likelihood of being food secured decreases by 0.035, 0.086, and 0.014 times for Wekro, Mena Medhanialem, and Kirarem, respectively, as compared to Debe Lima kebele. This result goes in line with the self-reported food security status of the households. Twenty five percent of the households in Debe Lima kebele are food insecure, whereas 69.1%, 76.5%, and 53.3% of the households in Wekro, Mena Medihnealem, and Kirarem kebeles are food insecure, respectively. The highest proportions of food secured households (75.0%) are located in Debe Lima kebele as compared to that of Wekro (30.9%), Mena Medihnealem (23.5%), and Kirarem (46.7%) kebeles. These descriptive results support that Debe Lima is better in both per capita calories and food security status as compared to the rest of the three kebeles, and this is also reflected by the regression results. The result also supports FAO’s (2013) assertion that climate smart agriculture is context specific and there are no universally applicable sets of practices that could increase productivity, resilience, and reduce agricultural greenhouse gases.
Conclusion
The study was conducted to assess the level of adoption intensity of CSA practices and their effect on food security among farming households. Accordingly, the result of the household survey showed that the majority of the farmers (84.07%) adopted CSA practices. Among the 19 CSA practices, the average adoption intensity was found to be 7. On the other hand, adoption intensity of CSA practices has a positive effect both on per capita calories per day and food security. This result suggests that CSA has a promising effect on enhancing food security, one of the pillars of CSA.
The study provides three implications for policy. First, adopting a combination of CSA can make a vital contribution to address the potential impacts of climate change on Ethiopian agriculture and national food security, and thus policymakers and the extension system should encourage and support farmers to implement a combination of CSA strategies than limited to one or a few practices. Second, since CSA practices are not universal, location-specific and proven CSA practices should be made available to farmers. Third, in addition to adoption intensity, agricultural experience is a major factor that positively affected both per capita calories and food security, and membership in informal institutions and access to training affected per capita calories positively, with household size affecting per capita calories negatively. It is therefore essential to consider these issues when planning and promoting CSA among smallholder farmers.
Although this study revealed the importance of CSA intensity on food security, the study is limited to a specific area and it did not show which of the CSA practices and combination of practices are better in enhancing food security. Thus, future research needs to pay attention to these limitations observed in this study. In addition, future research in a similar issue should build on the effort of this current study by extending the effort in wider study settings and different localities by employing other analytical methods. Finally, research thinking should shift towards capturing CSA both as a dummy (adopted or not adopted any of the practices) and as an intensity behaviour (a combination of practices), rather than merely capturing it as a dummy variable, which might lead to superficial results.
Footnotes
Appendix
Adoption Intensity of CSA Practices Among the Sample Households.

| Intensity of CSA practices adoption | Number of households | Percent |
|---|---|---|
| From 1 to 5 | 41 | 18.98 |
| From 6 to 10 | 94 | 43.52 |
| From 11 to 15 | 45 | 20.83 |
| From 16 to 19 | 3 | 1.38 |
| Total | 183 | 84.71 |
Acknowledgements
The authors would like to extend their heartfelt gratitude to the administrators of the Guna Begemider district and Peasant Association members for facilitating the data collection, and the farming households for their willingness to participate in the research.
Ethical Considerations
The data used in the study was collected with full consent of the respondents and the data was anonymized to protect participant confidentiality.
Author Contributions
Ms. Mekdes Teklemichael designed the study, collected the data, performed the analysis and interpretation, wrote the paper, and revised the manuscript. Dr. Abate Mekuriaw contributed to the study’s design and conceptualization, performed the analysis and interpretation, wrote the paper, and revised the manuscript.
Funding
The author(s) received no financial support for the research, authorship, and/or publication of this article.
Declaration of Conflicting Interests
The author(s) declared no potential conflicts of interest with respect to the research, authorship, and/or publication of this article.
Data Availability Statement
The data used for the study are available from the corresponding author upon reasonable request.