
Abstract
This study examined the adoption of climate-smart agriculture (CSA) technologies and their determinants among smallholder farmers in the Sidaama Region, Ethiopia. A mixed research approach with descriptive and explanatory sequential designs analyzed data from 391 systematically sampled households. A multivariate probit model and logistic regression identified factors influencing adoption. The most adopted CSA technologies were crop diversification (CD), integrated soil fertility management (ISFM), agroforestry (AF), integrated pest management (IPM), and small-scale irrigation (SSI). The CD was the most widely adopted technology. Agroecological zones (AEZs) significantly influenced adoption, with probabilities highest in the midland (95.2%) and lowland (90.8%). Income from crop production emerged as the most consistent driver of CSA adoption. Higher incomes significantly increased adoption, particularly for CD and SSI. The probability of adopting CD approached 100% for incomes above ETB 60,000, while SSI adoption increased from 16.4% at the lowest income to 95.5% at the highest. Training within the past 12 months significantly boosted AF and IPM adoption by 80.8% and 68.4%, respectively. Larger landholdings increased SSI adoption, while higher tropical livestock unit (TLU) levels negatively affected CD and ISFM, possibly due to land fragmentation. Market distance hindered SSI adoption, with probabilities declining from 14.1% at 1.7 km to 10.8% at 2 km. These findings highlight the importance of targeted interventions to enhance CSA adoption, including income diversification, capacity-building training, and improved infrastructure. By addressing these factors, policymakers can promote sustainable agricultural practices tailored to agroecological and socioeconomic contexts, fostering resilience and productivity among farmers in Sidaama.
Plain Language Summary
Climate change is putting significant pressure on Ethiopia’s agriculture sector, necessitating adaptation and mitigation strategies. Climate-smart agriculture (CSA) is one of the government-initiated adaptation mechanisms. However, there is limited empirical research on the practices and determinants of CSA adoption by smallholder farmers in the region. This study aimed to assess the practices of CSA technologies and the determinants of smallholder farmers’ decisions on their adoption. Crop diversification, integrated soil fertility management, agroforestry, integrated pest management, and small-scale irrigation were the most commonly practiced CSA technologies. Agroecological zones (AEZs) significantly influenced the adoption of most CSA technologies, with the highest probabilities of adoption in the midland. Income from crop production was the most consistent driver of CSA adoption, with higher income levels leading to greater adoption. Other factors, such as training, soil and water conservation, landholding size, access to climate information, tropical livestock unit (TLU), distance from markets, and asset value, exhibited varied effects on adoption decisions. These findings underscore the importance of tailored interventions, including income diversification, access to training, and improved infrastructure, to enhance the adoption of CSA technologies and foster sustainable agricultural practices in the region.
Keywords
Introduction
Ethiopia, a socioeconomically less developed country, faces significant challenges due to climate change, which impacts its agriculture sector (Mekonen & Berlie, 2021). Climate change adaptation involves adjusting natural or human systems to mitigate harm or capitalize on opportunities. Environmental, socio-demographic, and economic factors contribute to climate change and variability, affecting households’ livelihoods. Smallholder farmers can implement autonomous adaptation (Zagre et al., 2024), or the government can initiate it through policies (Asrat & Simane, 2018; Gyimah et al., 2020), with CSA being one of the government-initiated adaptation strategies. Climate-smart agriculture (CSA) is an approach to developing technical, policy, and investment conditions for sustainable agricultural development for food security under climate change (Food and Agriculture Organization [FAO], 2013). CSA aims to mitigate greenhouse gas emissions, enhance farmers’ adaptive capacity, and sustainably intensify agriculture for better livelihoods. It is expected to increase production and productivity sustainably, improve resilience, reduce or eliminate greenhouse gas (GHG) emissions (de Pinto et al., 2020), and advance development and food security goals. Effective CSA requires local adaptation, specific strategies to the local environmental and socio-economic context, and adequate training for smallholder farmers. CSA must be integrated into policy frameworks aligning with broader economic growth and poverty reduction goals (Ifeanyi-Obi et al., 2022).
In Ethiopia, CSA technologies used in smallholder farming systems include integrated soil fertility management, watershed management, irrigation, agroforestry, sustainable land management, crop residue management, composting, enhanced livestock feed promotion, rangeland management, and crop diversification (Hussein, 2024). CSA technologies are a crucial priority for Ethiopia’s agriculture industry reform (Sisay et al., 2023). They increase food and income security, improve water and nutrient use efficiency, and increase soil fertility. Factors affecting CSA adoption among smallholder farmers include education, extension services, and ownership of communication devices (Diro et al., 2022). Other studies have found that factors such as household head age, landholding, asset value, frequency of extension contact, farmers’ awareness of climate change, climate shocks’ experience, slope of the land, and erosion severity influence adoption decisions (Sisay et al., 2023).
Although there is global acknowledgement of climate-smart agriculture (CSA) as a critical strategy to address climate change impacts, enhance agricultural productivity, increase resilience, and reduce GHG emissions in the face of climate change (de Pinto et al., 2020), recent studies indicate that while some CSA practices are being adopted, the overall uptake is insufficient to significantly improve food security and resilience among rural households in Ethiopia (Legesse et al., 2024). Governments and NGOs have been implementing CSA technologies for 10 years in the country. However, studies have shown inconsistencies in their results, highlighting the need to address the research gaps (Hussein, 2024). Demographic, socio-economic, physical, infrastructural, and agroecological factors influence agricultural practices across diverse areas of the country differently (Belay et al., 2023), necessitating area-specific research to distinguish factors influencing farmers’ adoption and recommend strategies to mitigate negative factors.
In addition, there were limited empirical research findings on the practices and influencing factors of the adoption of CSA by smallholder farmers in the study area. For instance, a study by Legesse et al. (2024) found that practices such as conservation agriculture, soil fertility management, and crop diversification were adopted by varying percentages in the Sidama region. Nonetheless, challenges remain, such as insufficient understanding and contextual adaptation of climate-smart agriculture methods. Research on the impact of local socio-economic conditions on CSA adoption in the Sidama region is limited, with most studies being broad or focusing on other regions (Adem, 2019). B. A. Kassa and Abdi’s (2022) work concentrated on a single district (Wondo Genet), the work of Diro et al. (2022) focused on a single crop (coffee) producing area, and it was a national-level study. The region encompasses diverse agroecological zones, each with distinct environmental conditions and farming systems (Tunsisa & Reda, 2022). However, comparative analyses of CSA adoption across these zones are scarce. Moreover, high population density and land fragmentation in the region (Areru et al., 2020) may shape the adoption of CSA practices. These dynamics have not been systematically studied, leaving a gap in understanding how farm size affects farmers’ decisions to implement CSA. Socio-cultural factors, community responsibilities, traditional practices, and economic constraints significantly influence CSA adoption, yet they are often overlooked in research in the region, requiring further exploration of their impact on farmers’ decisions.
Hence, the current study is crucial to fill these gaps by considering different agroecological zones of the region and including different factors comprehensively for developing effective policies based on the contexts of the study region. Therefore, the main focus of the study was to examine the practices of CSA technologies and factors affecting smallholder farmers’ adoption of the technologies in the study region.
Materials and Methods
Description of the Study Area
The research is conducted in the Sidama Region, one of Ethiopia’s 12 regional states, found in the south-central part of the nation. The region is bordered by the Oromiya and South Ethiopia Regions (Figure 1). The region lies between 6′14″–7′18″ N latitude and 38′20″–39′20″ E longitude. It covers 6,539 km2 and has 30 districts, 6 town administrations, and the Hawassa City Administration. The population is estimated at 5,301,868, experiencing a growth rate of 2.9% per year (CSA, 2023). Sidama is one of the country’s most densely populated regions, with a population of 633 people per square km. Traditionally, there are three agroecological zones in the region: highland (alicho; 15% of the land area), where the elevation is 2,500 to 3,368 m.a.s.l.; midland (woricho; 54% of the total land) which lies between 1,500 and 2,500 m.a.s.l. The lowland (gammoojje) is semi-arid and has 50% of the total land and lies between 500 and 1,500 m.a.s.l. of the region (Planning and Development Bureau, 2023).

Administrative map of the study region.
Subsistence agriculture is the livelihood base of the majority of the people in the region, with waasa being the staple food. Coffee and khat are the major cash crops, with Sidama Coffee being a popular Arabica coffee. Other food and cash crops include cereals (barley, wheat, maize, and teff), legumes (beans, peas, haricot beans, and soybeans), and fruits like avocado, mango, banana, and apple, and vegetables. Sidama is known for its coffee production and well-developed agricultural cooperatives (Planning and Development Bureau, 2023; Table 1).The study districts and AEZs are dipcted in Table 1.
Study Districts, Longitude, Latitude, and Agroecological Zones.

Source. National Metrology Institution.
Research Design and Approach
Research strategies, research choices, and time horizons commonly suggest design decisions in a research project (Saunders et al., 2019). Regarding time horizon, this research emphasized a cross-sectional design, which means cross-sectional datasets were collected from households, community leaders, Development Agents, Religious Leaders, and government officials at one point. With a mixed (pragmatic) approach, descriptive and explanatory sequential research designs were therefore used in this study.
Source of Data and the Study Population
This study integrates both primary and secondary data sources. Primary data was gathered from various stakeholders, including smallholder farmers, officials from government offices (spanning kebele to regional levels), community leaders, and youth and women groups. Secondary data was sourced from the regional planning commission, policy documents, and government reports. Demographic and socioeconomic data were accessed from Ethiopia’s Central Statistical Agency (CSA). The study population comprises rural smallholder farmers in three selected districts of the Sidama region—Arbegona, Shebedino, and Loka Abaya, which were chosen for their representation of distinct agroecological zones. According to the Sidaama Region Agriculture Bureau (2023) report, these districts collectively host 86,859 smallholder farmer households (Arbegona: 19,030; Shebedino: 37,716; and Loka Abaya: 30,113). Data collection employed both quantitative and qualitative methods.
Sampling Design and Sampling Procedure
The study employed a combination of probability and non-probability sampling methods to achieve its objectives. Probability sampling, which ensures that every unit in the population has an equal chance of selection (Taherdoost, 2018), was used for collecting quantitative household data. In contrast, non-probability sampling targeted specific groups, such as community leaders, youth and women’s groups, and government officials, based on predefined criteria. Smallholder farmer households were designated as the primary sampling unit, as climate change impacts are often most evident at the household level. However, qualitative methods were also employed to capture broader community-level impacts.
A multi-stage sampling procedure was adopted, progressing from broader to narrower samples. In the first stage, the Sidaama region was selected due to its pronounced vulnerability to food insecurity, climate variability, and environmental degradation. These challenges are exacerbated by factors such as high population density (Planning and Development Bureau, 2023), land fragmentation (Iaip, 2018), and widespread soil infertility and acidity (Haile & Boke, 2010). Additionally, the region’s lack of comprehensive research on climate-smart agriculture (CSA) adoption further justified its selection.
In the second stage, districts representing distinct agroecological zones (AEZs) were purposefully selected to capture the variability in CSA adoption driven by agroecological differences. Among the 30 rural districts, 3 were chosen: Arbegona (highland), characterized by crops such as weese (enset, the staple food crop), barley, and wheat; Shebedino (midland), known for cash crops like coffee and khat; and Loka Abaya (lowland), predominantly cultivating maize and haricot beans. The third stage involved the purposeful selection of nine rural kebeles, with three from each district, ensuring representation of their respective AEZs. These kebeles were chosen based on their agroecological distinctiveness, encompassing a total of 11,955 households. In the fourth stage, households were selected using systematic random sampling. Lists of households were obtained from agricultural development agents (DAs), whose records provided comprehensive details on smallholder households, including those actively engaged in extension services and model farming practices.
The agroecological zones (Alicho, Woricho, Gammoojje) represent traditional Sidaama people classifications and differ in vulnerability, livelihood systems, and climatic conditions. By focusing on these traditional classifications, the study aimed to investigate variations in CSA adoption across diverse ecological and cultural contexts. Urban centers were excluded from the study, as rural agricultural communities experience more direct impacts of climate variability and are the primary adopters of CSA practices.
Sample Determination
The Kothari (2004) formula was used to determine the sample size as given below.

Were,
n = the required sample size;
z = 1.96 (95% confidence interval);
p = The approximate proportion of a characteristic that the population possesses, 0.5;
q = 1 −p;
e = The preferred degree of accuracy or margin of error = .05 (5%);
N = Total number of smallholder households in selected AEZs = 11,955.

Hence, the sample size gives us a minimum of 372.3. To avoid incomplete and non-response, 5% of the sample size (19) was also included, and the total sample size is 391.
The next step was determining the number of sample households for each agroecology and kebele from the sample using the probability proportional to size (PPS) method to equally represent HHs in each kebele.

Where n = determined sample size of the research used,
Data Collection Methods
For the study, standardized scheduled interviews were prepared and entered into Kobo Toolbox and administered face-to-face by trained enumerators using Kobo-Collect to collect data from smallholder households based on the oral consent of the respondents. We took precautions to prevent potential bias in the data collection process. Standardized measurement tools were prepared based on the literature review. The tools were also reviewed by two experts in the area, and comments were incorporated. The use of Kobo Toolbox and its data collection extension, Kobo-Collect, also helped to reduce the bias in that the questions were made mandatory to avoid skipping, starting time, ending time, and GPS were set in the Kobo Toolbox to avoid the fraudulent filling of the data by the enumerators. In addition, thorough follow-up was made by the researchers to correct the problems that may arise in the data collection. A pilot test was conducted with 39 households (10% of the sample households) before implementing the final survey, which is consistent with the previous study by others (B. A. Kassa & Abdi, 2022). Nine focus group discussions (FGDs) and key informant interviews (KIIs) were held to collect qualitative data from various stakeholders, including community leaders, women and youth groups, development agents, religious leaders, and school principals. The collection of the qualitative data was handled by the research team.
Data Analysis Methods
The data collected using Kobo-Collect was coded and cleaned with SPSS and Stata software. To analyze the practices of adopting the CSA, descriptive statistics were employed. A multivariate probit (MPV) regression model was employed to analyze factors affecting smallholder farmers’ adoption decisions for CSA technologies. Binary logistic regression was used to identify the reference category of categorical variables and to analyze the marginal effect and marginal plot of independent variables on each dependent variable.
The multivariate probit (MVP) model is used to analyze situations where there are multiple binary dependent variables, of which the error terms are potentially correlated (Cappellari & Jenkins, 2003; Greene, 2003). In addition, it is used to analyze the simultaneous adoption of multiple climate-smart agriculture (CSA) practices by smallholder farmers, accounting for the interdependence between these decisions. It was assumed that the model would enable the research to comprehend the factors that influence the responses and various determinants. These models help to analyze the correlations between these variables to determine how interrelated they are—a requirement that univariate multinomial, logit, and probit models fail to meet (Kurgat et al., 2020). It also accommodates the simultaneous adoption of multiple practices and identifies shared and unique determinants of each practice. By capturing interdependence, the MVP model provides better insights into complementarities and trade-offs between CSA practices, guiding more targeted interventions. In this case, the MVP model was applied to understand the factors influencing the adoption of five climate-smart agriculture (CSA) practices: Crop Diversification (CD), Agroforestry (AF), Integrated Soil Fertility Management (ISFM), Small-Scale Irrigation (SSI), and Integrated Pest Management (IPM), which are correlated.
Model Specification
The MVP model specifies that each binary dependent variable (

Where,

Where Σ is a symmetric positive-definite covariance matrix representing the correlations between the error terms of the five adoption decisions. Correlations between error terms indicate interdependence among the adoption decisions. The model is estimated using maximum simulated likelihood (MSL) methods due to the computational complexity of multivariate normal distributions (Cappellari & Jenkins, 2003; Train, 2009).
Each of the dependent variables is binary, representing the adoption of a specific CSA practice:
To check the continuous explanatory variables’ multicollinearity, the pairwise correlation coefficient was computed before employing the MVP model and logit regression models in examining the effects of explanatory variables on CSA adoption decisions. In contrast, the contingency coefficient was tested for the degree of association among dummy explanatory variables. The model description and the detailed model specification for the analysis of logistic regression can be seen in Supplemental Material S1.
Variables Included in the Analysis
Dependent Variables
The study considered climate-smart agriculture (CSA) adoption as a dependent variable with five technologies, which include crop diversification (such as intercropping and crop rotation); small-scale irrigation (traditional or modern); use of integrated soil fertility management; agroforestry (planting trees with other crops in agricultural fields); and integrated pest management. The five technologies were selected based on prior literature reviews (Diro et al., 2022; Negera et al., 2022).
Crop Diversification (CD)
The purposeful addition of functional biodiversity at the temporal and/or geographical level to crops to boost yield and stabilize ecosystem services is known as crop diversification (Jirata et al., 2016). The CD helps farmers be more resilient in the face of volatile weather brought on by climate change (Sharma et al., 2021). The CD helps farmers be more resilient in the face of volatile weather brought on by climate change (Jirata et al., 2016).
Agroforestry (AF)
The land-use system that combines perennial woody plants with livestock and crops is called agroforestry. It enhances soil fertility, lowers erosion, and improves the quality of water (Leakey, 2017; Mebrate et al., 2022). It is both feasible and ecologically sound. Benefits include less runoff of fertilizer and pesticides, sequestration of carbon, improved soil quality, control of erosion, better habitat for wildlife, reduced use of fossil fuels, and heightened resilience (Sheppard et al., 2020).
Integrated Soil Fertility Management (ISFM)
Improved germplasm, organic inputs, and fertilizer are all part of soil fertility management practices, or ISFM, which optimize crop yield by increasing agronomic usage efficiency and adjusting to local conditions. It includes responsive crop varieties, improved agronomic practices, carefully applied fertilizers, and recycled organic resources (Agegnehu & Amede, 2017; Vanlauwe et al., 2010) because it improves soil fertility and reduces GHG emissions, making it a valuable practice in CSA practices (Sisay et al., 2023).
Small-Scale Irrigation (SSI)
Small-scale irrigation is a method used by smallholder farmers and practiced in small plots of land that improves agricultural productivity, climate adaptation, food security, and income, while also contributing to national development objectives by utilizing efficient technology (Jambo et al., 2021).
Integrated Pest Management (IPM)
Pests are harmful to plants and plant products (Franco, 2021), and IPM is an ecosystem-based approach to crop protection and productivity, aiming to minimize damage, reduce risks to human health and the environment, and discourage pest populations through the cultivation of healthy crops and organic methods (FAO, 2017). The IPM method includes both cultural and mechanical control measures (Franco, 2021), such as crop rotation and planting times, and empowers farmers to make the best decisions on controlling pests in their fields (Muniappan & Heinrichs, 2016).
Independent Variables
The model incorporated fourteen explanatory variables to examine the factors that influence smallholder farmers’ choices to implement CSA technologies. Some pertain to the demographics of the household, while others are associated with infrastructure, agroecology, knowledge and skills, and resource ownership (Supplemental material S2).
Demographic Characteristics
Age is the number of years the household lived during the survey. It would have a negative relationship with adopting the CSA, where older smallholder farmers (age > 50) are expected to be highly risk-averse and less likely to adopt CSA practices.
Sex is assumed to be one of the factors impacting the adoption of CSA. Male-headed households were expected to adopt CSA because of the exposure to formal and informal knowledge and skills due to their frequent interaction compared to females, while women lack such experience due to the work overload they have at home. Hence, it was assumed that the adoption of CSA is positively related to male household heads. Studies by Belay et al. (2023) and Tekeste (2021) indicated that male-headed households are more likely to adopt climate-smart technologies due to more access to information and knowledge, whereas women are more overwhelmed by household chores.
Resource Ownership
It means the resources such as land in ha, crop income, livestock, and the value of other assets held by the household.
Landholding is the total area of a smallholder household’s farmland (Luu et al., 2018), which is one of the main factors in determining the adoption of agroclimatic systems (CSAs). Larger farmland owners are more likely to invest in CSAs, as they are motivated to reduce costs, labor, and care time, thus positively influencing CSA adoption (Ndung’u et al., 2023).
Use of Soil and Water Conservation (SWC) is a local effort to prevent soil erosion, conserve water, and enhance soil fertility. It aims to preserve or increase the land’s productive potential in areas vulnerable to degradation. SWC experiences are expected to improve smallholder farmers’ adoption of CSA, with the hypothesis that SWC positively influences CSA adoption. A study by Yifru and Miheretu (2022) showed that those smallholder farmers who acknowledge the significance of SWC are more inclined to respect the role of climate-smart agriculture (CSA) in addressing climate change problems.
Crop Income of the Household: The household’s crop income is the total income earned from the production of various crops in Ethiopian Birr (ETB) within the last 12 months, including permanent crops, fruits, and vegetables. It excludes income from non-farm sources. The study hypothesizes that crop income positively correlates with the adoption of CSA. A recent study by Gudina and Alemu (2024) showed that cop income indicates household financial stability and investment capacity in new agricultural practices, enabling farmers to adopt CSA practices.
Asset Values of the Households: It is the monetary value of both the productive assets (axe, sickles, plough/maresha, plow/kenber, hoe, horse/donkey cart, tractor, etc.) and household assets such as bed, table, chair, solar panel, jewelry, etc. Research indicates that ownership of these assets shows the monetary capacity of the households to invest in CSA technologies, where higher asset indices in households lead to more intensive adoption of sustainable agriculture practices (Aryal et al., 2018). Hence, ownership of assets is assumed to be positively related to the adoption decision of CSA.
Size of Livestock Holding (TLU): This is the number of livestock the household has, which is converted into a TLU. If a household has a greater number of livestock, they can use their excrement or waste materials (e.g., animal dung), which is the primary input for the preparation of compost and mulch. Therefore, households that have more livestock are expected to adopt integrated soil fertility management of CSA more likely than a smaller number of TLU. Research showed that farmers with larger livestock holdings often have more financial resources, and the average cattle ownership among farmers implementing climate-smart techniques is considerably more than that of their counterparts who do not (Mamo, 2023).
Information and Knowledge
These are characteristics that are related to information and knowledge, such as participation in farmers’ groups, access to climatic information, and availability of extension assistance.
Responsibility in the Community involves household members participating in leadership positions, such as kebele administration, council, Iddir leaders, and community development coordinators. This participation ensures social capital and the adoption of innovative ideas, and it is hypothesized that it positively influences the adoption decision of CSA.
Training received: The study hypothesized that households with CSA training were more inclined to adopt CSA than those without, as they participated in climate-smart agriculture practices within the last 12 months.
Access to Agriculture Extensions Service: Ethiopia’s agricultural extension service aims to transform agriculture from subsistence to commercialized by implementing a diverse system for men, women, and youth. Inadequate extension services and lack of knowledge are the major obstacles to climate change adaptation, while access to extension services could positively impact smallholder farmers’ adoption decisions.
Membership in a Cooperative allows family members to participate in community organizations, enabling smallholder farmers to learn about CSA practices and technologies. This membership also allows access to training and workshops, promoting the adoption of CSA technologies. The hypothesis was that membership in cooperatives positively affects the adoption decision of the technologies.
Access to Climate Information: For smallholder farmers to adopt CSA technologies to adapt to climatic variability and change, climate information is essential. Early warning systems, weather predictions, pest attacks, input control, agricultural techniques, pest and disease management, and pricing are all included in this (Nhemachena & Hassan, 2007). Research showed that this is related to the theory of planned behavior (TPB), which is related to increased awareness, decision-making support, and mitigation adaptation. The incorporation of climate information into agricultural decision-making enhances the adoption of climate-smart technology by modifying farmers’ perceptions, affecting societal norms, and augmenting their confidence in novel methods (Johnson et al., 2023; Saadu et al., 2024). Hence, access to climate information positively influences investment in the adoption of various CSA technologies.
Infrastructure Related Factors: This is concerned with the distance from home to a nearby main market (Dis. Mmarket). Distance to a nearby main market significantly influences the adoption of CSA technology, reflecting the availability of input and output markets (Amare & Simane, 2017). Households farther from main markets tend to adopt fewer CSA technologies. The economic constraint paradigm highlights the significant role of economic factors in adoption decisions, particularly for households with geographical disadvantages, as they may face higher transportation costs and limited resource endowments (Maguza-Tembo et al., 2017). The nearer the output market, the more it encourages farmers to produce surplus crops for sale, improving their resource base and climate response-ability.
Agroecology Related (AEZs)
Farmers in different agroecological settings adopt different CSA technologies. Researches indicate that households with greater temperatures and lower rainfall are more inclined to take different actions (Atinkut & Mebrat, 2016). Smallholder farming households in the lowland (Gammoojje) are more likely to adopt CSAs than residents of the midland (Woricho) or highland (Alicho) due to climate variability. Compared to highland farmers, Midlanders are more inclined to adopt the technology. The decision to adopt CSA is influenced by the AEZs (Alicho/highland, Woricho/midland, and Gammoojje/lowland) and conditioning factors such as infrastructure development, market access, extension services, information-related issues, and climate change-related issues.
Results and Discussion of the Study
Respondents’ Demographic Characteristics
Assessing the respondents’ demographic characteristics is more crucial since those variables might have a relationship with the adoption of CSA. The mean landholding of the households is 0.93 ha, which indicates that the landholding of the sampled smallholder farmers was fragmented. On average, the smallholder farmers owned 0.39 tropical livestock units (TLU), which is very small. 0.73 hr is the mean distance to the main market for the respondents. The average total crop income that the smallholders had in the last year was 11,900 ETB, and the mean value of the assets in the households is 17,000 ETB (Table 2).
Descriptive Statistics for Continuous Variables.
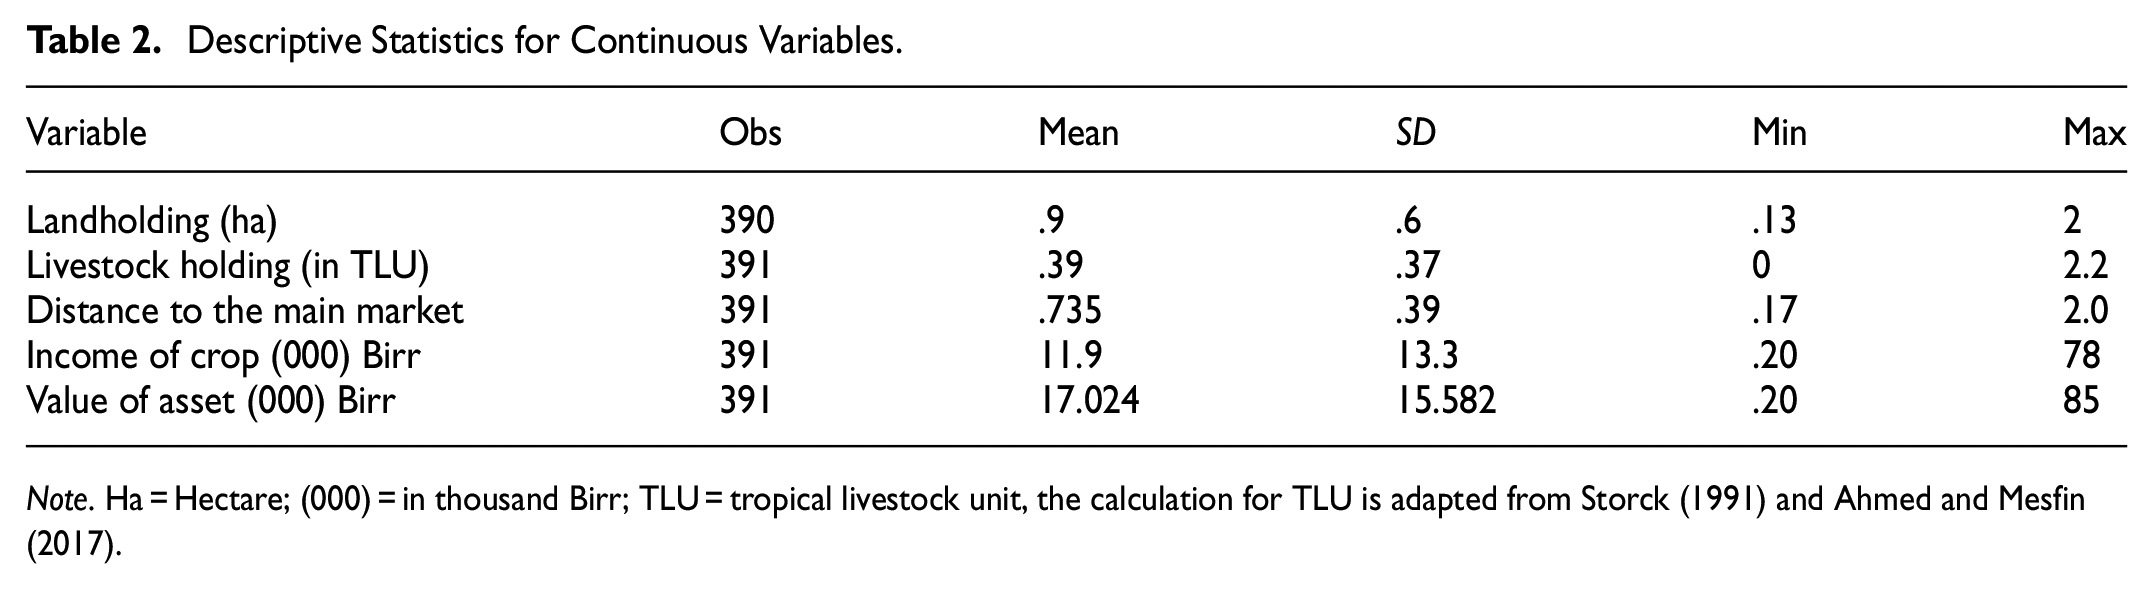
Note. Ha = Hectare; (000) = in thousand Birr; TLU = tropical livestock unit, the calculation for TLU is adapted from Storck (1991) and Ahmed and Mesfin (2017).
The study reveals that 78% of respondents are male, with only 22% being female. Most households do not participate in community responsibilities, with only 40.2% receiving agricultural production training. Only 44% have cooperative membership, and 47.1% use SWC schemes. Most households have access to agricultural extension services, but only 32.2% have access to climate-related information. These findings suggest that lack of training, low participation in cooperatives, and inadequate climate information may negatively impact the adoption of CSA technologies (Table 3).
Descriptive Statistics for Categorical Variables.

Source. Field Survey, 2023.
Practices of Climate-Smart Agriculture (CSA) Technologies Adoption
Crop diversification was the highest adopted technology (88.5%) among the sample HHs, followed by ISFM (80.3%) and agroforestry (79.3%). The least adopted technology was SSI (30.4%). At the agroecology level, midland was the highest adopter of crop diversification (97%), followed by lowland (91.5%; Table 4). The result is in congruence with other studies by Zeleke et al. (2024). Similar to CD, midland was the highest adopter of agroforestry (90.4%), followed by lowland (84.1%). However, the results are mixed in different countries where highlands are the highest in Rwanda (Mukundente et al., 2019), while midland was the highest in Uganda (Safari et al., 2023). The highest adopter of ISFM was the lowland (96.3%), followed by the midland (93.3%). Highland was the highest adopter of Small-scale Irrigation (40%), followed by midland (27.3%). The result is in congruence with other studies in Ethiopia, where highlands tend more to adopt SSI. Lowland was the lowest adopter of SSI (26.8%), while the highest adopter of IPM (Table 4).
Adoption of CSA Technologies at the Household and Agroecology Level.

Source. Field Survey, 2023.
Note. AEZs = agroecological zones; CD = crop diversification; AG = agroforestry; ISFM = integrated soil fertility management; IPM = integrated pest management; SSI = small-scale irrigation.
The adoption of crop diversification (CD) technology has been highly rated by respondents in enhancing crop production and productivity (mean score of 3.75; Table 5). This is due to the diverse crops in agroecosystems, which provide diversity for human food, household income, and food and nutrition security (Mango, Makate, Mapemba, et al., 2018). Farmers have been using Indigenous practices like crop rotation and intercropping to boost soil fertility and productivity, increasing resilience, food security, and carbon sequestration. Agroforestry technology has also been highly rated for improving climate conditions and soil fertility, indicating its positive effect on agricultural productivity and soil fertility. ISFM technology has been found to improve soil fertility, increasing crop production and productivity. IPM methods have also been found to increase crop production and yield (mean score 3.8; Table 5). However, FGD participants express dissatisfaction with synthetic pesticides due to their potential health and ecosystem damage. Overall, these technologies have shown positive effects on agricultural productivity, soil fertility, and climate change.
The Level of Selected CSA Technologies in Improving Crop Production, Soil Fertility, and Climate Situation.

Source. Field Survey, 2023.
In summary, crop diversification was the most adopted technology (88.5%) among sample HHs, followed by ISFM (80.3%) and AF (79.3%). Midland was the highest adopter of CD (90.4%) and AF (90.4%), while the Lowland was the highest adopter of ISFM. Conversely, Highland was the AEZ with the highest adoption rate of SSI (40%).
Determinant Factors on Climate-Smart Agriculture Adoption
This research analyzed the factors impacting farmers’ adoption decisions of CSA technologies to improve agricultural productivity. The results are discussed hereunder.
The pairwise coefficients of crop diversification and agroforestry; crop diversification and integrated soil fertility management; crop diversification and integrated pest management; agroforestry and integrated soil fertility management; agroforestry and integrated pest management; integrated soil fertility management and small-scale irrigation; integrated soil fertility management and integrated pest management; and small-scale irrigation and integrated pest management were significantly and positively correlated, which indicates the strong matching between the pairs of practices. This also shows the suitability of the multivariate probit (MVP) model in analyzing determinants of CSA technology adoption. The result indicated that the smallholder farmers have used different CSA technologies in combination, and there is an interconnectedness among the technologies that necessitates the application of the MVP model. However, the pairwise coefficient between agroforestry and small-scale irrigation was not significant (Table 6).
Estimated Model Test and Covariance of Correlation Matrix.

Note. CD = crop diversification; ISFM = integrated soil fertility management; AF = agroforestry; IPM = integrated pest management; SSI = small-scale irrigation; the number in the parenthesis is standard error; rhoAFCD = rhoISFMCD = rhoSSICD = rhoIPMCD = rhoISFMAF = rhoSSIAF = rhoIPMAF = rhoSSIISFM = rhoIPMISFM = rhoIPMSSI = 0; number of draws = 5; Number of observations = 391; Wald Chi2 (70) = 359.85. Chi2 (10) = 140.47 Prob > Chi2 = .0000.
The Wald Chi-square statistic (Chi2 [70] = 359.85, p < .01) and Chi-square statistic for the log-likelihood ratio test (Chi2 [10] = 140.47, p < .01) being significant, the results of the MVP model for decisions of adopting CSA show that the decisions whether to adopt one CSA technology are dependent on the decision of the adoption of other CSA, indicating that the use of the MVP model is supported by the result.
Factors Determining Crop Diversification Technology’s Adoption
The results indicated that agroecological zones (AEZs; β = .519) have a significant (p < .01) and positive effect on the decision of adopting crop diversification (CD) technology by the smallholder farmers (Table 7). Being the residents of Midland and Lowland positively affects the adoption of CD technology. It indicates that the odds of practicing crop diversification in the midland AEZ are approximately 8.35 ((EXP(β)) times ((735%) ((EXP(β)-1) * 100)) higher than in the reference category (Highland), holding all other factors constant. In addition, farmers in Lowland are 4.11 times (or 311% higher odds) more likely to practice crop diversification compared to highland farmers (Table 8). The results of the marginal effect also indicate that the probability of adoption increases across all AEZs (midland: 0.952, highland: 0.762, lowland: 0.908), where the smallholder farmers in midland are more likely to diversify (Table 9). Focus group discussion participants also affirmed that midland agroecology was more likely to practice CD due to its suitability for producing different types of crops, including those growing in both highland and lowland. This contrasts with a previous study that found highland residents increased the probability of adopting CD technology (Gebiso et al., 2023). The difference may be attributed to the distinct dominant crops in these different study areas, contrasting with the dominant barley and wheat crops in the former and mixed in the current.
Results of Multivariate Probit Model.

Source. Field Survey, 2023. *** = p < 0.01; ** = p < 0.05
Results of Logistic Regression for AEZs as Determinants of CSA Technologies.
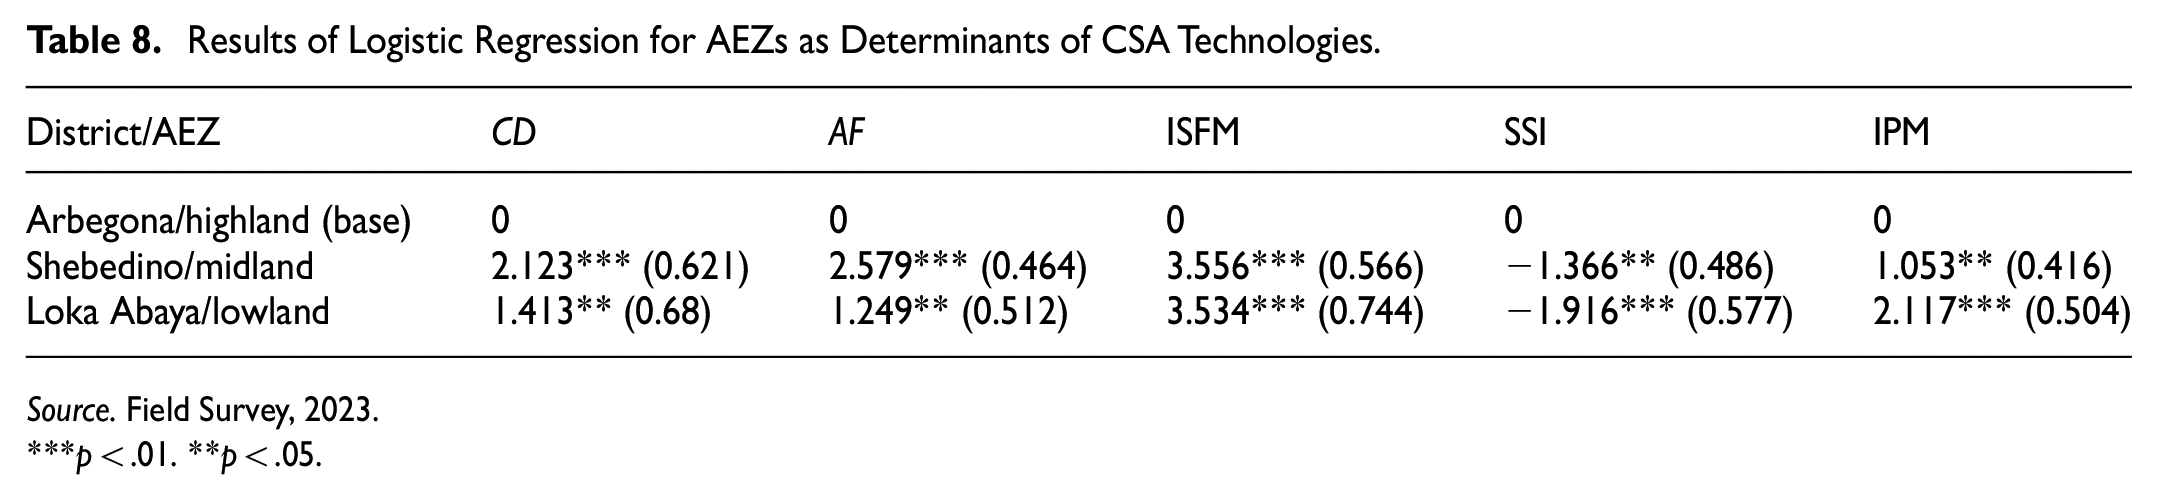
Source. Field Survey, 2023.
p < .01. **p < .05.
Results of Marginal Effects for Determinants of Climate-Smart Agriculture Adoption.

Source. Calculated based on field survey; numbers outside and brackets are marginal effect and the standard error.
Access to climate information (β = −.688) is associated with a lower latent propensity for adopting crop diversification (Table 7). However, the marginal effects analysis indicates that households with access to climate information are, on average, 83.7% more likely to adopt crop diversification, holding other factors constant (Table 9). The influence of other model components or the way the knowledge enables some households to get past obstacles to diversification could be the cause of this positive marginal benefit.
The study found that the TLU (β = −.840) has affected the adoption of CD significantly (p < .01) and negatively (Table 7), indicating an inverse relationship between CD and livestock holding. The adoption of CD decreases from 90.7% at TLU of 0.17 to 65% at the TLU of 1.67 (Table 9). This could be due to land fragmentation in the study area (Iaip, 2018), where households had to reduce livestock numbers to diversify crop production or limit crop production to save grazing land. The FGD participants asserted that due to the fragmentation of the land, they were forced to reduce the number of livestock they rear. This contradicts the findings of Mekuria and Mekonnen (2018), which found that livestock holding had a significant and positive impact on crop-livestock diversification in their respective study area.
Total income from crop production (β = .061) has a positive and significant (p < .01) impact on the adoption decision of CD technology by the sample smallholder farmers (Table 7). Smallholder farmers with better-diversified crop sales income may be more motivated to adopt the technology.
The probability of adopting CD by smallholder farmers increases sharply with income. The probability of adoption is nearly 100% when the level of income approaches ETB 60,000 and above, indicating that diversification is significantly supported by greater incomes (Figure 2). This finding is consistent with other similar studies in their respective study areas, in which farmers benefited from crop diversification (Mango, Makate, Mapemba, et al., 2018), which in turn motivated them to focus on CD technology. It is also in congruence with Mebrate et al.’s (2022) findings that wealth motivates smallholder farmers to focus on CSA technologies adoption.
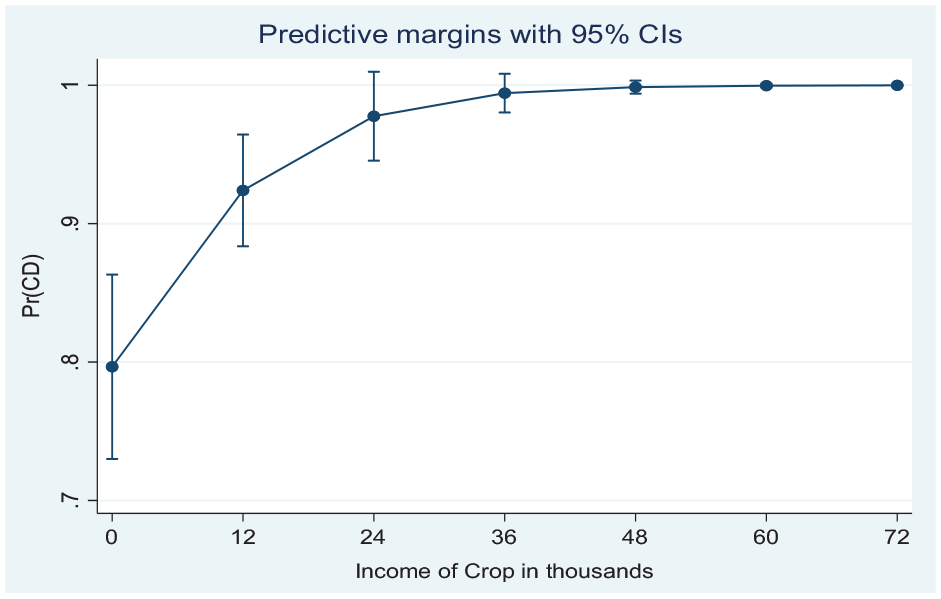
Predictive margins plot of crop income on crop diversification (CD).
Factors Determining Adoption of Agroforestry (AF)
Agroecological zone (β = .490) has positively and significantly (p < .01) impacted the decision of adopting agroforestry technology by the smallholder farmers in the study area (Table 7). The probability of adopting agroforestry is higher in Midland (.908) compared to Highland, followed by Lowland (.744), holding other factors constant (Table 9). The FGD participants asserted that the midland AEZ is suitable for various plant and tree types, including fruit crops such as avocado, mango, oranges, lemon, papaya, coffee, kchat, banana, maize, and haricot beans. Hence, AF technology is more widely adopted by smallholder farmers in Midland due to the AEZ’s suitable weather conditions for different crop and tree species. However, different studies show mixed results in different countries. For instance, highlands are the highest adopters of the technology in Rwanda (Mukundente et al., 2019), while midland was the highest in Uganda (Safari et al., 2023).
Training (β = .415) received within the past 12 months has also positively and significantly (p < .05) affected the adoption decision of the AF technology, as assumed (Table 7). The training received in the past 12 months increases the probability of adopting agroforestry technology by 80.8%, holding other factors constant (Table 9). As the KII participants asserted, especially the training provided at the farmers’ field level has contributed to the adoption of this technology, indicating that the more the farmers received relevant training related to their agricultural activity and CSA technology, the more they tended to adopt the technology. The result is also in line with that of Sisay et al. (2023) and Jambo et al. (2021), where those farmers who received the training tended to use the technologies better than others.
The study identified that smallholder farmers’ use of soil and water conservation (SWC; β = .540) has a positive and significant (p < .05) effect on AF adoption (Table 7), as those who used SWC schemes tended to adopt the technology more. It increases the probability of adopting agroforestry technology by 85.7%, holding other factors constant (Table 9). The recent government’s green initiatives and watershed management programs also contributed to the adoption of AF, as they increased awareness of tree importance (Beyene & Shumetie, 2023).
The Total Income from Crop Production (β = .020) has a positive and significant (p < .01) influence on the adoption of AF technology by smallholder farmers (Table 7). The probability of adopting the technology increases steadily with income, from 75% at the lowest level to 89% at the highest level, indicating the incremental influence of the crop income on the adoption of the technology (Table 9). According to FGD participants, fruit crops like avocado, mango, and apple are often planted mixed with other crops, such as Indigenous trees like wanza and berbira in the midland AEZ. This increases crop productivity and the adoption rate of AF technology. This finding aligns with previous studies, such as Tega and Bojago (2023), in that income from AF-adopted crops motivates smallholder farmers to adopt AF technology.
Factors Determining the Adoption of Integrated Soil Fertility Management (ISFM)
Agroecological zone (β = 1.028) has a positive and significant (p < .01) impact on the adoption of integrated soil fertility management (ISFM) technology (Table 8). There is are high probability of adopting the technology across all AEZs. However, compared to Highland AEZ, both Midland (92.9%) and Lowland (92.7%) have more influence on the adoption decision of the technology (Table 9).
It is identified that TLU (β = −.954) has negatively and significantly impacted the adoption of ISFM, which means they have an inverse relationship (Table 7). The probability of adopting ISFM technology decreases from 83.3% at 0.17 TLU to 55.3% at 1.67 TLU (Table 9). This could be because when the smallholder farmers use chemical fertilizer, crop residues, and compost for ISFM, they might not give importance to the manure from the livestock. In addition, due to the fragmentation of the land in the study area, the households prefer to minimize the number of livestock due to the shortage of grazing land, which might have implications for ISFM, or it reflects the existence of resource competition between livestock and the ISFM technologies. The result is in agreement with other studies in their respective study area (Hörner & Wollni, 2021).
The Total Yearly Income of Crops (β = .024) has a positive and significant (p < .01) impact on the adoption decision of ISFM in the study area as hypothesized (Table 7). The probability of adopting ISFM increases with an increase in yearly income from crop production. It increases from 78.2% at the lowest level to 89.4% at the highest (Table 9), indicating that the availability of income inspires adoption of the technology. This is because when the total income of the farmers from the past year increased, they would be motivated to invest in production-enhancing technologies such as ISFM. A similar study also identified that household income (including income from crop production) influenced the adoption decision of ISFM by smallholder farmers (Hörner & Wollni, 2021).
Factors Determining Adoption of Small-Scale Irrigation (SSI)
The study showed that AEZ (β = −.502) has a significant (p < .01) effect on the adoption of small-scale irrigation (SSI) in the study area, where Lowland and Midland are less likely to adopt the technology compared to the Highland (Table 7). The probability of adoption decreases from highland (43.2%) to Midland (27.6%) and Lowland (22.5%; Table 9). The study is also in congruence with a similar study by Asfaw Eshetu and Mekonen (2024) in that the agroecology affected the adoption of small-scale irrigation in their respective area. As asserted by FGD and KII participants, the adoption of SSI technology in the Lowland AEZ decreases due to scarcity of ground and surface water, lack of awareness programs, and inaccessibility of groundwater. The Gidawo River and groundwater are not accessible for irrigation due to distance and depth. Despite government attempts, most farmers are not using water harvesting schemes due to a lack of awareness. The government is developing the Gidawo River irrigation scheme and expanding the canal, which may increase adoption decisions in the future.
The adoption decision of SSI was affected by climate information (β = 1.080) positively and with high significance (p < .01; Table 7). The probability of adopting SSI by smallholder farmers increases by 49.3% with having access to climate information, holding other factors constant (Table 9). This could be because those smallholder farmers who perceived climate change, such as the failure/shortage of rainfall in the future, would decide to adopt SSI to escape the impacts of rain-fed agriculture. There is a general understanding that the perceived current and future climate change motivates smallholder farmers to implement CSA technologies (Saadu et al., 2024).
The Landholding Size (β = .393) has a positive and significant (p < .05) influence on the decision to adopt SSI technology among smallholder farmers (Table 7). The probability of adopting SSI technologies rises with the increase in the size of landholding, that is, from 24% at the lowest ha to 37.4% at the highest (2 ha; Table 9). Smallholder farmers with larger land areas tend to adopt the technologies more because of their motivation to increase production and productivity, as well as their capital to invest in SSI. There are signals that farmers are encouraged by their larger land sizes to devote their money to CSA technologies (Saadu et al., 2024).
It is found that higher yearly crop income (β = .051) has a positive and significant (p < .01) effect on the adoption decision of SSI as a CSA by smallholder farmers (Table 7), as they may have adequate savings from previous crop sales. There is a clear upward slope from 16.4% at the lowest crop income to 95.5% at the highest (Figure 3), indicating that SSI requires a lot of resources and is reliant on financial capability. Figure 3 depicts the clear slope of increase in adoption of SSI by smallholder farmers when their past year’s crop production income increases. This finding aligns with Mebrate et al.’s (2022) findings that wealth motivates smallholder farmers to focus on CSA technologies adoption.

Predictive margins plot of crop income on small scale irrigation.
The household’s value of total assets (β = −.034) is associated negatively and significantly (p < .05) with the adoption of SSI technologies (Table 7). As the asset value increases, the marginal effect of the value of the asset on the adoption of SSI decreases. For example, when asset value is at its lowest, the probability of adopting small-scale irrigation is highest (.373). As asset values increase, the marginal effect steadily declines to .146. Keeping all other factors equal, the likelihood of adoption drops by .304 for every unit rise in asset value at an asset value of 10.089 (Table 9). This pattern is consistent with the assets’ total negative coefficient of −.034. Asset value doesn’t significantly influence small-scale irrigation adoption, possibly because wealthier households prefer other methods like livestock or mechanized farming. Asset-rich farmers, who have multiple income sources or are less dependent on agricultural output, may prioritize larger irrigation systems or labor-efficient water-saving technology. Therefore, interventions and support for small-scale irrigation should focus on smallholder farmers with poor asset/capital holdings. The result is not in congruence with another similar study in their respective study area (Zeweld et al., 2015).
It is found that distance from the main market (β = −.864) is associated negatively and significantly (p < .01) with the adoption of SSI by smallholder farmers (Table 7). The probability of adopting SSI decreases from 14.1% at 1.7 km to 10.8% at 2 km (Table 9). This could be due to the higher cost of transporting inputs (like irrigation equipment) and outputs (like crops from irrigation schemes), where farmers who live further away from main markets could be less inclined or able to invest in small-scale irrigation systems. Access to essential infrastructure or support services, such as agricultural extension, which support the adoption of irrigation, may be limited in remote places. Lower profitability for irrigated crops due to limited market access may also deter farmers from implementing irrigation techniques. This implies that creating access to the main market for crops produced through small-scale irrigation by promoting infrastructure facilities, such as all-weather roads to remote rural areas, may motivate smallholder farmers to engage and invest in small-scale irrigation. The finding is in line with other studies in their respective study area where the distance from market is negatively and significantly associated with adoption of SSI (Jambo et al., 2021).
Factors that Affect Integrated Pest Management (IPM) Technology’s Adoption
The adoption of Integrated Pest Management (IPM) by smallholder farmers was positively and significantly (p < .01) influenced by AEZ (β = .580; Table 7) as hypothesized. The probability of adopting the technology is high across the AEZs. However, compared to the Highland, the Lowland tends to be the highest adopter (77.2%), followed by the Midland (60.2%), holding other factors constant (Table 9). This is because of the high temperatures in the Lowlands, which created fertile ground for crop pest proliferation, forcing the farmers to adopt the technology. According to FGD participants at Arada Gale Kebele, farmers used various integrated pest management methods, such as synthetic pesticides, wood ash, smashing, and handpicking, to control crop pests like armyworms, locusts, and birds. To control locusts, they used loud noises like banging tins and drums. The finding was also supported by other studies (Branca & Perelli, 2020; Tadesse & Ahmed, 2023) in their respective study areas.
Training that the smallholder farmers attended in the past 12 months (β = .475) has a positive and significant (p < .05) impact on the decision of adopting IPM (Table 7), indicating that smallholder farmers with access to training were more likely to use IPM as CSA than those without access to such training. Those households that received training, on average, have a 68.4% higher probability of adopting the technology, holding other factors constant (Table 9). Research in Kenya also suggests that farmers trained in integrated pest management are more likely to implement integrated pest control strategies (Muriithi et al., 2024).
Climate information (β = .663) indicates that the smallholder farmers have had a positive and significant (p < .01) effect on the IPM’s adoption decision (Table 7). Access to climate information boosts the probability of adopting IPM by 75.5%, holding other factors constant (Table 9), which indicates that the farmers make informed decisions on the adoption of the technology. It is a fact that crop pest invasion mostly affects crops because of the rise in temperature and failure or shortage of precipitation, which necessitates the protection of crops from crop damage. With current and future predictions about climate change, smallholder farmers tend to be prepared and adopt IPM to protect their crops from pest damage. Another study by Mume et al. (2023) has also shown that smallholder farmers who have adequate climate information tend to adopt IPM more than their counterparts.
The Total Income from the Crop (β = .024) has a positive and significant (p < .01) effect on the adoption decision of IPM technology (Table 7). The adoption probability of IPM increases steadily, that is, from 51% at the lowest income from crop production to 90% at the highest income (Table 9), which indicates that the income that smallholder farmers get from their crop production plays a high role in encouraging and enabling the adoption of IPM. This implies that those farmers whose agricultural income increased due to the improvement of production (which may also be enhanced by pest control) would be likely to adopt the technology. The result is in congruence with the study of Midingoyi et al. (2019), where the past on-farm income had a positive and significant association with the adoption of IPM technology among mango-growing farmers in Kenya.
In summary, AEZs affected all the CSA technologies positively and significantly (except for SSI). Income from crops is the most prominent and consistent positive driver of all adoption practices. The influence of income is greater on CD and SSI in that the probability of adopting CD and SSI increases sharply with crop income. On the other hand, other factors such as training, use of soil and water conservation, landholding (ha), climate information, tropical livestock unit, distance from the market, and value of assets exhibited more mixed and complex influence on adopting different CSA technologies.
Heterogeneity Analysis of Determinants of Climate-Smart Agriculture Among AEZs
Understanding heterogeneity in determinants of climate-smart agriculture among smallholder farmers is crucial for developing targeted interventions. As research shows, incorporating multiple practices can improve food security and resilience against climate change impacts (Legesse et al., 2024). To comprehensively understand the dynamics of smallholder farming, particularly in diverse AEZs with varying conditions, heterogeneity analysis is conducted. A multivariate probit model is used to analyze the adoption of CSA technologies among AEZs, identifying agroecology-specific factors affecting each technology’s acceptance. The results are indicated in Supplemental Material S3.
The adoption of crop diversification technology in different agroecological zones (AEZs) is influenced by various factors, including community responsibility, training, participation in cooperatives, landholding, and the effect of Tropical Livestock Unit (TLU). Community responsibility is particularly strong in the Midland AEZ, with training and participation in cooperatives influencing the adoption of CD technology in Midland and Highland, respectively. Landholding (coef. = 1.823**) affects CD adoption in the Lowland, with larger landholdings fostering crop diversification. The result is in agreement with a study by Mussema et al. (2015) but in disagreement with that of Aboye et al. (2023), where farmers with large land size hesitated to adopt the technology in the face of climate change. The effect of TLU is negative and significant in Highland and Lowland, with income from crop yields positively impacting adoption of the technology in the Highland and Midland. Distance from the main market also positively affects CD adoption in Midland, possibly due to better access to all-weather rural road networks. The study by Ahmed et al. (2016) also indicated that proximity to markets enhances the likelihood of adopting productivity-enhancing technologies, including crop diversification strategies, indicating farmers farther from access to the main market hesitate to adopt the technology due to the cost of inputs and transportation.
The adoption of agroforestry (AF) technology in the Lowland and Midland AEZs is positively influenced by household members’ community responsibility, training, and climate information. Smallholder farmers with better climate information have better adoption rates. The study by R. Kassa (2024) also indicates that household members’ responsibility has a positive effect on the adoption of the technology. However, distance from the main market negatively affects the adoption of AF technology in the Lowland, possibly due to transport and logistic costs associated with equipment and inputs.
The adoption of Integrated Soil Fertility Management (ISFM) in the Highlands is positively influenced by community responsibility (coef. = .236**) and climate information (coef. = 1.023**). Training received in the past 12 months (coef. = 1.514**) has a significant positive impact on smallholder farmers in the Midland. Landholding (2.130**) has a strong positive impact on ISFM adoption in the Lowland, while TLU has a negative impact. Large land areas motivate farmers to adopt ISFM, while increased livestock numbers may decrease interest. The value of an asset has a negative impact in the highland and a positive impact in the lowland, indicating heterogeneity in adoption. This indicates that intervention should focus on poorer smallholder farmers to promote ISFM in the Highlands.
Smallholder farmers’ training has a positive impact on the adoption of small-scale irrigation (SSI) in Midland and Lowland AEZs, where it has a stronger impact in the Lowland (coef. = 1.141**). Recent studies also underscored that increased awareness and understanding of irrigation through targeted training can lead to higher adoption rates among smallholder farmers (Idahe & Solomon, 2024). Soil and Water Conservation (SWC) schemes have a positive impact in the Highlands due to the mountainous and sloping terrain. Landholding size negatively affects SSI adoption in the Midland, while it has a stronger positive influence in the Lowland, which could be due to the fragmentation of the land in the Midland and much of the land being occupied by perennial crops like coffee, weese/enset, kchat, and fruit crops (avocado, mango, papaya, banana, etc.), while there is the likelihood of large landholdings suitable for annual crops (maize, haricot bean, sorghum, etc.) in the Lowland. The FGD participants also affirmed that their landholding is fragmented and the existing land is occupied more by weese and coffee mixed with fruit crops in the Midland. TLU and crop yield income from the past year have a positive impact on SSI adoption in the Midlands. However, distance from the main market negatively affects its adoption, as farmers farther from the main market are discouraged due to the cost of input and transportation. This indicates that context-specific intervention is required for each AEZ.
Being male-headed households significantly influences the adoption of Integrated Pest Management (IPM) in the Lowland, due to increased exposure to technology and knowledge. The result is also in congruence with other studies (Belay et al., 2023). Community responsibility also affects IPM adoption in the Highlands. Training received in the past 12 months and the use of SWC schemes have a positive impact on IPM adoption in the Midland. Participation in cooperatives and climate information also influences IPM adoption in the Highlands and Lowlands, respectively. Landholding has a negative and positive impact in the Midland and the Lowland, respectively. On the other hand, income from last year’s crop yield has a slight positive influence in the Midland AEZ. This indicates the existence of heterogeneity in adopting the technology and the necessity of area-specific measures of intervention in promoting it.
In summary, the heterogeneity analysis revealed that the adoption of different CSA technologies varies across AEZs, with factors such as gender, landholding, and TLU having distinct effects. Similarly, training, climate information, and community responsibility influence agroforestry and ISFM adoption. Landholding size and training impact small-scale irrigation differently across the zones.
Conclusion
This study aimed to assess the practices of climate-smart agriculture (CSA) technologies and the determinants of smallholder farmers’ decisions on their adoption in the Sidaama Region, Ethiopia. The findings indicated that crop diversification (CD), integrated soil fertility management (ISFM), agroforestry (AF), integrated pest management (IPM), and small-scale irrigation (SSI) were the most commonly practiced CSA technologies in the study area. CD was the most popular technology among smallholder farmers, followed by ISFM and AF. Smallholder farmers rate the adoption of CD as highly effective in enhancing crop production and productivity, with an average score of 3.75. The study also revealed that farmers have been using indigenous practices like crop rotation and intercropping to boost soil fertility and crop productivity, increasing resilience, food security, and carbon sequestration in the agroecosystems, contributing to a reduction in carbon emissions and improved soil fertility. AF, ISFM, and IPM have also contributed to the improvement in crop production and productivity, climate conditions, soil fertility, and pest management. Agroecological zones (AEZs) have a positive and significant influence on all CSA technologies’ adoption decisions (except for the SSI) by smallholder farmers. The probability of adoption increases across all AEZs (midland: 0.952, highland: 0.762, lowland: 0.908), where smallholder farmers in the midland are more likely to diversify. Income from crops is the main and consistent positive driver of all the adoption practices, with higher income from crop production leading to a higher adoption tendency of CSA practices by smallholder farmers. Its influence is more on CD and SSI, where the probability of adopting CD and SSI by smallholder farmers increases sharply with crop income. For instance, the adoption probability of CD is nearly 100% when the level of income approaches ETB 60 thousand and above, and there is a clear upward slope of adopting SSI from 16.4% at the lowest crop income to 95.5% at the highest.
Training, use of soil and water conservation, landholding (ha), climate information, tropical livestock unit, distance from the main market, and value of assets exhibited more mixed and complex influences on the adoption of different CSA technologies. Training received within the past 12 months has a positive and significant effect on AF and IPM, increasing the probability of adopting these technologies by 80.8% and 68.4%, respectively. Landholding is more associated with SSI, with smallholder farmers with larger land areas tending to adopt the technologies more due to their motivation to increase production and productivity, and their capital to invest in SSI. Tropical Livestock Unit (TLU) has a negative and significant association with CD and ISFM, indicating an inverse relationship between TLU and the adoption of the technologies. This could be due to land fragmentation in the study area, where households had to reduce livestock numbers to diversify crop production or limit crop production to save grazing land. Asset value has less of an impact on the uptake of SSI, as wealthier households might favor other approaches like livestock, mechanized farming, or other revenue-generating ventures. Distance from the main market is negatively and significantly associated with the adoption of SSI by smallholder farmers, decreasing the probability of adopting SSI from 14.1% at 1.7 km to 10.8% at 2 km. The heterogeneity analysis reveals that CSA technology adoption varies across AEZs, with factors like gender, landholding, and TLU influencing small-scale irrigation adoption having distinct effects. Training, climate information, and community responsibility also influence agroforestry and ISFM adoption. These findings underscore the need for context-specific interventions tailored to agroecological conditions.
The Implications of the Findings for Policy and Practice
The adoption of CSA technologies is influenced by various factors, with AEZs having a positive effect on all technologies except SSI. Income from crops has a significant effect on all CSA technologies, but other factors have mixed and complex effects. A comprehensive policy framework is needed to address the conflicting effects of AEZs, climatic information, and livestock holding on CSA technology adoption. Agroforestry and IPM are more commonly adopted by farmers in midland and lowland AEZs, but SSI adoption is low in these areas. Policy strategies should focus on strengthening existing irrigation schemes, enhancing new infrastructure, and providing tailored extension services. Collaboration among different sectors is crucial to address the complex nature of CSA adoption. Creating access to the main market through promoting infrastructure facilities, such as all-weather roads to remote rural areas, and boosting extension services is crucial for farmers’ needs. Local, regional, and federal governments and stakeholders can create an enabling environment for CSA technologies’ adoption, boosting agricultural productivity and resilience to climate change.
Limitations of the Study
This study focuses on the adoption of climate-smart agriculture technologies (CSA) by smallholder farmers in three different agroecological zones in the study area. The researchers used the innovative Kobo Toolbox and its data collection extension, Kobo-Collect, to collect representative data from these zones. The study aims to promote context-specific implementation of CSA technologies by policymakers, regional and local governments, and NGOs, which can be considered as its strengths. However, the study has limitations, such as using cross-sectional data, focusing on only a few CSA technologies, and focusing on a few districts, making it difficult to generalize to the entire region. Future studies should include longitudinal data on CSA adoption practices and determinants, include other important technologies, and focus on more representative districts. Additionally, future studies should focus on specific technologies to provide detailed findings on their adoption practices and determinants.
Supplemental Material
sj-doc-1-sgo-10.1177_21582440251343674 – Supplemental material for Towards Sustainable Future
Supplemental material, sj-doc-1-sgo-10.1177_21582440251343674 for Towards Sustainable Future by Abera Argo Lankamo, Dayanandan Ramalingam, Bantyergu Engida Bati and Samuel Jilo Dira in SAGE Open
Supplemental Material
sj-doc-2-sgo-10.1177_21582440251343674 – Supplemental material for Towards Sustainable Future
Supplemental material, sj-doc-2-sgo-10.1177_21582440251343674 for Towards Sustainable Future by Abera Argo Lankamo, Dayanandan Ramalingam, Bantyergu Engida Bati and Samuel Jilo Dira in SAGE Open
Supplemental Material
sj-docx-3-sgo-10.1177_21582440251343674 – Supplemental material for Towards Sustainable Future
Supplemental material, sj-docx-3-sgo-10.1177_21582440251343674 for Towards Sustainable Future by Abera Argo Lankamo, Dayanandan Ramalingam, Bantyergu Engida Bati and Samuel Jilo Dira in SAGE Open
Supplemental Material
sj-docx-4-sgo-10.1177_21582440251343674 – Supplemental material for Towards Sustainable Future
Supplemental material, sj-docx-4-sgo-10.1177_21582440251343674 for Towards Sustainable Future by Abera Argo Lankamo, Dayanandan Ramalingam, Bantyergu Engida Bati and Samuel Jilo Dira in SAGE Open
Supplemental Material
sj-docx-5-sgo-10.1177_21582440251343674 – Supplemental material for Towards Sustainable Future
Supplemental material, sj-docx-5-sgo-10.1177_21582440251343674 for Towards Sustainable Future by Abera Argo Lankamo, Dayanandan Ramalingam, Bantyergu Engida Bati and Samuel Jilo Dira in SAGE Open
Supplemental Material
sj-docx-6-sgo-10.1177_21582440251343674 – Supplemental material for Towards Sustainable Future
Supplemental material, sj-docx-6-sgo-10.1177_21582440251343674 for Towards Sustainable Future by Abera Argo Lankamo, Dayanandan Ramalingam, Bantyergu Engida Bati and Samuel Jilo Dira in SAGE Open
Footnotes
Acknowledgements
The authors acknowledge the support of Hawassa University for logistics support. The authors also acknowledge the respondents of the survey, focus group discussion, and key informant interviews.
Ethical Considerations
The Hawassa University College of Business and Economics Research Ethics Committee granted the research team ethics approval before conducting the study using protocol version No. 1 and approval number CBE_RTT-11/2019, which was issued on November 2, 2023.
Consent to Participate
The enumerators received extensive training on how to get in touch with respondents, gather data, and build strong relationships with them by being cooperative, amiable, honest, and devoid of a hierarchical power structure. Respondents were made aware that the study’s sole goal was academic, that they may quit at any time, and that no one would pressure them to disclose information they did not want to. Respondents were reassured by the research team that their demographic and personal data would remain anonymous and would not be used against them. Therefore, before the start of the focus group discussions, key informant interviews, and interviews, the respondents’ informed consent was sought. Then, the respondents provided oral consent to participate in the interview willingly after they understood the objective of the research and that the views, they raised during the interview would be kept confidential. In this sense, after informing the respondent of the purpose, the first question in the kobo-collect requests their agreement before moving on to the following survey question. Additionally, the spoken consent was recorded in the Kobo Toolbox. Minors are not involved in the study. Throughout the data analysis process, the respondents’ demographic and personal data remained anonymous. To avoid identifying specific individuals, the results were presented in aggregate form.
Author Contributions
Abera Argo Lankamo contribution to through the conception of the research idea, data collection, analysis, and manuscript preparation; Dayanandan R., Bantyirgu Engida Bati, and Samuel Jilo Dira contributed to supervising the research work, guiding the preparation of the manuscript, editing the manuscript, and approving the final work.
Funding
The author(s) received no financial support for the research, authorship, and/or publication of this article.
Declaration of Conflicting Interests
The author(s) declared no potential conflicts of interest with respect to the research, authorship, and/or publication of this article.
Data Availability Statement
The dataset used to analyze the current study is available from the corresponding author and can be accessed through a request for rational reasons.
Supplemental Material
Supplemental material for this article is available online.
References
Supplementary Material
Please find the following supplemental material available below.
For Open Access articles published under a Creative Commons License, all supplemental material carries the same license as the article it is associated with.
For non-Open Access articles published, all supplemental material carries a non-exclusive license, and permission requests for re-use of supplemental material or any part of supplemental material shall be sent directly to the copyright owner as specified in the copyright notice associated with the article.