
Abstract
Climate change is a global event that poses one of humanity’s most serious threats. Consequently, climate-smart agriculture (CSA) provides a once-in-a-lifetime opportunity to adapt to the effects of global climate change while lowering greenhouse gas emissions. The purpose of this study was to investigate the factors that influence farmers’ adoption of CSA practices in the Wondo Genet Woreda in southern Ethiopia. The study employed a mixed-methods approach with 213 randomly selected households (HHs). In the study, descriptive statistics, a composite score index, and an ordered logit regression model were used. Farmers’ awareness of CSA practices was high, which aided them in increasing farm income and farmland productivity. Tree planting, the use of organic manure, and the use of irrigation systems were the most CSA practices in the study area. Furthermore, the findings revealed that education, HH size, income, climate change perception, and farmland size all had statistically significant effects on farmers’ adoption of CSA. Meanwhile, the distance between the farm and the homestead had a negative and significant effect on the level of CSA adoption. Finally, socioeconomic factors should be considered when developing and implementing CSA programs for farmers.
Introduction
Climate change is a worldwide event that poses one of the most serious risks mankind has ever faced, generating floods and droughts and hurting farmers’ livelihoods by influencing ecosystems, water supplies, food security, settlements, and human health (Food and Agriculture Organization of the United Nations [FAO], 2016). Climate and agriculture are strongly interrelated universal processes and thus variations in climate influence agricultural activities. Improving the accumulations of carbon dioxide (CO2) will have a lot of prospective effects on plants and may also have a lot of indirect threats on herbivores and all other food chain members. Dangerous climate conditions such as influential rainstorms, high wind pressures, and high temperatures have much influence on agricultural activities (Amin et al., 2015).
According to IPCC, in several regions of the world, climate change commonly affects agriculture production more negatively than positively and unindustrialized countries are highly vulnerable to further adverse impacts. To minimize these adverse impacts, there are two options: mitigation and adaptation. Mitigation is a reduction of greenhouse emissions and it is mainly the responsibility of developed countries (Adger et al., 2005). Adaptation is a modification of social, ecological, and economic systems in reply to observed or anticipated climate variability through changes in the processes, practices, or structures to moderate detrimental consequences and enhances beneficial ones (Adger et al., 2005; The Energy and Resources Institute, 2006).
To incorporate this approach, CSA intends to solve the overlapping difficulties of climate change and food security (Lipper et al., 2014). The FAO and the World Bank pioneered the concept of “Climatic Smart Agriculture,” claiming that lowering greenhouse gas (GHG) emissions, adapting crops to grow in changing climate conditions, and increasing agricultural yields could result in “triple wins” (Actionaid International, 2014). CSA, on the other hand, is not a novel production scheme; rather, it’s a technique for guiding actions to convert and redirection systems of agriculture to successfully and sustainably improve development, environment, and food security in a changing climate (Kanamaru et al., 2013; Lipper et al., 2014).
No nation is protected from the effects of climate change, and poor countries, which contributed the least to the problem’s occurrence, are the most vulnerable and least adaptable to its consequences (Yesuf et al., 2008). The level of vulnerability depends on environmental and socioeconomic factors (Adger et al., 2005). Environmental factors include climate conditions, quality of soil, topographic exposure, and availability of natural resources, whereas the level of technological development, infrastructure, income, political setup, institutional strength, credit availability, and access to international markets are socioeconomic factors (Adger et al., 2003; Sarun et al., 2018).
Research and development must take into account how well communities and organizations respond to CSA initiatives. Survival necessitates a transformational and reorienting strategy for agricultural development in light of the new realities of climate change (Lipper et al., 2014). As a result, a proactive platform for government agencies, non-governmental organizations (NGOs), donors, the commercial sector, and civil society organizations in Ethiopia is essential if we are to close gaps and improve collective action on CSA.
Climate change and erraticism exist major challenges to agricultural production and the rural livelihood of smallholder farmers (Murray et al., 2016). The contemporary predictions show that the worldwide average annual rainfall through the end of the century is anticipated to rise, while changes in the amount and intensity of rainfall will vary significantly by region (Harvey et al., 2014; IPCC, 2014). GHG absorptions in the atmosphere will continue to increase unless the billions of tons of our annual emissions shrinkage substantially. These climate changes will affect agriculture in many ways and mostly adversely (Arora, 2019; IPCC, 2014).
Currently, approximately 48% (450 million) of Africans live in life-threatening poverty, earning fewer than the US $1.25 per day, with 63% of the continent’s poor living in rural areas and relying on agriculture for a living. At the same time, the continent is experiencing a rapid increase in population and urbanization (Williams et al., 2015). Ethiopia is Africa’s second-most populous country, trailing only Nigeria. Agriculture is the backbone and a cornerstone of the Ethiopian economy, accounting for 50% of GDP, 84% of exports, and 80% of job opportunities (Simane et al., 2016; WorldBank, 2008). Despite having a large contribution to the country’s economy, its production is generally low (Bezabih et al., 2014). To sustainably feed the world’s expanding population in the face of climate change, the agricultural output must increase. The answer to this problem should include climate-smart agriculture (CSA).
Ethiopia’s agriculture is characterized by its reliance on rainfall, and climate change and variability most obviously exhibited in chronic, overwhelming droughts and floods that shook the country’s economic growth (Belete, 2006). The contrary impact of climate variability in Ethiopia is significant (Gebrehiwot, 2013). The expertise of erratic precipitation, which occasionally results in extremely severe droughts; the impact of which, in addition to land degradation, human population growth, and climate change, has significantly harmed the country’s economic, social development, and food security status (FAO, 2016). Ethiopia is thus defined by food insecurity caused by environmentally damaging situations, as well as other structural and institutional factors (Kim, 2014; Simane et al., 2016).
The Ethiopian government has implemented a slew of policies, strategies, and laws aimed at bolstering climate change mitigation and adaptation, as well as sustainable development. Ethiopia has a ministry of environmental protection, forestry, and climate change, which is practiced in only a few countries around the world. To address the effects of climate change, the country has several climate-related policies and strategies in place, including the climate-resilient green economy strategy (FDRE/NAP, 2019). However, it is not well embedded in the local communities, lacks detailed guidelines, manuals, and action plans, and is not sufficiently mainstreamed into existing programmers and projects (FAO, 2011; Simane et al., 2016).
There is a scarcity of satisfactory investigation results on CSA practices in Ethiopia for various agroecology, soil type, precipitation/rainfall pattern, farming system, temperature, and moisture ranges (Jirata et al., 2016). As a result, CSA research projects should be supported. At all levels, data on CSA and conservation agriculture, in particular, are insufficient. Ethiopia, in particular, lacks knowledge and skills in CSA and conservation agriculture. Furthermore, there is no database of climate-smart agricultural practices and technologies that work well and where, allowing farmers, extension agents, or policymakers to decide which practices to scale up and how. An inclusive capacity development approach based on a thorough assessment of the needs of all stakeholders is required for knowledge distribution. Using data collected from small-scale farmers in southern Ethiopia Wondo Genet, this study aims to fill a knowledge gap on CSA adoption in small-scale agriculture by assessing the factors influencing the level of CSA practices; identifying major CSA practices, and local farmer’s perception of CSA. Recognizing this issue, the study used a composite score index and an ordered logit regression (OLR) model to jointly analyze farmers’ level of adoption of CSA practices and factors influencing CSA practice adoption.
Materials and Methods
Description of the Study Area
The study was conducted in the Wondo Genet Woreda which is located in the Northeastern direction from the capital city of the Sidama regional state, Hawassa. It lies about 260 km from Addis Ababa between 38° 37′ to 38° 42′ longitude east and 7° 02′ to 7° 07′, latitude North (Negash & Kelboro, 2014). The area comprises 18 kebeles namely Chuko, Baja, Gemicho-Baja, Watara-Gendo, Babo-Chororo, Gike-Gina, Awaye, Gike-Atoye, Wotera-Kechema, Wosha-Soyoma, Edo, Aruma, Yuwo, Kela 01, Busa, Entaye, Shasha-Kekele, and Gotona-Omuwa (Ango & Bewket, 2009). Reported that the landscape of the study area varies with an altitude ranging between 1,600 and 2,580 m.a.s.l (Figure 1).

Map of the study area.
Sampling Techniques and Sample Size
To determine sample population, multistage sampling techniques were used. In the first stage, three kebeles were chosen purposively from a total of 18 kebeles based on their agricultural potential, proximity to the nearest forest, and agroecology condition. These kebeles were Baja Fabrika, Wosha Soyama, and Eddo. In the second stage, by using a simple random sampling technique, 10% of the households (HH), a total of 213 HHs, were taken from each kebele, thus, 89 HHs from Baja Fabrika, 64 HHs from Eddo, and 60 HHs from Wosha Soyama kebele respectively. The main reason for using the random sampling technique was that all farmers are practicing similar agricultural activities.
Data Sources and Data Collection Tools
Sources of Data
Primary data was collected and attained for a specified purpose, and it was gathered from the original sources, which were respondents. A household survey, key informant interviews, a focused group discussion, and field observations were utilized to collect primary data. Secondary data was acquired based on the actual sources, including thorough desk reviews of peer-reviewed journals, books, conference papers, dissertations, and research reports, as well as extensive desk reviews of both published and unpublished literature.
Household Survey Questionnaire
Cross-sectional data were distributed to sample households via a questionnaire survey once the respondents agreed on research ethics. This method was used to collect data on demography, socioeconomics, biophysics, productivity, selection of technologies, and adoption of CSA practices. Earlier than the final survey was implemented pre-testing was carried out with 25 households. This sample size is consistent with Moore et al. (2011) and Connelly (2008) who recommend 10% of the actual sample size for a pilot study. Following the pretest and focus group discussions, the survey questionnaire was refined and translated into the local language (Sidamegna) to facilitate communication with respondents. A random selection approach was employed to generate samples of individual households from the total households. This approved in obtaining a more representative respondent from the total households’ with equal likelihood, hence increasing efficiency. Formal household interviews were done under the direction of the researcher and/or professional enumerators.
Key Informant Interview (KII)
Key informants from the sample kebeles and Woreda were interviewed to get more qualitative data on the adoption of CSA practices. The purpose of the interview was to promote open interaction among the interviewers involved. About 15 key informants (5 from each kebele) were selected and interviewed for this purpose with the help of kebele leaders.
Focus Group Discussions (FGDs)
FGDs were used to collect information on group nuances and to allow a small group of respondents to be guided by a professional moderator to focus on the core issue of the study topic. The focus group discussant was selected using a purposive sampling technique based on knowledge of the study area’s current and historical environmental, social, and economic status. FGDs were held with a diverse range of participants, including household heads, women-headed households, development agents, and youngsters. In each kebeles, three focus group sessions with five to seven participants each were organized (one focus group discussion in each kebeles). The primary goal of the FGD was to better comprehend the adoption of CSA practices, as well as people’s perceptions about climate change and its causes, and their responses to it. Community knowledge of CSA, the consequences of climate change, and the problems of crop and livestock production, as well as hurdles to efficiently implementing them, were among the key discussion topics.
Field Observation
Field observation is a supporting system for collecting data that can be used to supplement or contextualize data obtained through other means. The researcher went on field trips to validate and supplement the information gathered from the primary and secondary data collection methods. Field observations were used to explore the area’s biophysical, and socioeconomic conditions. While in the study area, the researcher looks at vegetation coverage, topography, herd management, significant development interventions, people’s awareness, and other associated elements.
Data Analysis Methods
The survey data was analyzed using descriptive statistics and econometric models. Descriptive statistics include the mean, frequency, standard deviation, percentages, distribution, and graphs.
Econometric Model Specification
The factors influencing households in the study area’s adoption of CSA practices were investigated using the composite score index and the Generalized OLR Model. The composite score was calculated using the farmers’ replies regarding the extent or level to which they adopted CSA techniques. The farmers were then classified as high, medium, or low users according to a composite score. The respondents are then classified as high, medium, or low users based on a composite score (Abegunde et al., 2020; Ojoko et al., 2017). The ordering of the farmers based on the composite score is used as a dependent variable in a logit model, with hypothesized factors as independent variables (Abegunde et al., 2020).
In rating the farmers’ responses, a binary scale with 1 indicating yes and 0 indicating no is used, with 1 indicating yes and 0 indicating no use of the previously specified CSA practices. With the 11 statements/responses, a respondent can only have 11 and 0 as maximum and minimum points.
High users = Individuals with a point total between 11 and M + SD.
Medium users = Individuals who fall somewhere between the upper and lowest categories.
Low users = those with a point total of between 0 and M − SD.
Generalized OLR can estimate models with fewer restrictions than ordinary OLR, which frequently violates assumptions, but non-ordinal approaches like multinomial logistic regression are less parsimonious and difficult to interpret (Abegunde et al., 2020; Long & Freese, 2001; Williams, 2006). Equation (1) represents the generalized OLR model:

Where N is the number of categories of the ordinal regressand. From the equation stated above, the probabilities that Y will take on each of the values 1. . ., N are equal to


The dependent variable Yi = level of usage of CSA practices (high user = 3; medium user = 2; low user = 1). X1. . . . . .Xn indicates the explanatory variables;

Where Ri2 is the coefficient of determination in the regression of one explanatory variable (X), besides explanatory variables (Xj). The value VIF is 1 if there is no collinearity between regressors. When a variable’s VIF value surpasses 10, as it does when Ri2 exceeds .90, the variable is considered to be very collinear (Gujarati, 2004). To determine the degree of correlation between the dummy explanatory variables, a contingency coefficient is calculated. A score of 0.75 or higher shows that the two variables have a stronger association (Healey, 2010). The contingency coefficient (CC) was computed as:

Where
CC = coefficient of contingency,
χ2 = chi-square test, and
N = total sample size
Description of the Generalized Ordered Logit Explanatory Variables
Table 1 summarizes the explanatory variables used in the model to analyze the determinants of the level of CSA practices among the sampled households.
Variables Name, Expected Signs, Definitions, and Coding.

Results and Discussion
Socioeconomic Characteristics of the Respondents
The results from (Table 2) showed the socio-economic characteristics of the respondents. The majority of respondents (40.8%) fell within the age range of 41 and 50, which corresponds to the farming active years. As a result, they are healthy enough to engage in agricultural activities. This finding is comparable with Demissie (2019), Kom et al. (2020), and Tekeste (2021); study in Climate-smart agriculture practice (CSAP) and its impact on food security in Siyadebrina Wayu Woreda North Shewa Ethiopia, and Ojoko et al. (2017) study in factors influencing the level of use of CSAPs in Sokoto state, Nigeria.
Socioeconomic Characteristics of the Respondents.

Source. Own survey result, 2019/2020.
In Wondo Genet Woreda, Ethiopia, women are only permitted to participate in activities such as harvesting, winnowing, and processing off-farm produce, so 85.46% of the respondents are men. During a group discussion with key informants, participants stated that the majority of farm-related activities were controlled by men, with women only having the right to participate in farm harvesting, winnowing, and postharvest activities. This finding is analogous to Demissie (2019) and Tadesse et al. (2021). These results contradict the findings of Mfundo (2013) and Pujiwidodo (2016), who also perceived that small-scale farming in South Africa is experienced mainly at a local level by elder females. About 30.52% of the respondents only had Grades 1 to 4 education followed by 23.94% with Grades 5 to 8. From the total sampled respondents only 8.92% of the respondents were uneducated. This shows that, when compared to illiterate farmers, the majority of smallholder farmers have sufficient formal knowledge to understand and execute the CSA technology presented in the area.
Results of the farming experience revealed that the majority of the rural farmers (56.81%) had farming experience of 16 to 30 years. Farming experience is very important in farming activities; more experienced farmers are more likely to choose these technologies as it helps the farmer in the area of proper farm management to maximize profit. The study is consistent with Khatri-Chhetri et al. (2017) and Ojoko et al. (2017). Most of the rural farmers’ size of their farmland holdings range between 0.25 and 1.0 ha was 66.20% and on average a farmer owns 0.6 ha of land.
Income Sources of the Respondents
The respondents in the study area were engaged in the production of annual crops, cash crops, and livestock (Dessie & Kinlund, 2008; Mellisse et al., 2018). They also took part in activities away from the farm. With a minimum of 658.33 and a maximum of Birr 11,000, the studied households’ combined monthly revenue from on- and off-farm activities was calculated to be Birr 350,860. On average, the income of the surveyed respondents was estimated to be Birr at 6,106.2 per month. Taking the average family size of 9, the average per capita income was Birr 678.46 per month. This is approximately 10 times higher than Birr 65.83 monthly average per capita income reported by the international monetary fund at the country level (International Monetary Fund, 2019). Higher average per capita incomes in the study area could be due to the production of cash crops.
The majority of key informants and focus group participants claimed that on-farm activities were the main source of income for the area’s residents, notably the money made from the cultivation of cash crops including khat, avocado, papaya, and other fruits (Table 3). Similarly, the findings of the household survey revealed that the total monthly income of these cash crops and other crops was calculated to be Birr 313,873. Specifically, khat and sugarcane products provided 25.3% and 18.9% of average monthly income to 192 (90.14%) and 98 (46%) of the sampled households, respectively. The remaining 55.8% of monthly income came from other cash and annual crops (See Table 3).
The Incomes of the Households.

Source. Household survey data, 2018. Own survey result, 2019/2020.
Note. Purpose of production: sales = 1, consumption = 2, and both = 3.
On the other hand, the monthly income of households from off-farm activities (employment in other farms, trade) was calculated to be Birr 24,982. The fact that off-farm income contributes the least to total family income explains why the majority of the surveyed households can rely primarily on agricultural activities with relatively small landholding sizes for a living. It also shows that a sizable proportion of households engaged in on-farm income-generating activities to meet their family’s livelihood needs. Data on livestock owned by respondents was also gathered. According to the survey results, the surveyed households have more than one cow and less than one other animal (Table 4). Selling milk products earned the respondents Birr 12,005 per month.
Number of Livestock Per Household and TLU.

Source. Own survey result, 2019/2020.
Farmers’ Awareness About CSA Practices
Out of the total 213 sample households, approximately 96.5% had knowledge of CSA and are well-informed about what a CSA is and its functions, while 3.5% of participants were unaware of what a CSA is and its functions. Those who were aware of the CSA were also asked for their thoughts on the significance of CSA practice. In the case of awareness, farmers’ responses were revealed on a three-point continuum scale (fully aware, aware, and not aware), with scores of 3, 2, and 1, respectively. Following that, the frequency was multiplied by the score (3, 2, or 1) to obtain the total weighted score, which was then divided by the total sample households (213) to obtain the weighted mean score (WMS), and rank order was assigned based on the weighted mean score.
Table 5 reveals that CSA helps to enhance farm revenue, which scored first in terms of the weighted mean score (WMS) at 2.47, is followed by CSA helps to boost production, CSA helps to maintain the health of the soil, and CSA helps to adopt animal/plant species and CSA helps to escape drought second, third, and fourth with WMS 2.36, 2.23, and 1.79 respectively. Whereas, CSA helps to escape drought and CSA helps to reduce GHG emissions, ranked fifth, and sixth with WMS 1.62 and 1.6, respectively. This result is in line with Kumar et al. (2016) and Rohila et al. (2018). Furthermore, participants in the focus group discussion, stated that local communities have practiced and are well aware of CSA practices such as physical soil and water conservation activities such as mulching, cultivating improved varieties, applying animal dungs, and water harvesting through the use of ponds.
Farmers’ Awareness on CSAP.

Source. Own survey result, 2019/2020.
Perception of Respondents on a Climate Change Impact
Rainfall distribution and patterns, heat intensity, and temperature were the major influencing factors of CSA practices, which determined the level of productivity of agricultural practices. Furthermore, according to a large number of participants in the focus group discussion, temperature, heat intensity, and rainfall amount distribution and patterns were the major influencing factors for agricultural practices, and their influence has gradually deteriorated. In the previous three decades, households were polled about their impressions of temperature, heat intensity, rainfall amount, distribution and patterns, and extreme event-changing trends. About 94.2% of households supposed an “increase” in temperature, 1.5% of households perceived a “decrease” in temperature, 1.77% of households perceived “no change” in temperature, 2.53% of households said they don’t know about the change. On the other hand, 83.25% of households reported an increase in heat intensity; 1.95% of respondents reported a decrease in heat intensity; 11.3% of respondents claimed no change in heat intensity; and 3.5% of respondents claimed they were unaware of temperature changes, as shown in (Figure 2).

Households’ perceptions on change.
The majority of the surveyed households reported precipitation changes, the extent of rainfall, and/or distribution, in the study area over the past 30 years. A substantial percentage of respondent households (92.6%) perceived the change in the amount of rainfall. Out of 92.6% of households that reported a change in rainfall amount, 80.46% reported a decrease, while the remaining 4.8% reported an increase; on the other hand, 5.1% reported no change in rainfall; and 7.73% of those polled did not pay enough attention to the trend in rainfall volume.
The result also revealed that the mainstream of the respondent households (87.16%) saw a shift in the timing of the rainfall, in particular, 89% shorter wet seasons have been noted, and 3.5% noticed prolonged wet seasons; 3.7% of the responders reported that the rainy season remained unchanged. About 3.8% did not give attention to the situation of the rain seasons.
The two climatic factors that have the most effects on farming activities in the study area are temperature and rainfall. Rainfall is vital to farming because it signals long-term climate system changes. This is in line with the studies of Limantol et al. (2016) and Saguye (2017). The rainfall pattern, on the other hand, is more important to farmers. Farmers may suffer greatly if the correct quantity of rain occurs, followed by a protracted dry spell before the next storm.
Climate Smart Agricultural Practices
In the past, smallholder farmers in the study area have unintentionally implemented CSA as part of their normal agricultural practices. The survey revealed that many of the households were already aware of the CSA practices shown to them (see Figure 2). Widely adopted climate-smart practices were tree planting, effective use of nitrogen fertilizer, irrigation, crop diversity, crop rotation, intercropping, use of organic manure, minimal tillage, and use of terraces, livestock breed improvement, and diversification and mulching.
Results from the analysis of the frequency of use of the CSA practices among the sampled farmers reveal that the use of tree planting, use of nitrogen fertilizer, and irrigation were the most popular practices among the households in the study area. In contrast, the Use of terraces, Mulching, and livestock breed improvement and diversification were the least popular CSA practices.
(Table 6) the degree of use of CSA practices among the respondents in the research area was used to order the farmers into three classes: low, medium, and high users based on the frequency of usage of CSA activities (Figure 3). According to (Table 6), the category of CSA practice users adopted by the sampled households is based on the proportion of CSA practices they use relative to the overall number of CSA activities.
Category of Users of CSA Practices Among Small-Scale Farmers.

Source. Own survey result, 2019/2020.

Frequency of use of CSA practices in the study area.
Consequently, the finding of this study, half (50.2%) of the sampled respondents fell into the category of the high user of CSA practices. About 25.4% and 24.4% were in the low and medium user categories respectively.
Factors Affecting Climate-Smart Agricultural Practices Adoption
The ordered logit model is a return model for a variable having an ordinal answer. A linear function of the covariates with regression coefficients consistent in each cumulative probability is predicted by the model, which is based on the cumulative probabilities of the response variable (Michaels, 1989). In this case, the model’s independent variable is the user’s category of CSA practice (low, medium, and high), where the medium user category serves as the control category in the model.
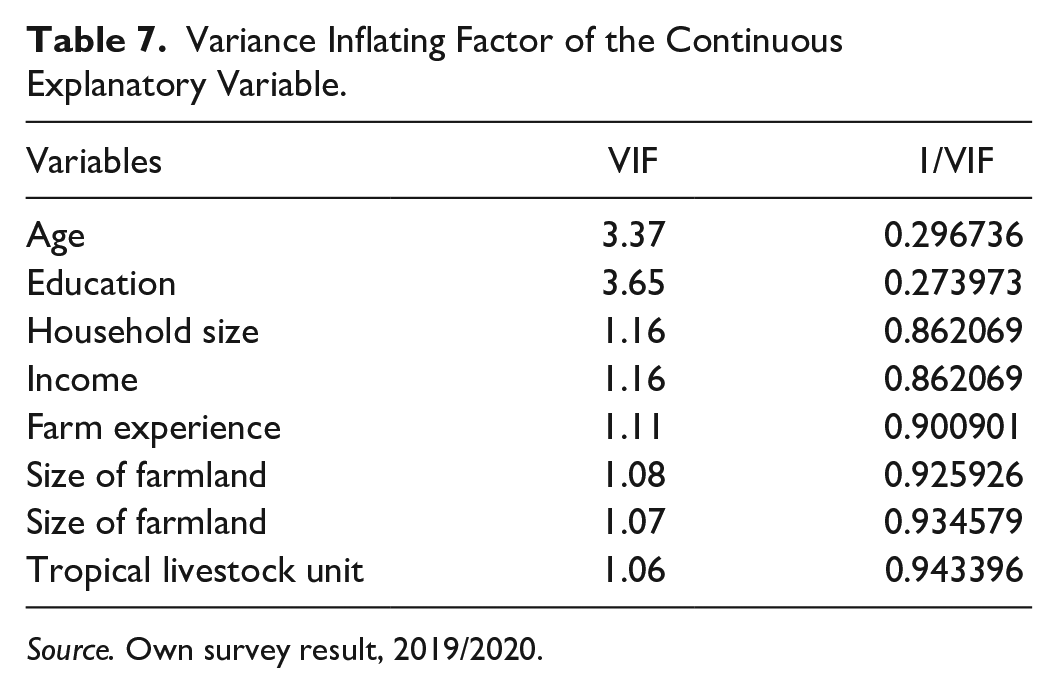
Before running the order logistic regression model, the independent variables were tested for multicollinearity and degree of association using the Variance inflating factor (VIF), and Contingency coefficient (CC). According to the VIF, the data did not have a significant problem with multi-collinearity. That is, the VIF of the continuous variables was below 10 (Table 7), indicating that the whole continuous variables were included in the regression analysis. The CC was also used to calculate the degree of association between dummy variables. The CC analysis reveals a weak relationship among the dummy explanatory variables (Table 8). As a result, the regression analysis included all of the dummy variables.
Variance Inflating Factor of the Continuous Explanatory Variable.
Source. Own survey result, 2019/2020.
Contingency Coefficients for Dummy Explanatory Variables.

Source. Own survey result, 2019/2020.
The goodness-of-fit of the models was also measured using pseudo-R2. The pseudo-R2 was computed at .1406 in lower to medium interaction and .143 in high to medium interaction. Each of the logit regression models passed the goodness of fit tests recommended by Pallant and Tennant (2007) and Iyer et al. (1991).
In addition to checking the model’s goodness of fit, a diagnostic test was run to ensure that the proportionate odds assumption was met in the models utilized. Because the proportional odds assumption is violated, a generalized ordered logistic model is preferable to an OLR model or an ordered probit regression model. A test was run for the model fit for the low and high levels of usage of CSAPs in the study area. The null hypothesis is that there is no difference in the coefficients between models. Results on the approximate likelihood-ratio test of proportionality of odds across the response categories for low levels of usage of CSAPs (prob > χ2 = .001), and high label usage of CSAPs (prob > χ2 = .0048) indicate that there are significant differences in the coefficients in the models (Table 9). This finding suggests that the proportional odds assumption or the parallel regression assumption has been violated.
Order Logit Model Results of the Factors Influencing the Level of CSAP.

Note. The reference category was created using the medium user category. Data from a survey, 2019/2020.
, **, and * signify statistical significance at the levels of 1%, 5%, and 10%.
(Table 9) shows that, the education of the household head was significant and positively influences the level of adoption of CSA practice in the lower and higher user categories at a 5% (p = .002 and .016) level of statistical significance respectively. This shows that farmers are more comfortable using current CSA practices and advances the more educated they are. This is consistent with research from (Abegunde et al., 2020; Akudugu et al., 2012; Ojoko et al., 2017). Those authors stated that educated farming households would easily adopt modern agricultural production technologies and strategies (Abid et al., 2015; Ade & Bosede, 2016; Sebatta et al., 2014; Ume et al., 2020) study reveals that education has a positive effect on smallholder farmers’ CSA practice. This implies that education allows a farmer to make educated judgments and identify farm-related opportunities for profit maximization where they exist. Therefore, the use of CSA practices and their propagation among rural farmers depend on this factor.
The lower degree of CSA adoption is negatively correlated with the respondents’ farmland’s distance from their homestead, which is statistically significant. As a result, farmers who cultivate distant from their homesteads are probable to use CSA practices less frequently. This might be due to the difficulties they would have in practicing good and effective management due to the stress presented by distance as compared to their peers who live nearer to their farms. Apart from affecting market accessibility (Abegunde et al., 2020; Teklewold et al., 2013), distances can also affect important aspects of agriculture, such as access to technology, knowledge, and financial institutions.
Another important factor that influenced the use of CSA practices in the research area was the size of farmland at (p = .028) and (p = .045), respectively, the size of the farmland statistically and positively affected the degree of adoption of CSA techniques in both the lower and higher user groups. This study suggests that farmers with larger farmlands adopted more CSA adoption techniques, indicating that encouraging farmers to adopt CSA practices is a good thing. This outcome is in line with that of Kom et al. (2020) and Teklewold et al. (2013). The findings support the findings of Abegunde et al. (2020), who found that land fragmentation may be a barrier to CSA implementation. Land is a vital resource in agricultural output, and farmer households who have access to land and other resources will be able to host the novelties or techniques required for a fruitful agricultural endeavor.
The sample household’s perception of the consequence of climate change was statistically significant at 5% (p = .024) at a higher level user category. Farmers perceive climate change to harm agricultural production in the study area, especially for high users. Additionally, this research indicates that farmers who believe that climate change has a major negative impact on agricultural production would use more CSA practices. This is associated with the finding of Abegunde et al. (2020), Justin et al. (2017), and Teklewold et al. (2013). Farmers who observed an increase in floods and fluctuations in moisture levels in their area were more likely to implement more CSA techniques, according to the study. This outcome is unsurprising, given those farmer respondents who recognize the threat associated with severe weather, and changing climatic tendencies recognize the importance of CSA practices in improving their resilience to climatic impacts. The findings on farmers’ perceptions of climate change imply that a sufficient degree of knowledge of climate change’s negative impact on agricultural output among farmers will prospectively boost CSA adoption in the area’s farming system.
Conclusion and Recommendation
In response to the challenge posed by global climate change, farming operations are now succeeding thanks to CSA. Few studies have been done to look into the variables affecting the level of CSA adoption among small-scale farmers in Ethiopia. This study closes that gap by identifying the factors influencing the extent to which small-scale farming households in Wondo Genet areas, south-central Ethiopia, adopt climate-smart agricultural practices. Farmers in the study area generally embraced local CSA techniques like tree planting, nitrogen fertilizer use, and irrigation.
This research investigated that factors like household size, income, education, homestead distance from the farm, farm size, and perception of climate change/variability are more likely to be significant variables in CSA adoption within the study area. The most important socioeconomic and demographic factors (education, income Size of farmland perception of temperature change that is positively correlated with CSA practice) should be considered in CSA practice. This implies that policy options for developing the main idea of local people’s contribution should take these variables into account.
As a result, the study concluded that to achieve any effective adoption action in these communities and the district as a whole, existing institutions must be strengthened. Similarly, research investigation, supportive programs, and policy should emphasize the adoption of CSA practices, particularly those that are not widely used by farmers, as well as strengthening plus enhancing the adoption of the most important CSA practices. To boost domestic productivity, policymakers should encourage and provide technical assistance to households that practice agricultural practices that promote soil fertility and productivity, as well as encourage farmers to participate in larger CSAs packages. Because the research was time-limited and budget-constrained, such research should be conducted at the landscape level to provide policymakers and practitioners with a comprehensive picture of CSA practices-related information at the landscape level.
Footnotes
Declaration of Conflicting Interests
The author(s) declared no potential conflicts of interest with respect to the research, authorship, and/or publication of this article.
Funding
The author(s) received no financial support for the research, authorship, and/or publication of this article.