
Abstract
Accurate prediction of tourist flow is essential for effective crowd management and service optimization in popular tourist destinations, especially during peak hours and high-frequency periods. This study proposes a novel deep learning model—BiGRU-Attn, which integrates Gated Recurrent Units (GRU), Attention Mechanisms, and Bidirectional Recurrent Neural Networks (BiRNN) to capture complex temporal dependencies in sequential data. The model is evaluated using real-world, high-frequency passenger flow data from Fuzhou National Forest Park, a major sport tourism site in China. Comparative experiments against five baseline models—including both bidirectional and conventional recurrent architectures—demonstrate the superior predictive performance of BiGRU-Attn. It achieved the highest R2 (.948) and the lowest RMSE (218.986), MAE (131.914), and MAPE (0.340) in 72-hr forecasts. During peak-hour periods (12:00–18:00), BiGRU-Attn maintained an R2 above .9, consistently outperforming all other models. Notably, bidirectional models (BiGRU-Attn and DBi-LSTM) showed clear advantages over their conventional counterparts, particularly in capturing short-term fluctuations. These findings underscore the potential of BiGRU-Attn to support smart tourism applications, enabling more accurate real-time visitor flow forecasting, proactive resource planning, and enhanced visitor experience management in dynamic environments.
Plain language summary
Tourist attractions, especially during holidays or peak hours, can become overcrowded. To help manage visitor flow and improve services, this study developed a computer model that can predict how many people will visit a tourist site each hour. The model uses anonymous location data from mobile devices, known as Location-Based Services (LBS) data, to understand visitor patterns. We tested the model using real data from Fuzhou National Forest Park, a popular destination in China.
The model combines advanced machine learning techniques—specifically Gated Recurrent Units (GRU) and Attention Mechanisms—within a bidirectional structure. It accurately predicted tourist flow up to three days in advance and performed especially well during busy periods. Compared to five other models, ours produced the most accurate results.
This approach can help tourism managers prepare in advance, adjust staffing, and control crowds more effectively. In the future, the model can be adapted for use in other types of tourist sites, such as amusement parks and cultural landmarks.
Introduction
Tourism demand forecasting is a critical field in tourism management, enabling stakeholders to optimize resource allocation and improve visitor experiences. Passenger flow forecasting, as a central element of demand analysis, facilitates both long-term planning and short-term operational decision-making. Long-term forecasts help predict revenue, inform infrastructure development, and guide pricing strategies (Feng et al., 2022). Short-term forecasts are essential for adjusting staffing levels, opening hours, and crowd control measures, especially during peak hours (Cranmer et al., 2023; Sahu et al., 2024). These short-term predictions are increasingly vital in the context of growing tourism demand, which requires highly dynamic management practices.
Passenger flow forecasting research has evolved along three methodological streams: time series models, economic models, and AI-based models (Massai et al., 2019). Time series models, such as autoregressive integrated moving average (ARIMA), have been widely adopted for their simplicity and interpretability, but they often struggle with nonlinear patterns and complex temporal dependencies (Dong et al., 2023). Economic models, which incorporate variables such as pricing and socio-economic factors, provide additional explanatory power but are often limited in their ability to predict short-term variations (Gallent et al., 2023; Li et al., 2024). In contrast, AI-based models, particularly those leveraging deep learning techniques, have demonstrated significant advancements in capturing complex patterns in visitor flow data. For instance, LSTM networks have proven effective in modeling sequential data and have been successfully applied to intercity transportation systems (Yu et al., 2024) and urban mobility scenarios like bike-sharing services (Xu et al., 2023). These models outperform traditional methods in terms of accuracy and adaptability, as shown in applications ranging from mobility predictions to urban air transport demand (Long et al., 2023).
Despite the advantages of AI-based approaches, most research has focused on low-frequency forecasting, such as monthly, weekly, or daily predictions, which are less useful for real-time decision-making (Li et al., 2024; Liu et al., 2023). High-frequency forecasting, such as hourly predictions, is particularly important for managing sudden surges in visitor numbers during peak times. UNESCO’s World Heritage Sustainable Tourism Toolkit highlights the necessity of intra-day flow predictions to alleviate congestion and enhance tourist satisfaction (Bigne et al., 2021). Despite recent progress in tourism demand forecasting, high-frequency prediction (HFP) remains relatively underexplored in the existing literature. Comparative evaluations of advanced deep learning models—particularly GRU and LSTM architectures—under high-frequency conditions are still limited (Dong et al., 2023; Gui et al., 2021). Meanwhile, technological advancements such as augmented reality (AR) and geospatial analytics have shown promise in enhancing understanding of tourist behaviors and preferences (Jung et al., 2021; Kim et al., 2021); however, their application to HFP tasks remains insufficiently developed (Zhang et al., 2025; Zhou & Huang, 2024). In addition, data availability and quality continue to pose a major challenge. Most prior studies have relied on aggregated, low-frequency official statistics, which lack the temporal resolution necessary for effective HFP (Ma & Li, 2023). In contrast, emerging data sources—such as location-based services (LBS) and geotagged social media—offer richer spatial and temporal granularity (Gasparetti, 2017; Xue et al., 2023). These data types have been successfully leveraged in various tourism and urban studies to measure urban vitality (Li et al., 2022), capture public sentiment (Yang & Zhang, 2024), and analyze environmentally responsible tourist behavior (Fenitra et al., 2022), yet their full potential in predictive modeling of passenger flows remains largely untapped. Additionally, spatiotemporal big data has facilitated the analysis of holiday-specific mobility trends, providing actionable insights for tourism management (Anderson et al., 2022; Yu et al., 2024). In related fields, hybrid approaches combining geospatial, textual, and temporal data have been applied to urban sustainability (Liu et al., 2023), disaster risk reduction (Anderson et al., 2022), and environmental monitoring (El-Rawy et al., 2024). These advancements underscore the potential of integrating spatiotemporal data with AI for high-frequency forecasting.
Recent advancements in artificial intelligence and big data have led to the development of diverse methods for analyzing and predicting tourism patterns. For example, Jiang and Han (2025) proposed a knowledge graph-driven recommendation system that models both long- and short-term tourist interests to enhance personalized attraction suggestions. Similarly, Liu et al. (2025) introduced a steady-state Markov chain framework to capture short- and long-term dynamics in tourism flow networks, highlighting the importance of integrating temporal behaviors in predictive models. While these approaches provide useful insights, they are often limited in their ability to handle real-time, high-frequency data. Liu and Meng (2024) further demonstrated the role of user-generated content, such as online reviews in sports tourism, in influencing tourists’ behavior, yet their focus remains on value co-creation rather than flow forecasting. On a broader spatial scale, Terroso Sáenz et al. (2023) applied graph neural networks combined with heterogeneous open data to predict national-level tourist flows, but the generalization of such models to localized, high-resolution forecasting scenarios remains a challenge. Additionally, Xiao et al. (2025) explored spatiotemporal sentiment detection in high-A-level tourist attractions, offering deeper understanding of tourist perceptions, yet without linking such insights to predictive modeling. Meanwhile, Zhou (2023) utilized basic neural networks for predicting carrying capacity in scenic spots but did not address peak-hour variations or short-term fluctuations. These studies collectively reveal a gap in models that can offer both temporal granularity and real-time adaptability, especially in high-frequency scenarios. Addressing this gap, our study proposes a BiGRU-Attn framework that leverages bidirectional structures and attention mechanisms for more accurate and dynamic tourist flow prediction. The model leverages LBS data to capture short-term variations in visitor flows, providing more granular and actionable insights for tourism management. Real-world data from Fuzhou National Forest Park, a prominent sport tourism destination in Fuzhou, Fujian Province, China, is used to evaluate the model. Comparative experiments are conducted against five baseline models, including both bidirectional and conventional recurrent neural network architectures. Performance is assessed using metrics such as R2, Root Mean Square Error (RMSE), Mean Absolute Error (MAE), and Mean Absolute Percentage Error (MAPE). Results demonstrate the BiGRU-Attn model’s superior predictive accuracy, particularly during peak-hour scenarios.
This research is guided by the following core questions:
(1) Can a BiGRU-Attn architecture improve high-frequency forecasting accuracy compared to existing models?
(2) How do different RNN-based architectures perform under high temporal resolution, especially during peak tourist hours?
(3) What practical benefits does the use of LBS-based spatiotemporal big data bring to real-time tourism management?
By addressing these questions, the study contributes to the field in three key ways: (1) it introduces a HFP framework that captures intra-day passenger flow dynamics with enhanced granularity; (2) it offers a comparative evaluation of deep learning architectures, deepening understanding of model capabilities for tourism forecasting; and (3) it underscores the role of spatiotemporal big data in developing intelligent systems for “smart scenic spots.” These findings provide actionable insights to support proactive tourism management and improved visitor experiences.
Related Work
Basis of Deep Learning Algorithms
The high-frequency prediction of scenic spot passenger flow involves forecasting future trends by leveraging historical passenger flow data and associated variables. This prediction task is fundamentally rooted in time series analysis, which requires advanced deep learning algorithms capable of modeling sequential dependencies. Recurrent Neural Networks (RNNs) and their advanced variants, such as Bidirectional Recurrent Neural Networks (BiRNNs) and Gated Recurrent Units and Attention Mechanisms (BiGRU-Attn), are highly effective for such tasks as shown in Figure 1. These algorithms enhance the model’s ability to process temporal data and handle dynamic patterns effectively.

Structure of bidirectional RNN with GRUs and attention features.
Bidirectional RNNs, introduced by Schuster and Paliwal (1997), improve upon traditional RNNs by processing input sequences in two directions: forward and backward. Unlike conventional RNNs, which rely only on past states for predictions, BiRNNs utilize both past and future contexts to better capture complex patterns in time series data. This dual-direction approach is particularly advantageous for predicting passenger flow, where understanding the influence of both preceding and succeeding states is crucial.
The BiRNN architecture is mathematically expressed as follows:


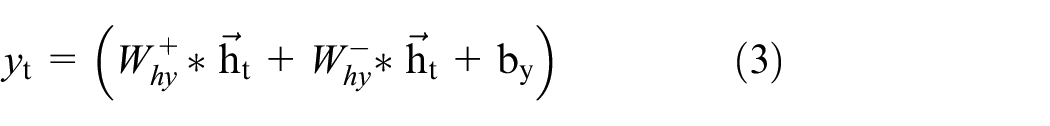
Where:
This structure enables BiRNNs to effectively capture temporal dependencies in passenger flow data, making them highly suitable for HFP (Lu et al., 2020; Tencent Company, 2024).
GRUs, a variant of RNNs, have gained popularity for addressing the challenges of vanishing gradients and inefficiency in traditional RNNs. Proposed as a simplified alternative to LSTM, GRUs incorporate two gates—reset and update—that regulate the flow of information, allowing the model to focus on relevant time steps while efficiently processing long sequences. This feature makes GRUs particularly adept at handling high-frequency passenger flow data (Hochreiter & Schmidhuber, 1997; Wu et al., 2018). The GRU model is mathematically defined as follows:


Where
To further enhance GRU performance, attention mechanisms are integrated. Attention dynamically allocates weights to input sequences, enabling the model to focus on the most relevant time steps for prediction. This is particularly valuable for high-frequency passenger flow prediction, where not all data points equally impact the forecast.
The attention mechanism is formulated as follows (Li et al., 2019):


Where
By combining GRUs with attention mechanisms, the model achieves higher accuracy by focusing on critical features, making it an ideal solution for dynamic passenger flow forecasting in smart tourism systems (Yu & Chen, 2017).
Conversion Process of LBS Data
To accurately predict passenger flow using Location-Based Services (LBS) data, it is crucial to manage both the time-frequency resolution and spatial boundaries of the analysis. LBS technology leverages mobile wireless networks and positioning sensors to gather large-scale, real-time geographic data from users, making it a valuable resource for analyzing mobility patterns and predicting visitor flows (Becken, 2013). This study presents a systematic framework for converting raw LBS data into detailed, high-frequency visitor flow information specific to scenic attractions. The process consists of three key steps: setting the time-frequency resolution, defining spatial boundaries, and transforming the raw data into actionable insights.
Figure 2 provides a detailed visualization of the transformation process, showcasing two main components: a schematic diagram of the conversion process and an operational flow chart. The schematic diagram highlights three essential stages: determining time-frequency resolution, defining the spatial scope, and performing data conversion. The first stage filters LBS data to match the required prediction intervals, such as hourly or daily, while the second stage defines the scenic area’s geographical boundaries using a spatial mask represented by a blue line. Inside this boundary, a grid illustrates the spatial distribution of visitor flow derived from LBS data. The final stage involves matching tourists’ coordinates with the defined spatial boundaries and aggregating the number of individuals present within the area at each time interval to generate structured time-series datasets.
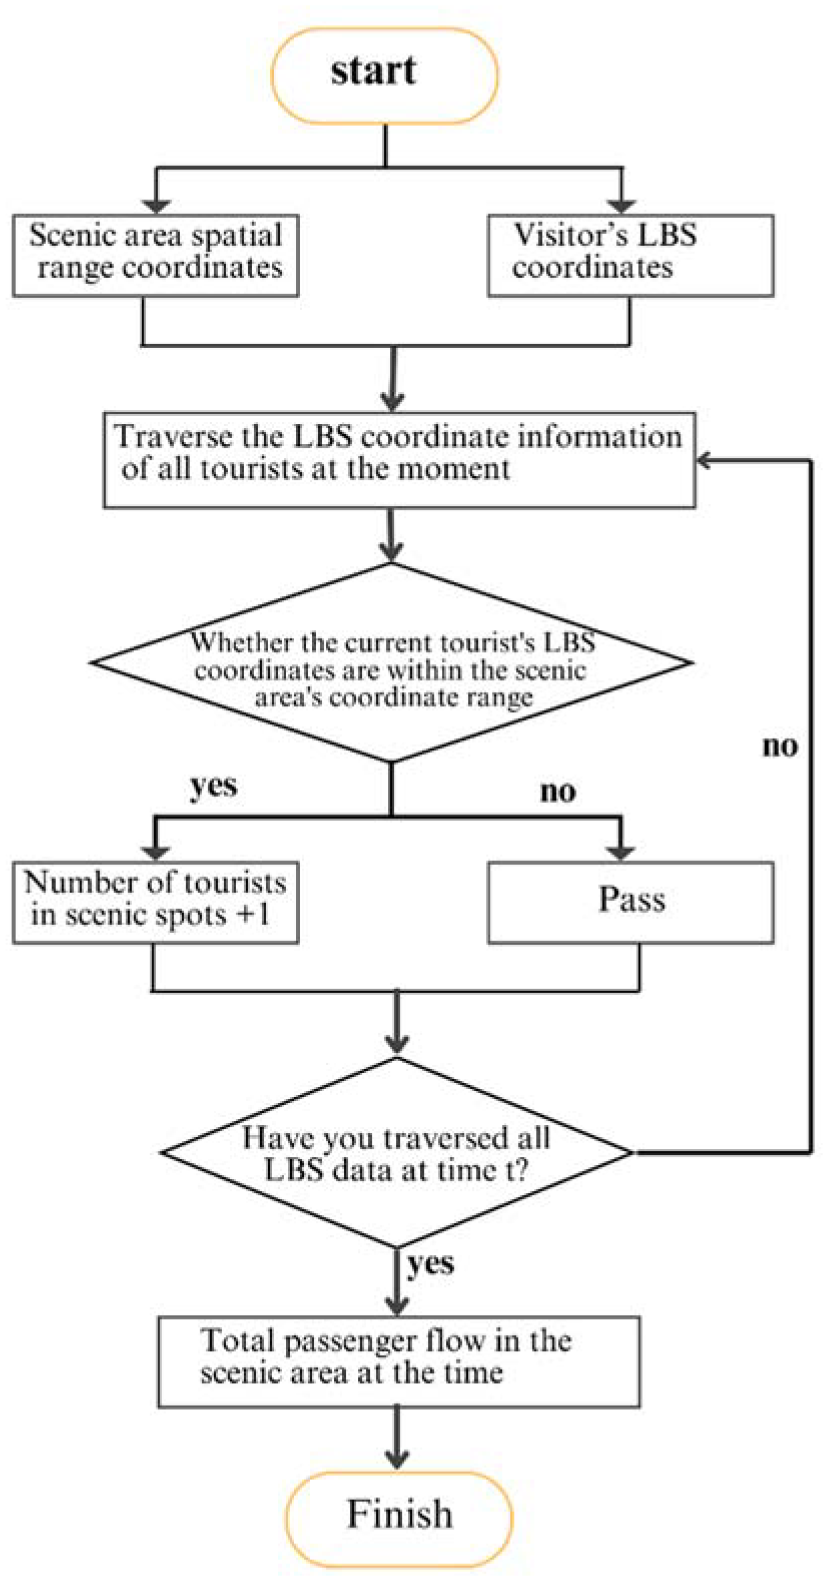
Conversion process of LBS data into structured time-series data.
This transformation is achieved by assessing whether a user’s coordinates fall within the specified spatial boundaries at each time interval. Aggregating the number of individuals present within the defined area produces a high-resolution dataset suitable for predictive modeling. Such transformations ensure that raw LBS data is refined to meet the requirements of advanced deep learning algorithms, such as GRU and LSTM models, which perform optimally when provided with structured, high-frequency time-series input. By systematically addressing both temporal and spatial constraints, this methodology bridges the gap between large-scale data collection and accurate forecasting, enabling reliable and precise visitor flow predictions for tourism management.
Proposed Model
System Description
The BiGRU-Attn model, proposed in this study, is a deep neural network designed specifically for high-frequency passenger flow prediction. It combines the strengths of Gated Recurrent Units (GRUs) and Bidirectional Recurrent Neural Networks (BiRNNs) to create a robust architecture capable of processing complex, sequential, high-frequency data. GRUs are particularly effective in handling long sequences, as they mitigate the vanishing gradient problem by introducing reset and update gates, allowing the model to focus on relevant time steps (Li et al., 2019). Meanwhile, BiRNNs enhance this capability by analyzing temporal data in both forward and backward directions, enabling the model to capture dependencies from both past and future data points simultaneously (Lu et al., 2020). The combination of these techniques makes the BiGRU-Attn model highly effective in addressing the challenges of passenger flow prediction in dynamic environments.
The BiGRU-Attn model operates as a many-to-one framework, meaning it takes multiple input features and generates a single output sequence. In this case, the output represents the predicted passenger flow over time. The input features include two main components: historical passenger flow data and related variable sequences. Historical data forms the backbone of the prediction, providing a time-series foundation of past patterns. Related variables include external factors such as weather conditions (e.g., temperature, rainfall) and holiday schedules, both of which have been shown to significantly affect passenger flow patterns (Cho et al., 2022; Gössling et al., 2012). Research indicates that integrating such external variables into the input features can substantially improve the accuracy of predictions. However, since the factors influencing passenger flow vary across different types of tourist attractions, the input features must be tailored to suit the specific characteristics and environmental context of the target location. For instance, urban destinations may see fluctuations based on workdays versus weekends, while natural attractions are more sensitive to weather and seasonal changes.
The model’s architecture consists of five neural network layers, including four bidirectional recurrent layers and a fully connected neural network layer Figure 3. The recurrent layers process sequential data in both directions, extracting temporal features and capturing intricate patterns within the data. The final fully connected layer aggregates the processed information and generates the predicted passenger flow sequence. To prevent overfitting, Dropout regularization is employed after each recurrent layer. Dropout works by randomly deactivating a fraction of neurons during training, reducing the network’s reliance on specific features and improving generalization to unseen data (Chen et al., 2015). This is particularly important in high-dimensional data scenarios, where overfitting can significantly degrade model performance.

Over all deep neural network (BiGRU-Attn) for high-frequency passenger flow prediction.
The BiGRU-Attn model was trained using high-frequency hourly passenger flow data collected from Fuzhou National Forest Park, as detailed in Table 1. The training process was conducted over 100 epochs using the Adam optimizer, with a learning rate of 0.001 and a batch size of 8. The dataset consisted of real-world Location-Based Service (LBS) data that captured visitor movements over several weeks, as referenced in (Kulshrestha et al., 2020; Worldweatheronline, 2022; Yang et al., 2020). To enhance temporal feature learning, an attention mechanism was applied after the final BiGRU layer, allowing the model to assign dynamic weights to the time-step outputs based on their contextual importance. This approach enabled the model to focus more effectively on critical time segments that influence tourist flow variations. Model performance was evaluated using four standard metrics: the coefficient of determination (R2), Root Mean Square Error (RMSE), Mean Absolute Error (MAE), and Mean Absolute Percentage Error (MAPE), as shown in Equations 8–11. Additionally, the Diebold-Mariano (DM) test was used to statistically assess the significance of prediction differences between models.
Hyperparameter Settings and Operating Environment.

Framework for Data-Driven Tourist Flow Prediction
The technical approach employed in this study, as illustrated in Figure 4, consists of four main stages: defining the prediction scope and frequency, preparing the data, constructing and applying the prediction model, and evaluating the model’s performance and predictive accuracy.

High-frequency tourist flow prediction framework.
The first stage, defining the prediction scope and time-frequency resolution, establishes the geographical area and temporal granularity required for forecasting based on the specific needs of the scenic spot. This ensures that the predictions are aligned with practical and operational requirements.
The second stage, data preparation, involves processing the high-frequency passenger flow data. The dataset is split into a training set for model optimization and a testing set for evaluating predictive accuracy. Data normalization is performed to address differences in scale across variables, ensuring consistency and improving the model’s ability to learn effectively.
The third stage, model construction and prediction, encompasses four key steps: developing the BiGRU-Attn deep learning model alongside baseline models for comparison, fine-tuning hyperparameters to optimize prediction accuracy, training the model with the prepared data, and generating predictions. Hyperparameter tuning is conducted iteratively, involving multiple rounds of training and evaluation, to achieve the best possible predictive performance.
The final stage, evaluation of predictive performance and model effectiveness, assesses the BiGRU-Attn model’s accuracy and compares its results with other deep learning models. This includes evaluation through fitting curves and error metrics such as R2, RMSE, MAE, and MAPE. Additionally, the Diebold-Mariano (DM) test is applied to statistically validate the model’s predictive superiority over baseline models, providing comprehensive evidence of its effectiveness in high-frequency passenger flow forecasting for scenic attractions.
Model Evaluation
This study uses three methods, namely fitting curve evaluation, error index test, and DM test, to evaluate the prediction effect and model performance of the deep learning model. The fitting curve evaluation evaluates the accuracy of the model prediction by drawing the model prediction curve and the actual passenger flow curve, and comparing the deviation of the prediction curve from the actual value curve. Its advantage is that it is convenient for prediction evaluation in different time periods. The better the fit between the prediction curve and the actual value curve, the better the prediction effect of the model. The error index evaluation uses R2, RMSE, MAE, and MAPE to evaluate the prediction effect of the model. Its mathematical expressions are shown in Equations 8 to 11.


where
The larger the evaluation value of the R2 indicator, the better the prediction effect; the smaller the evaluation values of the RMSE, MAE, and MAPE indicators, the better the prediction effect. In addition, this paper will also use the DM test method to compare whether the performance differences between different models are significant.
Results and Analysis
Data Sources and Data Preparation
The focus of this study is the Fuzhou National Forest Park in Fujian Province, China, a prominent outdoor scenic area renowned for its high-quality mountain and sea landscapes. Open to the public free of charge, the park experiences heavy visitor traffic throughout the year, often resulting in congestion that impacts visitor experience and raises safety concerns. Therefore, accurate high-frequency passenger flow predictions are critical for effective crowd management.
This study aims to provide hourly passenger flow predictions for the next 3 days (72 hrs), offering short-term insights for managing the park’s operations. These predictions enable timely adjustments to mitigate congestion and improve the visitor experience. The experiment serves two primary objectives:
To evaluate the predictive accuracy and performance of the BiGRU-Attn model in high-frequency passenger flow forecasting.
To compare the performance of the BiGRU-Attn model with other deep learning models, assessing whether bidirectional architectures outperform conventional networks under the same algorithms, and whether GRU-based models deliver superior results compared to other algorithms under identical conditions.
The dataset used in this study integrates information from three dimensions: historical passenger flow, weather, and holidays. The historical passenger flow data was collected using Tencent’s location big data platform, which provides high-resolution spatiotemporal information through regional heat maps. The weather data was sourced from Worldweatheronline, a platform offering high-frequency meteorological data. To make weather data compatible with the deep learning model, categorical weather types were transformed into binary dummy variables: mild weather conditions (e.g., sunny, cloudy, overcast) were assigned a value of 0, while extreme weather conditions (e.g., heavy or moderate rain) were assigned a value of 1. Holiday data was also encoded using dummy variables, where working days were assigned a value of 0, and holidays (including weekends and statutory holidays) were assigned a value of 1.
The combined input data for the model included normalized passenger flow, weather, and holiday data. Normalization was necessary to address the differences in magnitude and dimensions among these variables. The Min-Max Normalization method was employed, which scaled all data features to a uniform range of [0, 1]. This ensured that differences in data magnitude did not adversely affect model convergence or computational accuracy.
For model training and evaluation, the dataset covered a total duration of 33 days (792 hrs), from October 7, 2023, at 00:00 to November 8, 2023, at 23:00, resulting in a total of 2,232 samples across the three dimensions. The data was divided into two subsets:
Training Set: The first 30 days (720 hrs) were used for model training and parameter optimization.
Test Set: The last 3 days (72 hrs) were reserved for evaluating the prediction performance.
This study focused exclusively on temporal patterns derived from LBS data. Exogenous variables such as weather and holiday information were not included in the current model.
Hyperparameter Debugging of Prediction Model
To achieve optimal prediction accuracy and generalization, deep learning models require careful tuning of hyperparameters. In this study, hyperparameter selection involved multiple rounds of experimentation and evaluation, focusing on the model’s architecture, learning configuration, and regularization strategy. The finalized hyperparameter settings for the BiGRU-Attn model are provided in Table 1. The BiGRU-Attn model consists of five layers: four stacked bidirectional GRU layers and one fully connected output layer. The bidirectional structure enables the model to learn from both forward and backward temporal dependencies, enhancing its ability to capture short-term patterns in sequential data. The number of neurons in each layer—configured as 120, 72, 72, and 60—was determined experimentally to balance predictive accuracy with computational efficiency. Larger configurations introduced overfitting, while smaller sizes reduced sensitivity to complex flow variations. Each layer employs the ReLU activation function, which is widely used in deep learning for its computational efficiency and ability to address the vanishing gradient problem (Wielgosz et al., 2017). ReLU also promotes sparsity by deactivating negative neurons, which serves as a form of implicit regularization and contributes to faster convergence and better generalization.
To further mitigate overfitting, Dropout regularization is applied after each recurrent layer, with a rate of 0.1, meaning that 10% of the neurons are randomly deactivated during each training iteration. This technique helps prevent the model from becoming overly reliant on specific neurons and promotes robustness in predictions. The model was trained using the Adam optimizer, which is known for combining the advantages of AdaGrad and RMSProp to adapt learning rates for individual parameters and ensure stable convergence (Lai & Pan, 2019; Wielgosz et al., 2017; Zhao et al., 2021). After testing a range of learning rates, 0.001 was selected as the most effective for balancing convergence speed and accuracy. A batch size of 8 was used to allow efficient processing of high-frequency sequential data. The model was trained for 100 epochs, providing sufficient iterations for stable convergence without overfitting.
Model Validation
To validate the effectiveness of different deep learning algorithms for high-frequency passenger flow prediction in scenic spots, this study employed a comparative analysis of six models, including the primary model BiGRU-Attn and five baseline models. The BiGRU-Attn model combines bidirectional recurrent neural networks with the GRU algorithm, making it effective in capturing both forward and backward temporal dependencies in time-series data.
The baseline models include DBi-LSTM, DBi-RNN, D-GRU, D-LSTM, and D-RNN, enabling a systematic evaluation of the predictive performance of various recurrent neural network (RNN) structures and algorithms. Specifically, DBi-LSTM and DBi-RNN are bidirectional recurrent neural network models based on the widely used LSTM algorithm (Zhao et al., 2021) and the classic RNN algorithm, respectively. These models share the same set of network parameters as BiGRU-Attn, allowing for an objective comparison of their predictive capabilities. Additionally, three baseline models—D-GRU, D-LSTM, and D-RNN—were constructed using conventional recurrent neural network architectures. These models serve as counterparts to BiGRU-Attn, DBi-LSTM, and DBi-RNN, respectively, and are used to assess the differences in performance between bidirectional and conventional recurrent neural networks. This comparative approach helps to evaluate the impact of bidirectional architectures and the effectiveness of different algorithms (GRU, LSTM, and RNN) in high-frequency passenger flow prediction. The six models tested in this study are summarized in Table 2.
Six Deep Learning Models Used by This Experiment.

Figure 5 illustrates the passenger flow predictions over a 3-day period (72 hrs), with data collected and analyzed on an hourly basis. The prediction trends of all six deep learning models align well with the actual passenger flow patterns, showcasing their effectiveness in short-term forecasting for scenic spots. However, among the tested models, BiGRU-Attn and DBi-LSTM emerge as the most accurate, with their prediction curves closely matching the real data. This result indicates that these two models perform exceptionally well in capturing the fluctuations in visitor numbers. When comparing models built on similar neural algorithms, the bidirectional networks (BiGRU-Attn, DBi-LSTM, and DBi-RNN) outperform their conventional counterparts (D-GRU, D-LSTM, and D-RNN) in predicting visitor flow. This distinction is particularly evident during high-demand periods, where conventional networks tend to show noticeable deviations from actual values. Bidirectional models, particularly BiGRU-Attn and DBi-LSTM, demonstrate greater accuracy during these peak times, underlining their superior capability in identifying and responding to short-term variations in flow trends.

Validation of different deep learning models: (a) BiGRU-Atten, (b) DBi-LSTM, (c) DBi-RNN, (d) D-GRU, (e) D-LSTM, (f) D-RNN.
Final Model Comparison
The final model comparison evaluates the performance of various deep learning models for high-frequency passenger flow prediction. While fitting curves and error indices such as R2, RMSE, MAE, and MAPE provide useful insights, they do not indicate whether the differences in model performance are statistically significant. To address this Diebold-Mariano (DM) test used to evaluates the statistical significance of forecast error differences between models. The DM test results are summarized in the tables below. A negative DM value indicates that Model 1 outperforms Model 2, while a positive value suggests the opposite. The significance of these differences is shown by the p-values, with asterisks (*) representing significance at the 10% level and (**) at the 5% level.
To evaluate the predictive robustness of the BiGRU-Attn model, we conducted a Diebold-Mariano (DM) test comparing its performance against five baseline models across both the full dataset and specific temporal subsets (weekdays and weekends). As shown in Table 3, the BiGRU-Attn model consistently outperforms most baseline models. For the full dataset, it achieved statistically significant improvements over D-GRU (DM = −1.671, p = .009), D-LSTM (DM = −2.008, p = .005), and D-RNN (DM = −1.719, p = .090). The difference with DBi-RNN was also marginally significant (DM = −1.682, p = .097), while its performance compared to DBi-LSTM was not statistically significant (DM = −1.499, p = .138), suggesting the latter remains a strong competitor. In the weekday subset, BiGRU-Attn retained its edge over D-GRU (DM = −1.552, p = .012), while showing no significant difference with DBi-LSTM (DM = −1.267, p = .188). However, its performance during weekends was notably superior, particularly against D-LSTM (DM = −2.135, p = .004) and DBi-LSTM (DM = −1.791, p = .083), highlighting the model’s strength in capturing more volatile, peak-time visitor patterns. These results demonstrate not only the overall superiority of the BiGRU-Attn model but also its robustness across varying temporal contexts relevant to real-world tourism management.
Performance Evaluation of BiGRU-Attn Model with Robustness Across Weekday/Weekend.

To further assess the robustness and generalizability of bidirectional architectures, Table 4 presents a comparative analysis between bidirectional and conventional models using the same underlying algorithms (GRU, LSTM, and RNN), tested across the full dataset as well as weekday and weekend subsets. Over the full dataset, BiGRU-Attn outperformed D-GRU with a DM value of −1.671 (p = .099) and an R2 improvement of +.021, while DBi-LSTM showed a larger R2 gain of +.059 over D-LSTM with a DM value of −1.772 (p = .081). No significant difference was observed between DBi-RNN and D-RNN (DM = −1.298, p = .198), indicating the limited benefit of bidirectional modeling with basic RNNs. When the analysis was segmented by day type, bidirectional models demonstrated stronger advantages. On weekdays, BiGRU-Attn surpassed D-GRU with an R2 improvement of +.018 and a DM value of −1.552 (p = .012), while DBi-LSTM achieved a +.055 R2 gain over D-LSTM (p = .076). On weekends, the performance gap widened further: BiGRU-Attn exceeded D-GRU with a +.028 R2 difference and DM value of −1.732 (p = .041), and DBi-LSTM achieved a +.062 R2 gain over D-LSTM with a DM value of −1.881 (p = .038).
Performance Comparison Between Bidirectional and Conventional Networks Across Weekday/Weekend Subsets.

To assess the relative strengths of conventional recurrent network architectures, Table 5 presents a comparative analysis of D-GRU, D-LSTM, and D-RNN using the Diebold-Mariano (DM) test. The results consistently favor D-GRU across all subsets. For the full dataset, D-GRU significantly outperformed D-LSTM (DM = −1.709, p = .090) and D-RNN (DM = −1.738, p = .086), with R2 improvements of +.058 and +.095, respectively. When segmented by day type, the robustness of D-GRU remained evident. On weekdays, D-GRU maintained its advantage over D-LSTM (DM = −1.641, p = .074, R2 diff = +.054) and D-RNN (DM = −1.702, p = .062, R2 diff = +.086). The difference became more pronounced on weekends, where D-GRU outperformed D-LSTM with an R2 gain of +.067 (DM = −1.823, p = .041) and D-RNN with the highest R2 improvement of +.104 (DM = −1.892, p = .036). These findings suggest that among conventional models, D-GRU offers the most reliable and accurate predictions, particularly in more dynamic and high-traffic conditions such as weekends, where precision is critical for operational decision-making.
Performance Evaluation of Conventional Network Models with Robustness Analysis.

Discussion
This study introduced the BiGRU-Attn model, which integrates Bidirectional Recurrent Neural Networks (BiRNN), Gated Recurrent Units (GRU), and Attention Mechanisms to improve the accuracy of high-frequency tourist flow prediction. Experimental results confirm that the BiGRU-Attn model outperformed all five baseline models across key metrics, achieving an R2 of .948, RMSE of 218.986, MAE of 131.914, and MAPE of 0.340 in 72-hr predictions. During peak periods (12:00–18:00), the model maintained strong performance with an R2 of .918, demonstrating its reliability in high-demand scenarios.
While the statistical significance of model performance is supported by the Diebold-Mariano (DM) test in Tables 3 and 4, it is also important to consider the effect sizes of these differences. For example, the R2 difference between BiGRU-Attn (0.948) and DBi-LSTM (0.928) is approximately .02. Though seemingly small, this equates to a 2% increase in the proportion of variance in tourist flow that the model can explain. In high-frequency and peak-hour scenarios, such an improvement allows for more precise predictions of sudden visitor surges. This level of enhancement can significantly improve real-time operational decisions, such as staffing levels, facility readiness, and crowd flow control. Similarly, the RMSE reduction of over 40 units between BiGRU-Attn (218.986) and DBi-LSTM (259.703) represents fewer absolute prediction errors per hour, which can be critical in high-traffic environments where slight inaccuracies can lead to overcrowding or underutilization of resources.
Bidirectional recurrent neural networks have gained traction in recent studies. For example, Kulshrestha et al. (2020) found that BiLSTM models surpassed conventional LSTM in forecasting accuracy. These results emphasize the advantage of bidirectional structures and attention mechanisms in capturing forward and backward temporal dependencies, which are especially important for high-frequency, short-term predictions.
This study contributes to the field in several important ways:
Introducing BiGRU-Attn: A novel model integrating attention mechanisms and bidirectional GRUs with enhanced performance over BiLSTM models.
Comprehensive Model Comparisons: A systematic comparison was conducted between bidirectional network models (BiGRU-Attn, DBi-LSTM, and DBi-RNN) and their conventional counterparts (D-GRU, D-LSTM, and D-RNN).
Spatiotemporal Data Application: The use of LBS data, a form of spatiotemporal big data, enables hourly-level prediction with high temporal granularity—significantly improving upon the low-resolution datasets typically used in earlier studies (Worldweatheronline, 2022).
Beyond its application to sport tourism, the proposed BiGRU-Attn framework can be readily adapted to other tourism scenarios, including cultural heritage sites, urban destinations, and seasonal attractions.
While the BiGRU-Attn model demonstrates robust performance, a few considerations should be acknowledged to support future research and application. First, although the model was validated using data from Fuzhou National Forest Park, the framework is designed to be adaptable and can be retrained with data from other destinations, enhancing its generalizability. Second, as with most LBS-based studies, the data may reflect usage patterns of mobile device users; however, the wide adoption of smartphones helps mitigate this bias. Finally, while the model’s bidirectional and attention-based structure adds some computational complexity, its performance gains justify the cost in many real-time forecasting scenarios, particularly when applied to high-impact periods such as holidays or weekends.
Conclusion
This study aimed to develop a comprehensive method for the HFP of passenger flow in tourist attractions by combining Location-Based Services (LBS) data with advanced deep learning models. The proposed approach focuses on converting raw LBS data into high-frequency time-series data, allowing the prediction of passenger flow based on defined spatial ranges and temporal resolutions. Using the BiGRU-Attn model as the core predictive framework, this study demonstrated the effectiveness of this methodology through a case study of Fuzhou National Forest Park. The key findings are as follows:
Superior Predictive Performance: The BiGRU-Attn model achieved the best overall performance compared to five baseline deep learning models, with an R2 of .948, RMSE of 218.986, MAE of 131.914, and MAPE of 0.340 in 72-hr forecasting. During peak hours, it maintained an R2 above .9, confirming its robustness in high-demand scenarios.
Advantage of Bidirectional Architectures: Models using bidirectional structures—BiGRU-Attn and DBi-LSTM—consistently outperformed their conventional counterparts, demonstrating a better capacity to capture forward and backward temporal dependencies.
Efficiency of GRU Algorithm: Among GRU, LSTM, and RNN models, GRU-based architectures proved to be more effective and efficient for HFP, offering a favorable balance between accuracy and computational performance.
Enhanced Temporal Resolution with LBS Data: Leveraging LBS data allowed for hourly-level forecasting, significantly surpassing the coarse temporal resolution of traditional datasets. The framework also supports customization in spatial boundaries and prediction intervals, enhancing adaptability to real-world scenarios.
To further enhance the model’s applicability and resilience, future research could focus on the integration of additional data sources, such as economic indicators, demographic profiles, and real-time event data, to better capture external influences on tourist behavior. Testing the model across a wider range of tourism contexts—such as amusement parks, cultural heritage sites, urban attractions, and seasonal destinations—would help evaluate its generalizability and adaptability. Additionally, exploring hybrid deep learning architectures and more advanced attention mechanisms may enhance predictive accuracy, especially under complex, multi-factor conditions.
Footnotes
Ethical Considerations
There are no human participants in this article and informed consent is not required
Consent to Participate
Informed consent was obtained from all the participants.
Author Contributions
Both authors have accepted responsibility for the entire content of this manuscript and approved its submission.
Funding
The authors disclosed receipt of the following financial support for the research, authorship, and/or publication of this article: This work was supported by Department of Basic Teaching and Research, Yango University.
Declaration of Conflicting Interests
The authors declared no potential conflicts of interest with respect to the research, authorship, and/or publication of this article.
Data Availability Statement
The data used to support the research results are available from the corresponding author upon request.