
Abstract
This paper aims to develop the E-Sports Consumption Behaviour Assessment Scale (E-CBAs) to assess consumption trends among e-sports consumers, addressing the economic and social dimensions of the digital gaming industry. With the rapid growth of digital games and the rising popularity of e-sports, the E-CBAs was developed to capture three consumption dimensions: hedonic, utilitarian, and luxury. Qualitative data were gathered through in-depth interviews with 12 professional e-sports players, while quantitative data were collected from 314 e-sports players using the newly developed E-CBAs. The findings reveal that digital games strengthen social bonds and enhance problem-solving and strategic thinking skills. Economically, the in-game spending of e-sports players significantly contributes to industry growth. This paper provides a comprehensive evaluation to support strategic decision-making in the digital gaming sector, highlighting the E-CBAs as a valuable assessment instrument for future research and applications.
Introduction
The rapid acceleration of industrial and technological advancements, alongside global crises, has led to a significant digital shift in consumer behaviour (Birkner, 2020; Castells, 2010). This transformation has compelled industries to adopt sustainable and digital solutions (Cohen & Kietzmann, 2014; Veugelers, 2017). The sports industry has similarly embraced digitalization, with digital platforms reshaping consumption habits and reaching large audiences (Hallmann & Giel, 2018; Newzoo, 2020). Within this context, e-sports has emerged as a prominent domain attracting a vast consumer base and establishing itself as both a sport and a key economic driver (Hamari & Sjöblom, 2017; Jenny et al., 2017).
Digital games, available on computers, consoles, and mobile devices, offer solo and multiplayer experiences, supporting individual and social interaction within competitive and cooperative contexts (Guay-Bélanger, 2022; Hamari & Sjöblom, 2017; McGonigal, 2011; Ryan et al., 2006; Salen & Zimmerman, 2004; Taylor, 2012). They engage diverse age groups and, by immersing players in rule-based environments, have been acknowledged as a new sport category (Garris et al., 2002; O. Gül et al., 2024).
Beyond entertainment, the digital gaming industry contributes to multiple sectors such as education, health, and defence. Educational games enhance learning motivation (Gee, 2003), while therapeutic applications support rehabilitation (M. J. Campbell et al., 2018; Primack et al., 2012). In defence, games are used for training and simulations (Michael & Chen, 2005). This cross-sector integration highlights the industry’s growing economic and societal value (Funk et al., 2018; O. Gül et al., 2024).
Economically, the industry extends beyond game sales, encompassing in-game purchases, e-sports tournaments, game development, and publishing (Newzoo, 2020). Microtransactions form a significant revenue source (Lehdonvirta, 2009), and e-sports tournaments attract massive financial investment through prize pools and sponsorships (Scholz, 2019). Streaming on platforms like Twitch and YouTube further expands revenue (Sjöblom & Hamari, 2017). The global market is projected to exceed $200 billion, driven especially by mobile gaming and widespread internet access (Niko Partners, 2022; Newzoo, 2023a; Statista, 2023; SuperData Research, 2020).
E-sports generates income from advertising, sponsorship, ticket sales, and media rights, while player professionalization amplifies its economic scope (Seo, 2013; Hamari & Sjöblom, 2017). Socially, digital games enable intercultural interaction and global community-building through shared gaming experiences (Cole & Griffiths, 2007; Steinkuehler & Duncan, 2008; Kowert et al., 2014; Trepte et al., 2012; Saldanha et al., 2023; Tezcan & Ayhan, 2023;). This fosters cultural awareness and connection (Jansz & Martens, 2005; Consalvo, 2009).
Research on digital game culture reveals that consumption behaviour intertwines with social interaction and identity construction (Consalvo, 2021; Shaw, 2020). Games are platforms for identity formation and the accumulation of cultural capital through in-game purchases and virtual status (Nardi, 2010; Pearce, 2022; Taylor, 2018). However, the industry’s lack of regulation—especially in regions like China—forces many e-sports players into early retirement, prompting them to shift into coaching or content creation roles (Zhao et al., 2024).
Psychologically, digital games present both challenges and benefits. While concerns include addiction, aggression, and social isolation (Anderson & Bushman, 2001; Gentile et al., 2011; Kuss & Griffiths, 2012; Lemmens et al., 2011a, 2011b), benefits include improved problem-solving, strategic thinking, and teamwork (Adachi & Willoughby, 2013; Connolly et al., 2012; Gee, 2003; Green & Bavelier, 2012). Games also enhance cognitive and social skills through scenario-based play and collaboration (Prensky, 2005; Voulgari et al., 2014).
Understanding the consumption and behavioural tendencies of individuals engaged in the digital sports ecosystem, particularly as e-sports consumers, provides valuable insights that can support the ongoing growth and development of the industry. Previous studies have highlighted that digital game users are influenced by a combination of hedonic enjoyment, social interaction, and achievement motivations (Hamari & Keronen, 2017; Hilvert-Bruce et al., 2018; Lee & Schoenstedt, 2011). These motivations often shape in-game consumption behaviours and broader user experiences. By identifying and categorizing such behavioural patterns, researchers and practitioners alike can contribute to more effective strategies in areas such as marketing, user segmentation, and game design (Gibson et al., 2023; Mäntymäki & Salo, 2015). Within this context, the development of a scale specifically tailored to assess e-sports consumption behaviours—such as the E-CBAS—may offer a useful tool for capturing these dynamics more precisely. Moreover, such a scale can help address a current gap in the literature by providing a structured framework for both academic research and industry applications.
Literature Review
Consumption is a fundamental component of both economic systems and social life, extending beyond basic needs to include identity formation and social belonging (Baudrillard, 1998; Bauman, 2001; C. Campbell, 2013; Featherstone, 2007). It not only fulfils biological requirements but also enables social interaction and skill development (Cook & Ryan, 2015; Migone, 2004; Slater, 2013). Within this framework, all participants in the consumption process are considered consumers, whose behaviours are influenced by both physiological and social factors (Jisana, 2014).
In the context of e-sports, consumption takes on new dimensions. According to Baudrillard’s “consumer society” theory, individuals express their identities through consumption, which in e-sports is evident in in-game purchases and rare items that denote social status (Baudrillard, 1998). Players often engage in conspicuous consumption to elevate their perceived social class (Abbasi et al., 2021), aligning with Veblen’s theory of prestige-driven behaviour (Hamari & Sjöblom, 2017).
E-sports also strengthens social identity and community belonging. Players, especially those with limited offline networks, find meaningful interpersonal connections in online communities (Fox & Tang, 2017; Kaye, 2019). These dynamic shapes both virtual and real-life identities.
Recent research underscores that young players increasingly seek social recognition and identity formation through consumption practices within e-sports environments (Johnson & Woodcock, 2019; Seo, 2016). However, despite the growing academic interest in digital game consumption, there remains a notable gap in the literature: no psychometrically validated scale has been specifically developed to measure consumption tendencies unique to the e-sports context. While general frameworks categorize game-related consumption into hedonic (pleasure-driven), luxury (status-oriented), and utilitarian (function-based) dimensions (Granic et al., 2014; O. Gül et al., 2024; Hamari & Keronen, 2017; Holbrook & Hirschman, 1982; Scholz, 2019), these models have not been operationalized in tools tailored to the distinctive social and digital ecosystems of e-sports. Addressing this gap is critical for advancing both theoretical understanding and empirical analysis of consumer behaviour in competitive gaming cultures.
In recent years, the exponential growth of the gaming industry has led to the emergence of sophisticated monetization strategies, notably Battle Pass systems and subscription-based models, which have profoundly transformed the consumption behaviours of e-sports players. These mechanisms are no longer peripheral components but core elements of game design, directly influencing how players perceive value, progress, and social status within gaming environments (Joseph, 2021).
The Battle Pass system, typically operating on a seasonal basis, offers players a tiered progression mechanism with exclusive rewards unlocked through gameplay or monetary purchase. This system creates a hybrid of merit-based and pay-to-progress models, which researchers argue induces psychological engagement through FOMO (fear of missing out), limited-time exclusivity, and prestige signalling (Joseph, 2021). It blurs the line between skill-based progression and financial expenditure, leading to what Joseph (2021) terms “Battle Pass capitalism” wherein consumerism is intricately embedded within the reward logic of play. In contrast, subscription models—such as Xbox Game Pass, PlayStation Plus, and Apple Arcade—offer broader content access over a fixed period, thus encouraging habitual gaming and perceived utility rather than sporadic high-stake spending. These models have gained popularity particularly among younger gamers and parents due to their budget predictability and perceived fairness (Newzoo, 2023b). While Battle Pass systems tend to appeal to players with competitive or collector mentalities, subscription services are often favoured by those who value variety, exploration, and content diversity (Chou et al., 2023).
Beyond the structure of monetization models, researchers have increasingly highlighted the importance of platform-based consumption patterns. Mobile games, which often emphasize quick access, touch-based controls, and free-to-play mechanics, typically rely on microtransactions and cosmetic customization to drive revenue. This approach aligns with the hedonic consumption model, where players derive pleasure from personalization and short-term gratification (Tech Wire Asia, 2023). In contrast, PC gamers—often engaged in competitive e-sports or deep narrative-based games—are more responsive to systems offering long-term progression, high performance expectations, and social hierarchy mechanisms (Chou et al., 2023). Furthermore, studies show that platform affordances shape not only game design but also consumer expectations. For instance, mobile gamers are more sensitive to interface simplicity and instant feedback, leading to design patterns that encourage impulsive purchases (Newzoo, 2023b). PC players, on the other hand, often seek depth, strategic engagement, and value accumulation, making them more receptive to structured monetization systems like Battle Passes (Chou et al., 2023). Given these dynamics, analysing consumption behaviour in e-sports requires a multidimensional perspective, encompassing hedonic, utilitarian, and symbolic motives, while also accounting for platform-specific affordances. The development and validation of a psychometric scale that captures these nuanced patterns fills a critical gap in current literature, offering researchers and game developers a robust tool to understand and predict in-game spending behaviours across diverse player groups.
This paper aims to develop a scale to assess consumer behaviours in e-sports while exploring the economic and social dimensions of the digital gaming industry, specifically in the context of e-sports. This research was conducted with e-sports professionals, that is, e-sports players and seeks to create a measurement tool to evaluate consumer behaviours in this field. A mixed-methods approach was used, incorporating both quantitative and qualitative data collection techniques to analyse e-sports consumers’ consumption behaviours. Quantitative analyses examine the economic contributions of the sector to the sports industry, as well as the spending habits and consumption patterns of e-sports users; qualitative analyses, on the other hand, aim to provide an in-depth understanding of user experiences and social impacts. The mixed-methods approach allows for a comprehensive examination of the multidimensional nature of the digital gaming industry (Creswell & Plano Clark, 2011). In conclusion, this paper, which addresses the economic and social dimensions, as well as consumption trends within the digital gaming industry, has developed a consumption behaviour scale that enhances understanding of current trends and potential future developments in the sector. Consequently, the findings of this paper—focusing on the economic contributions, social effects and individual consumption trends of digital games—are expected to contribute to the academic literature and inform sector stakeholders in strategic decision-making.
Method and Theoretical Framework
In this section, information about the model used in the paper, the study group, the process of developing the measurement tool and the analysis of the data are given.
Research Design
In this paper, a mixed-methods model was used to develop a valid and reliable measurement tool for assessing the consumption behaviours of individuals who play digital games in e-sports (electronic sports). Mixed-methods research involves integrating qualitative and quantitative data within a single study, where different data sources are combined and validated (Creswell, 2003; McMillan & Schumacher, 2006). The research plan is presented in Figure 1.
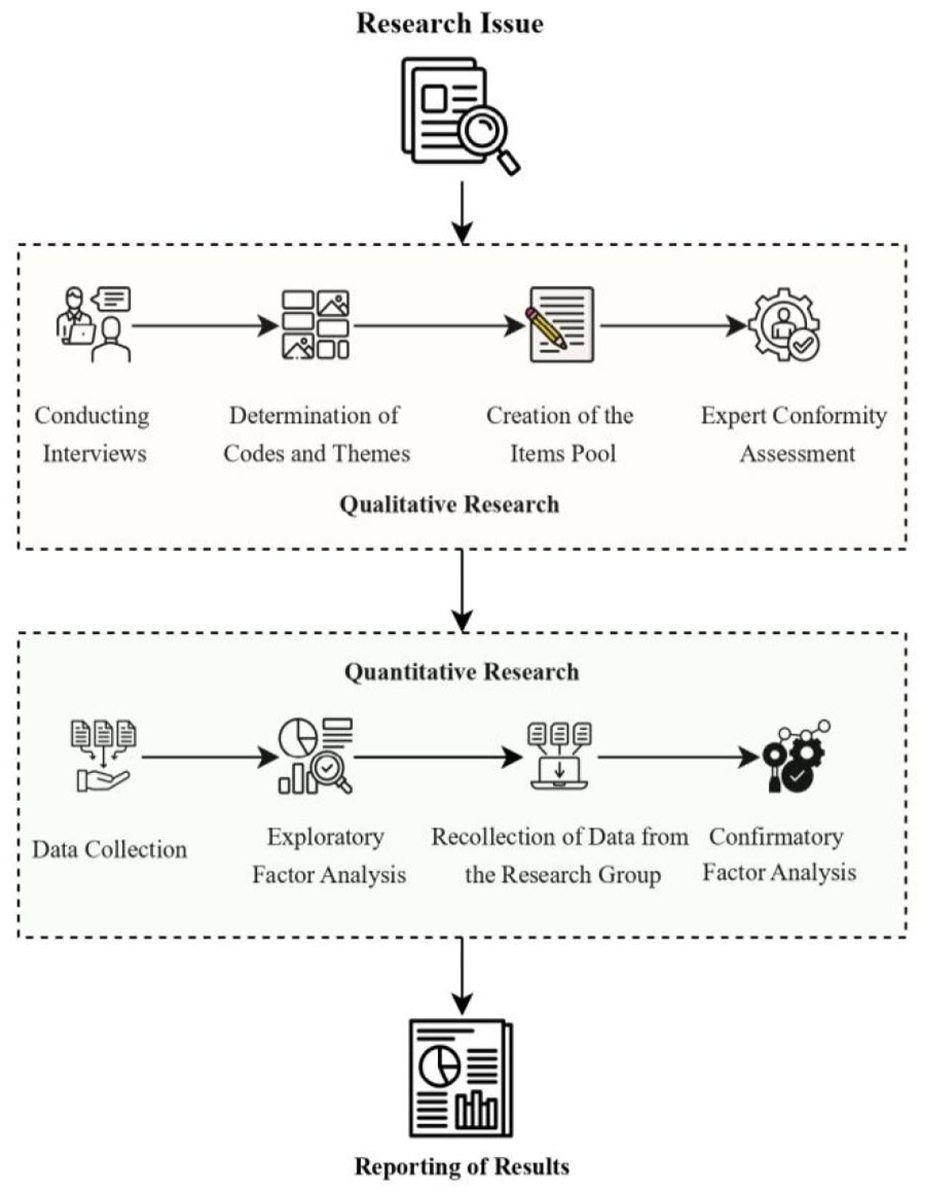
Research plan.
Research Group
This research was conducted with individuals practicing electronic sports across various disciplines in Türkiye. In this paper, criterion sampling was utilized as a purposive sampling method that facilitates an in-depth examination of the phenomenon under investigation, as articulated by Patton (2014). This approach involves the deliberate selection of participants or cases based on predefined criteria that are directly aligned with the objectives of the study. According to Yıldırım and Şimşek (2018), criterion sampling ensures that all selected cases meet specific standards deemed essential for addressing the research questions in a focused and meaningful way. Qualitative data were collected between August and December 2023 using the Zoom Webinar programme. Quantitative data were gathered via Google Forms between February and May 2024. The rationale for collecting data in this manner is the difficulty of physically accessing e-sports players. In the original format of the study, 201 participants were used. However, this participation was not deemed sufficient and was increased to 314 participants.
Qualitative Research Group
In the qualitative phase of the research, a group meeting was held with three professional e-sports players to discuss important aspects within the field. Based on insights from this meeting, the preparation of qualitative interview questions was completed and a semi-structured interview form was developed accordingly. Subsequently, qualitative interviews were conducted with 12 participants. In the following stage, codes and themes derived from the qualitative interviews were identified.
Quantitative Research Group
In this study, participants were selected from a variety of e-sports disciplines, provided that they had been actively involved in competitive gaming for at least one year in titles such as Valorant, League of Legends, Counter-Strike, PUBG, and FIFA. Based on this inclusion criterion, a total of 314 e-sports players participated in the research. Determining an appropriate sample size is critical in scale development and validation studies. As emphasized in foundational methodological works (Balcı, 2005; Büyüköztürk et al., 2012; Pett et al., 2003; Tavşancıl, 2014; Tezbaşaran, 2008), the participant-to-item ratio should be at least 5:1 to ensure sufficient statistical power. More recent guidelines, such as those proposed by Kline (2023), suggest that larger samples (ideally exceeding 300) enhance the robustness of factor analyses, particularly in studies involving complex or multidimensional constructs. Accordingly, the current sample size meets both classical and contemporary recommendations for validity and reliability testing. In this paper, for a preliminary scale of 20 items, a sample size of 314 participants—ten times the number of items—was determined. Based on these considerations, the number of participants is deemed sufficient for the statistical analyses conducted in this research.
Data Analysis for In-Depth Interviews
Since this research was conducted with mixed method, two different methods of analysis, qualitative and quantitative, were used.
Qualitative Data Analysis
Qualitative data were collected using a semi-structured interview form developed after preliminary interviews with three professional e-sports players (Appendix A). This form, containing eight questions, was applied to 12 professional players. The interviews were transcribed into Microsoft Word and analysed using a repeated reading technique, during which unclear or irrelevant statements were removed to enhance clarity. This process followed established qualitative research protocols (Braun & Clarke, 2006; Creswell & Poth, 2016; Miles et al., 2013; Patton, 2014). Cleaned data were then processed in NVivo 11, where codes and themes were generated. Based on these, a 20-item draft scale was developed. Fifteen field experts reviewed the scale, and each item’s content validity index (CVI) was calculated to ensure its relevance and clarity.
Quantitative Data Analysis
A 20-item draft scale, developed through qualitative analysis, was pilot-tested with 149 e-sports players for clarity. Expert feedback led to refinements, and the finalized scale was administered to 314 participants via convenience sampling (Patton, 2014; Yıldırım & Şimşek, 2018). Exploratory factor analysis (EFA) in SPSS 22 identified key sub-dimensions, with three items (M3, M7, M9: Table 9) removed for reliability reasons (Costello & Osborne, 2005; Fabrigar & Wegener, 2011; Hair et al., 2019). Confirmatory factor analysis (CFA) using AMOS 23 on 151 participants tested model fit and validated the factor structure through indices like CFI, TLI and RMSEA (Brown, 2015; Byrne, 2013; Kline, 2023).
Translation Procedure
To ensure the cross-linguistic validity and conceptual equivalence of the data collection instrument used in this study, the back-translation method was employed, as recommended by Brislin (1970). This approach is particularly useful in cross-cultural research, where direct translations may not adequately capture the nuanced meanings of items in the original language. Back-translation involves a multistep process: first, the original version of the instrument (in this case, Turkish) is translated into the target language (English) by a bilingual expert with domain-specific knowledge.
Next, a second bilingual expert, who is unfamiliar with the original version, independently translates the English version back into Turkish. This step is critical because it serves as a validity check for the accuracy and semantic integrity of the initial translation. The original Turkish version and the back-translated Turkish version are then systematically compared by a panel of researchers to identify any discrepancies, ambiguities, or cultural mismatches. Necessary revisions are made to the English version based on this comparison to ensure that each item reflects the intended meaning of the original.
This rigorous procedure, as emphasized by Brislin (1970), minimizes semantic bias and increases the likelihood that the translated version measures the same constructs as the original. As a result, although the original questionnaire was administered in Turkish during the data collection phase, only the English version is presented in this manuscript to align with the expectations of an international scholarly audience. The use of back-translation ensures that the English items accurately convey the conceptual content of the original instrument, thereby maintaining the validity and reliability of the findings across languages.
Findings
In this section, both the qualitative and quantitative findings of the research are presented. The qualitative findings are organized into themes derived from the data collected. For the quantitative findings, results from both exploratory factor analysis (EFA) and confirmatory factor analysis (CFA) of the measurement tool are provided.
Demographic Findings
Table 1 presents the types of games played by the participants and their e-sports backgrounds. Participants generally engage in more than one e-sports game, with the most frequently played games being CS GO, Valorant, League of Legends, and PUBG. The e-sports experience of the participants was calculated based on the total time spent playing these games. Some participants prefer both CS GO and Valorant; in this group, P1 has 10 years of e-sports experience P2 has 16 years and P3 has 6 years. Among participants who exclusively play CS GO, P8 has 7 years, P9 has 11 years and P10 has 13 years of experience. P7, who only plays Valorant, has 3 years of e-sports experience. For those who play League of Legends, P4 has 8 years, P11 has 9 years and P12 has 11 years of experience. Participants who play PUBG are categorized into two groups: P5 plays PUBG (PC), while P6 plays PUBG (Mobile), with 7 and 5 years of e-sports experience, respectively.
Demographic Characteristics and Player Profiles of Professional Electronic Sports (E-Sports) Players with Qualitative Interviews.

According to Table 2, the majority of participants were male (82.5%) and aged between 18 and 19 years (31.8%). In terms of the most played e-sport, Valorant was dominant, preferred by 58.3% of respondents. Most participants reported having over 6 years of e-sports playing experience (59.2%) and following e-sports for more than 6 years (49.4%). Daily e-sports playing time was mostly concentrated in the 2 to 3 hr range (38.2%), while daily tracking of e-sports content was primarily 1 hr or less (39.5%).
Demographic Distribution of E-sport Players Participating in the Quantitative Research.

Family and peer support were considered either significant or very significant by a large majority (89.5% and 80.9%, respectively). Regarding the impact of e-sports competition, 59.6% stated that it led them to engage in gaming “very much.” Although most participants did not hold an official e-sports license (86.0%), 23.2% reported participation in national tournaments, and 16.2% had received awards in the tournaments they entered.
Qualitative Findings
An analysis of Table 3 reveals three themes: “Hedonic/Pleasurable Consumption,” “Utilitarian Consumption” and “Pretentious/Luxury Consumption” based on e-sports players’ responses to the question, “What are your opinions on Electronic Sports (E-Sports) consumption?” Within the “Hedonic/Pleasurable Consumption” theme, codes such as “Visual Feast,” “Pleasure of Teamwork,” “Playing During Unhappy Times,” “Demonstrating Skills,” “Excitement of Competition” and “Rich Content Quality” were identified. Under the “Utilitarian Consumption” theme, codes such as “Benefit for Hand-Eye Coordination,” “Development of Mental Ability,” “Digital Socialization”, “Adaptation to Technology,” “Problem-Solving Ability,” “Visual Intelligence and Attention Skill,” “Quick Thinking and Decision-Making Ability,” and “Stress Management Skill” were identified. In the “Pretentious/Luxury Consumption” theme, codes including “Spending/Preferring Unique Items/Abilities/Camouflages,” “Spending Money Easily on Expensive Products,” “Owning Unique In-Game Equipment”, “Spending New In-Game Products/Equipment,” “High Cost of Game Access,” “Cost of Buying In-Game Abilities” and “Challenges in Playing Anywhere” were identified. Together, these codes provide detailed insights into the reasons why e-sports players engage in e-sports consumption, offering a more comprehensive understanding of their motivations. The thematic map resulting from these qualitative analyses is presented in Figure 2.
Professional Electronic Sports (E-Sports) Players’ Views on Electronic Sports Consumption.

P = participant.
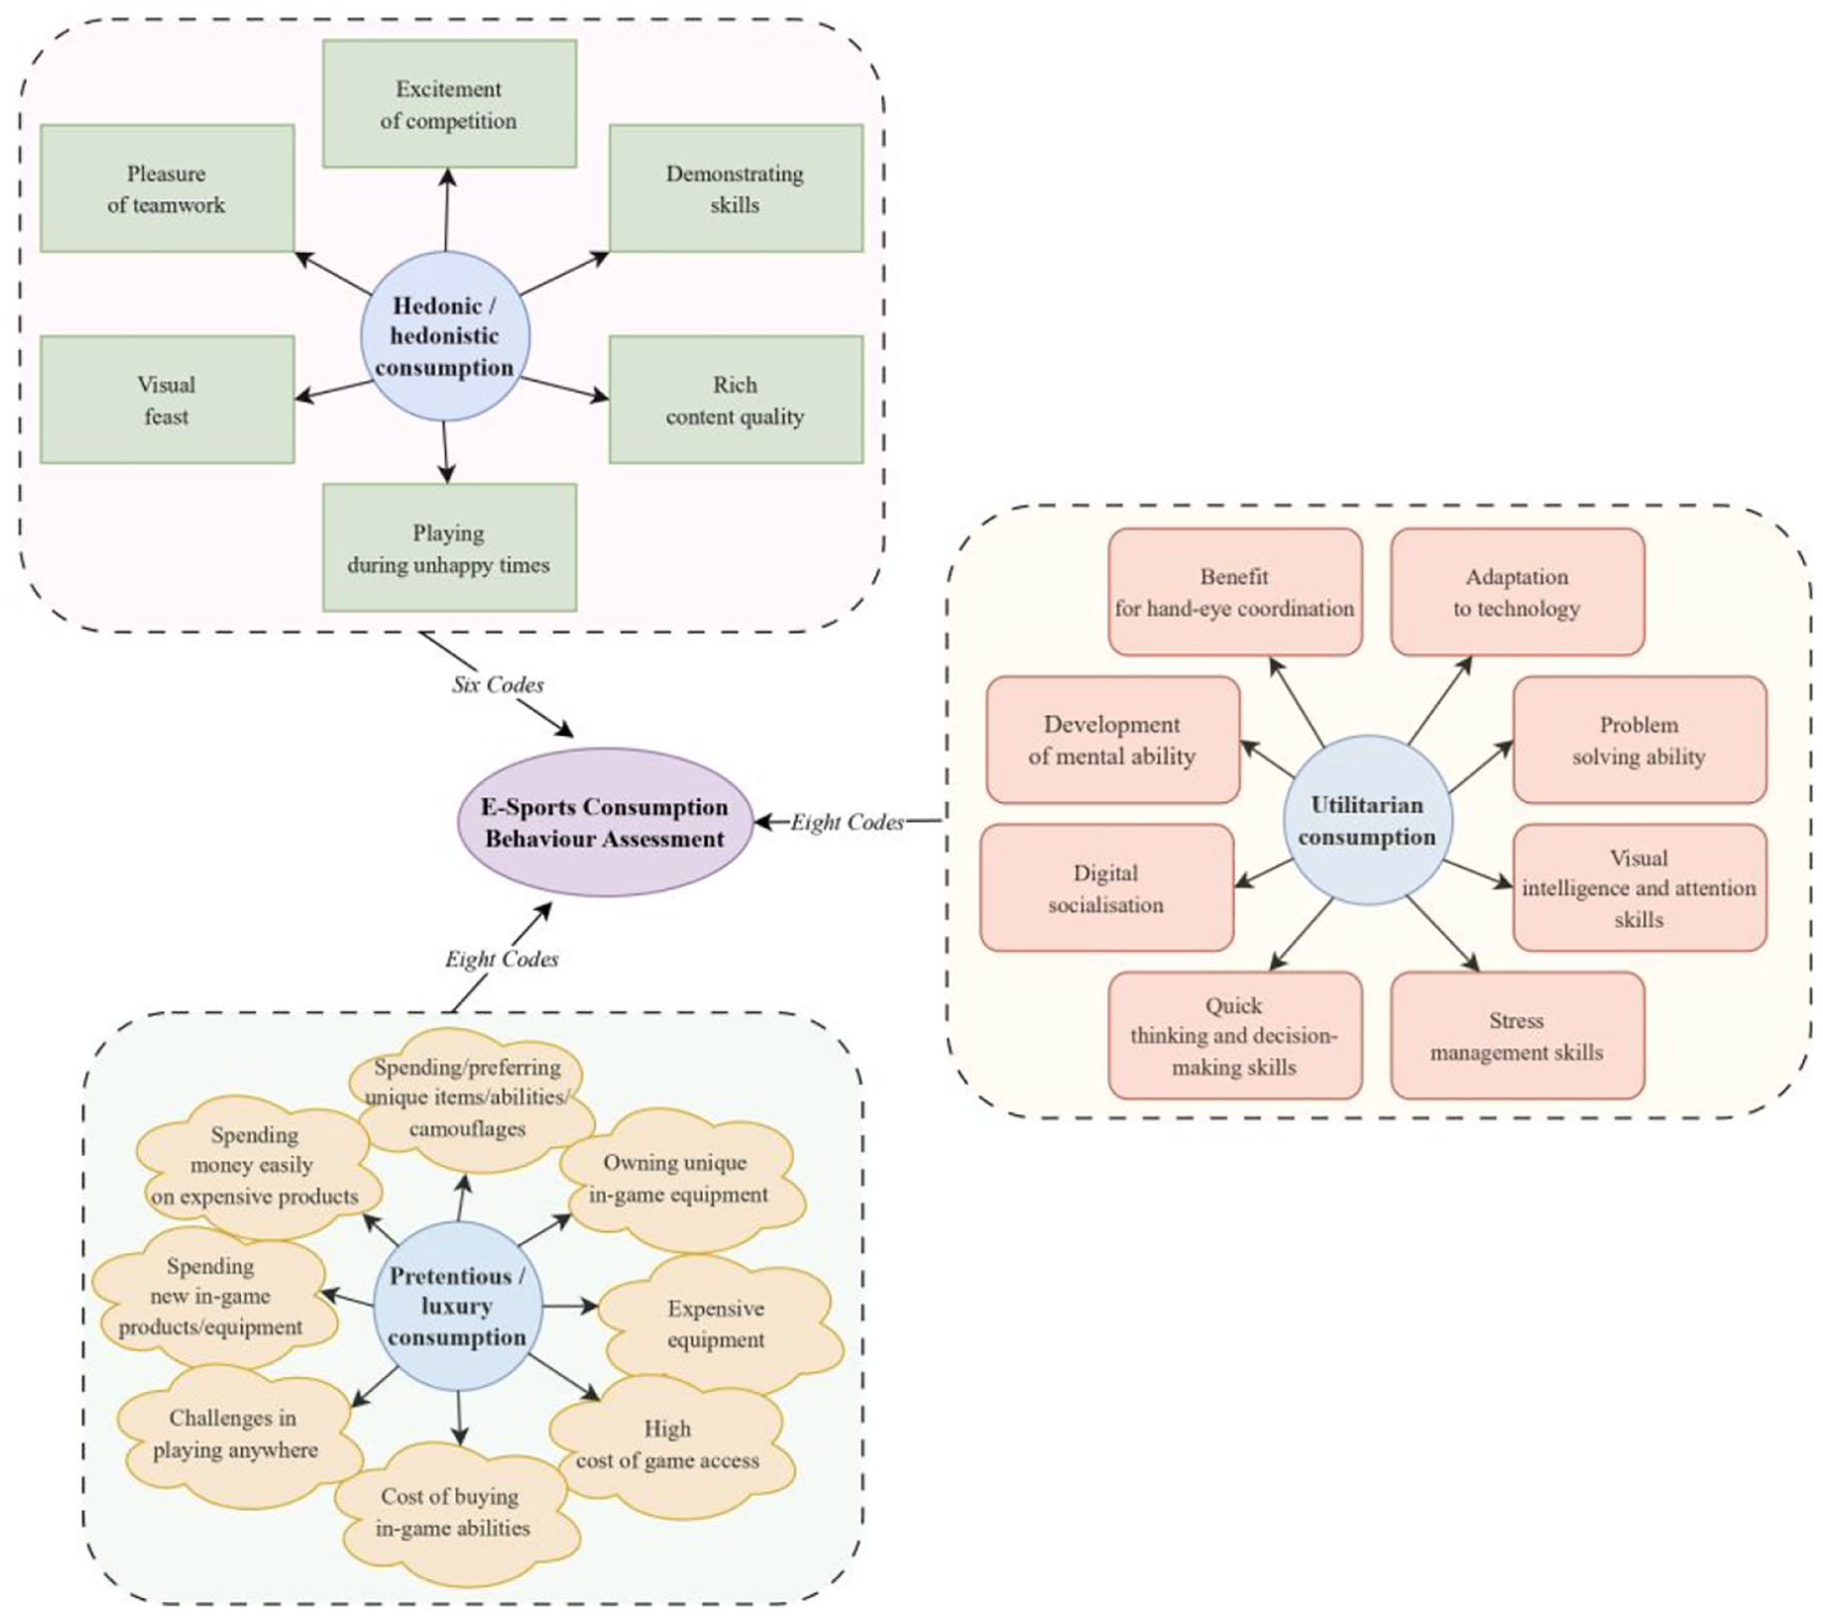
Theme and code map.
Hedonic/hedonistic consumption reflects participants’ desire for satisfaction through e-sports. This desire not only draws individuals to e-sports but also motivates their continued consumption of it. Such behaviours arise from participants’ pursuit of heightened sensory satisfaction. Some examples of the participant views of the codes under this theme are summarised and presented below.
P1: “I can say that the diversity of in-game animations is very enticing. In terms of e-sports content, we are continually presented with innovations. This certainly demonstrates the high quality of the visual experience in e-sports.” P7: “Looking back at my e-sports history, I have always played games in the FPS category. Specifically, in the latest game, VALORANT, I can say that the characters, maps, and unique visual effects and dynamic graphics associated with the abilities are remarkable.” P3: “Teamwork is crucial in e-sports. We remain in constant communication during the game. There are times when we spend hours together in tournaments. We even have our Game House, a place where we can enjoy training together. Here, we try to develop the strategies we will use in competitions. Situations like these not only provide entertainment but also help us establish social bonds with our teammates.” P9: “When I feel down, e-sports brings me joy. Because of this, I see e-sports as an escape route.” P2: “The skills I demonstrate in critical moments, especially in tournaments, increase my commitment to e-sports. For instance, during an official tournament (VALORANT), I was the only one left on my team. The game was at a pivotal point, and the opposing team had three players. I demonstrated superior skills and won that round for my team.” P6: “My team was falling behind in terms of score. We couldn’t afford weapons that round. At a critical moment, I managed to take down two opposing players with just a pistol. They were even flanking me from both sides, but with a quick reflex, I neutralized them both, leading my team to victory.” P3: “We were in an official tournament (Valorant). The opposing team was also performing very well. The match was neck-and-neck. I can say that this environment was incredibly exciting.” P11: “E-sports, especially MOBA games like League of Legends, feature a significant amount of visual effects in terms of content. This greatly enhances the game’s appeal. Additionally, the variety of in-game strategies provides a rich experience.”
Utilitarian consumption reflects participants’ practical approach to e-sports, where consumption is driven by a desire for specific benefits. This approach not only attracts individuals to e-sports but also encourages their ongoing engagement with it. Such behaviours primarily stem from participants’ desire to gain tangible benefits from e-sports. Some examples of the participant views of the codes under this theme are summarised and presented below.
P3: “Certainly, it does foster development. I have experienced its benefits many times in both gaming and physical sports. For instance, when I play as a goalkeeper in casual football games with my friends, I notice my quick reactions, which show how I’ve improved. Contrary to popular belief, e-sports offer real benefits in this regard.” P12: “In particularly challenging games, there are many moments where we have to make decisions. In such cases, we go through an intense preparation period before tournaments. The more we practice, the more we improve ourselves. E-sports significantly contribute to our cognitive development.” P7: “I also stream on TwitchTV, where I have many followers. During the day, I often meet my social needs through conversations on this platform, and sometimes I meet some of my friends in person.” P7: “In games, we inevitably have to keep up with technology. Upgrading our computer hardware with the latest technologies enhances our performance in gaming.” P8: “It is especially helpful in making decisions during critical situations.” P2: “In e-sports, we must perform visual scanning, which enhances our visual intelligence.” P9: “In major tournaments, we are often required to perform under pressure. In these situations, we need to act smartly, making quick and effective decisions.” P9: “We have to train a lot in-game, mainly to avoid issues with focus and stress during tournaments. This way, we can play effectively and efficiently by reducing our stress, which we manage by consistently playing games.” P4: “To reflect our personal style in games, especially in competitive ones, we purchase unique in-game items. As high-level players in e-sports, we believe that using standard items would make us ordinary.” P9: “Top players, particularly those who stream, can easily spend on in-game items for visual appeal. This is essential for providing their audience with memorable moments, which enhances their viewership. It also gives them opportunities to gain followers and receive donations.”
Pretentious / luxury consumption reflects participants’ approach to e-sports as a means of acquiring pretentious products. This approach not only attracts individuals to e-sports but also fuels their ongoing consumption. Such behaviours primarily stem from participants’ desire to obtain status-symbol products within the e-sports environment. Some examples of the participant views of the codes under this theme are summarised and presented below.
P11: “Due to my personal preferences, I purchase unique equipment that others do not usually choose or cannot afford. The reason is to assert my in-game status and to deepen my connection with the games.” P10: “Newly introduced equipment in games tends to be both visually impressive and initially challenging to compete with. For this reason, acquiring new equipment is important for skilled players in e-sports.” P8: “As an e-sports player, I prefer to be the first to buy expensive equipment in-game, not because of the cost, but because I want to stand out. As both a player and a streamer, I want to provide my followers with this experience.” P5: “Games greatly enhance our personal skills, offering us social and economic opportunities. Although the high cost of the game may limit access for other players, we are able to make these purchases easily and share the experience with those who cannot access it on various platforms.” P7: “Recently, there have been many innovations in e-sports. For example, a lot of in-game content has been introduced in Valorant. These innovations are often sold for a price, increasing the game’s cost. However, we must continuously buy these new items in the game to give players who cannot afford them the chance to experience them.” P12: “Due to my passion for e-sports, I have to take my gaming laptop with me while traveling. However, the internet isn’t always sufficient for gaming, which often puts me in a difficult situation.”
Quantitative Findings
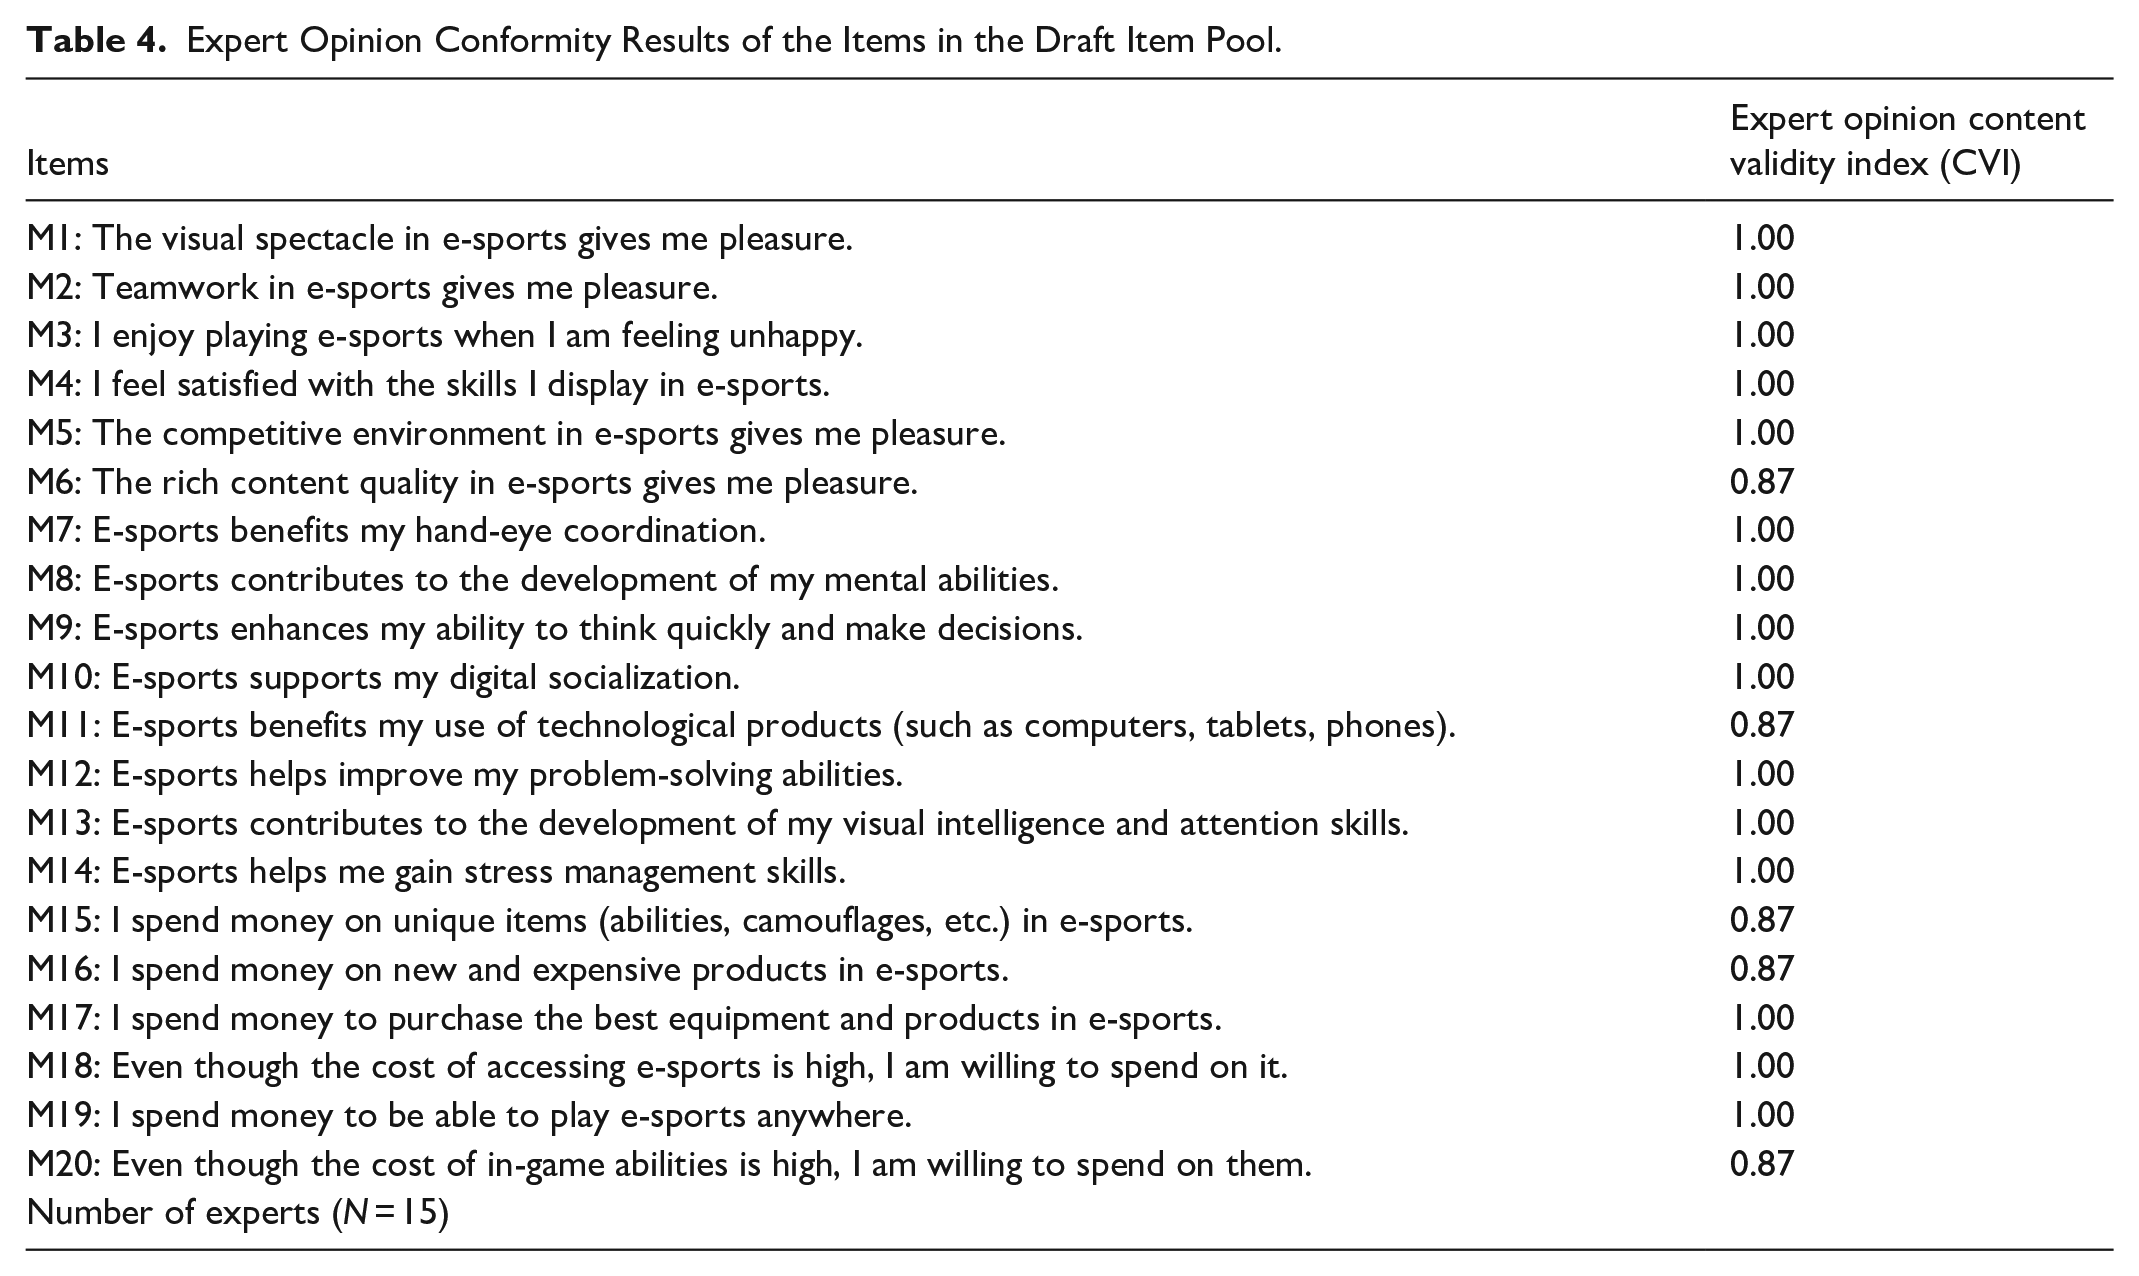
According to the item relevance assessment results of 15 experts in Table 4, CVI results of all items were found to be greater than 0.49. Thus, all items were decided to be included in the draft scale.
Expert Opinion Conformity Results of the Items in the Draft Item Pool.
Exploratory Factor Analysis Results
According to Akgül and Çevik (2003, p. 428), a Kaiser-Meyer-Olkin (KMO) coefficient above 0.90 indicates an excellent level of sampling adequacy for factor analysis. In this study, the KMO value was found to be 0.914, confirming the adequacy of the sample size. Additionally, Bartlett’s Test of Sphericity yielded a statistically significant result (p = .000 < .05), indicating that the data structure is appropriate for factor analysis. These findings demonstrate that the prerequisites for conducting exploratory factor analysis (EFA) were met, supporting the multivariate structure of the dataset (Table 5).
Examining the Suitability of the Data for Factor Analysis.

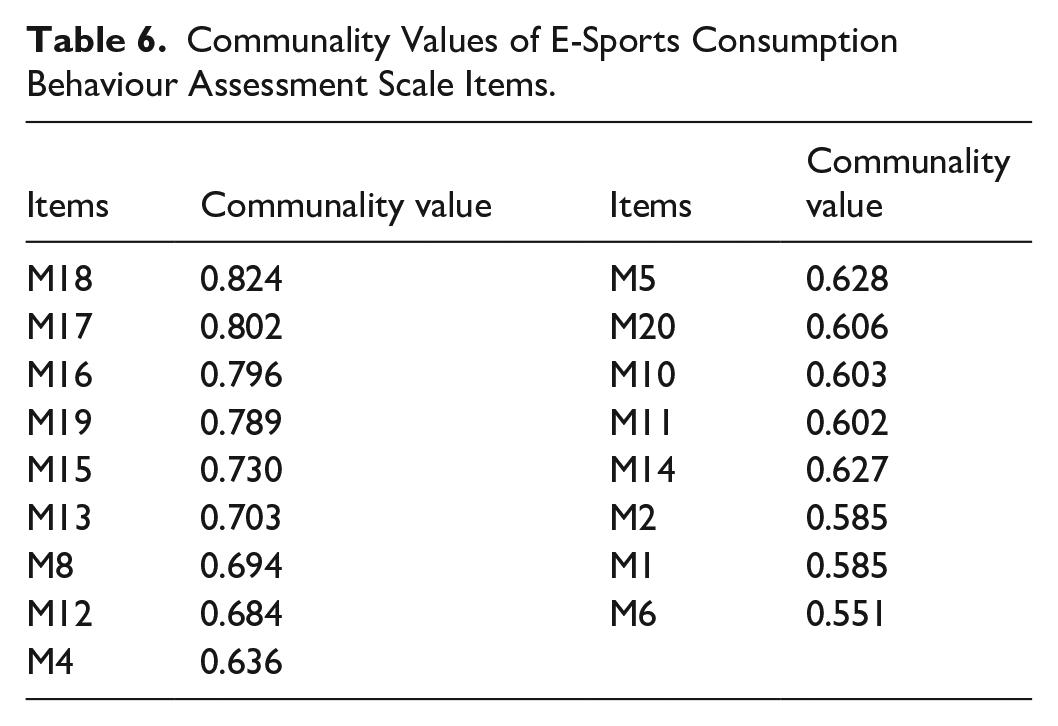
Co-occurrence is the variance value that a variable shares with other variables and it is desired to take values close to 1 or 1 for each variable (Nakip & Yaraş, 2013, p. 430). Communality values are given in Table 6.
Communality Values of E-Sports Consumption Behaviour Assessment Scale Items.
The 20 items in the scale were subjected to exploratory factor analysis (EFA) and a three-factor structure emerged. As a result of EFA, three items (M3, M7 and M9) were excluded because they did not show a good fit. The factors formed as a result of this analysis and the findings related to them are given in Table 7.
Total Explained Variance of the E-Sports Consumption Behaviour Assessment Scale.

As presented in Table 7, the results of the explanatory factor analysis indicate that three factors with eigenvalues greater than 1 were extracted. The first factor accounts for 46.040% of the total variance, followed by the second and third factors explaining 12.289% and 8.039%, respectively. Collectively, these three factors explain 66.369% of the total variance. Considering that the explained variance exceeds the commonly accepted threshold of 60%, the factor structure can be regarded as satisfactory (Hair et al., 2019).
To assess the potential threat of common method variance (CMV) in the E-Sports Consumption Behaviour Assessment Scale, Harman’s Single Factor Test was conducted. This technique serves as a preliminary diagnostic tool for identifying whether a single factor accounts for the majority of variance among observed variables—a condition which might indicate that the results are significantly biased due to the data collection method rather than the constructs being measured (Table 8).
Harman’s Single Factor Test of the E-Sports Consumption Behaviour Assessment Scale.

According to the test results, the initial eigenvalue of the first unrotated factor was 7.827, which accounts for 46.040% of the total variance. After extraction using the Principal Axis Factoring method, the same factor explained 42.895% of the variance. These values fall below the generally accepted threshold of 50%, which is frequently cited in the literature (Podsakoff et al., 2003) as the upper limit for acceptable CMV influence (Table 9).
Rotated Component Matrix for the Factor Structure of the E-Sports Consumption Behaviour Assessment Scale.

To conduct confirmatory factor analysis (CFA), it is essential that each latent construct is represented by at least three observed variables (indicators) to ensure model identification and validity (Brown, 2015). Accordingly, attention was paid to ensure that each factor retained at least three items. During exploratory factor analysis (EFA), item M3 was found to load significantly onto a unique factor by itself, failing to contribute to any of the predefined latent structures, which contradicts the assumption of factor parsimony (Fabrigar & Wegener, 2011). Moreover, items M7 and M9 exhibited cross-loadings on both the second and third factors, undermining discriminant validity and suggesting ambiguity in their measurement representation (Hair et al., 2019). In line with these methodological considerations, items M3, M7 and M9 were removed from the scale. After item refinement, the scale was reduced to 17 items and demonstrated satisfactory construct validity through subsequent analyses.
Naming of Factors
Since the primary purpose of conducting explanatory factor analysis is to reduce a large number of variables to a smaller set of factors, it is necessary to assign names to these factors. This naming process is based on the common characteristics of the variables within each factor (Nakip & Yaraş, 2013, p. 435). The items belonging to the three factors identified in the explanatory factor analysis, along with their appropriate labels, are presented in Table 10. It was found that the items developed using codes and themes from the qualitative findings were consistent with the quantitative results. Therefore, the factors were named in alignment with the qualitative findings. Details of the E-Sports Consumption Behaviour Assessment Scale are given in Appendix B.
Naming of Factors the E-Sports Consumption Behaviour Assessment Scale.
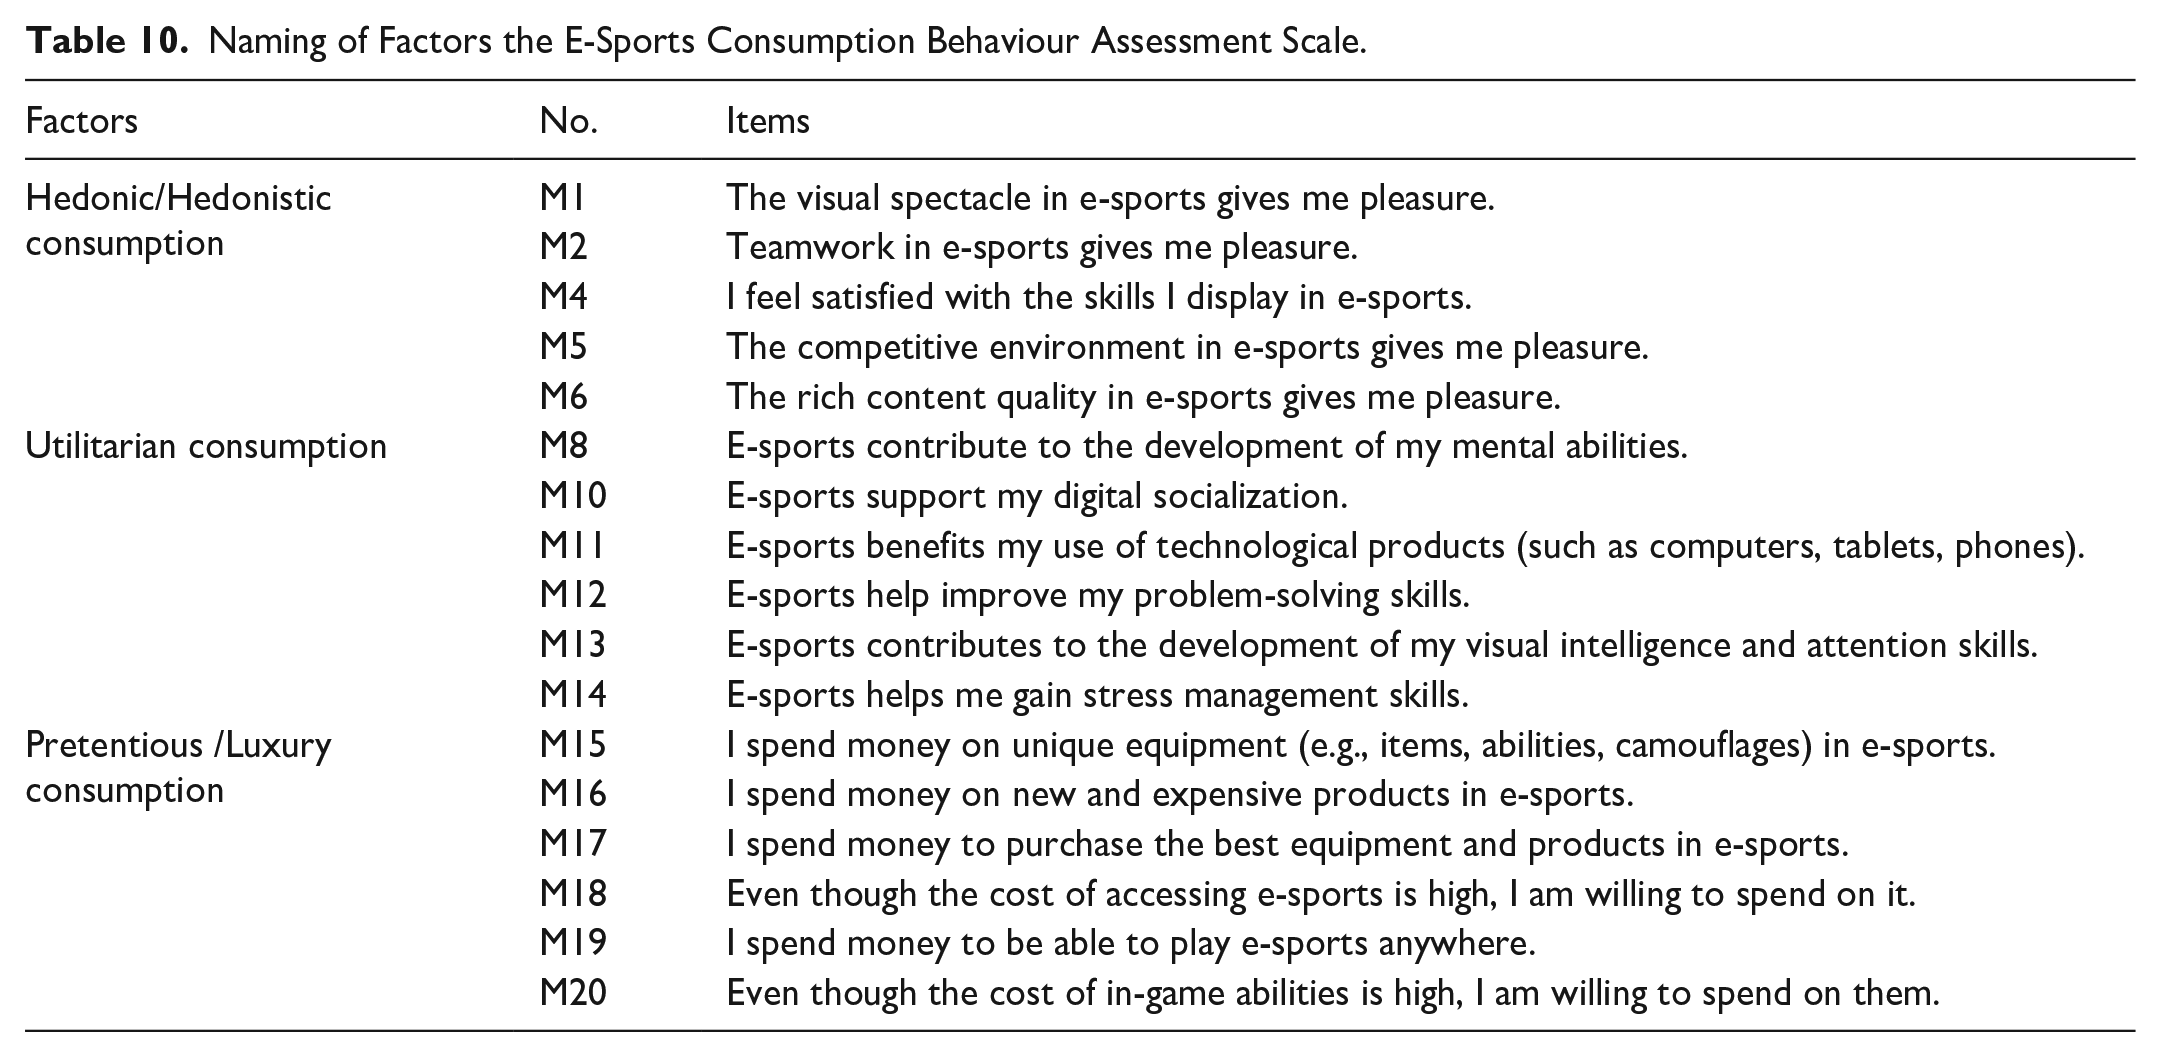
Hedonic/Hedonistic consumption factor: This factor refers to a type of consumption in which e-sports players seek pleasure and emotional satisfaction. It measures behaviours associated with the pleasure and happiness individuals experience during gameplay.
Utilitarian consumption factor: This factor refers to the practical benefits that e-sports players derive from digital games in fulfilling functional, practical and rational needs. It measures behaviours related to the utility and advantages players obtain during the game.
Pretentious/Luxury consumption factor: This factor reflects the consumption of expensive and luxury items by e-sports players to enhance their status, prestige and social image. This type of consumption involves selecting products and equipment to emphasize financial power and position within the game, aiming to attract attention and admiration. Additionally, it allows players to feel special and privileged. This factor measures behaviours associated with pretentious /luxury consumption behaviours during gameplay.
Confirmatory Factor Analysis Results
To assess the goodness of fit and construct validity of the structure identified as comprising three factors in the exploratory factor analysis, confirmatory factor analysis was conducted, yielding the following results. After the three items (M3, M7 and M9) excluded in the exploratory factor analysis were removed, the items were renumbered from 1 to 17. When evaluating the model’s fit to the data, various goodness-of-fit tests can be used, or all may be preferred (Schumacker, 2006, p. 120). There is no consensus in the literature regarding which of these goodness-of-fit statistics should be used (İlhan & Çetin, 2014, pp. 30–31).
As shown in Table 11, based on the fit indices χ2/df = 1.783 < 3, 0.900 < IFI = 0.944, 0.900 ≥ TLI = 0.930, 0.950 ≥ CFI = 0.961, RMSEA = 0.072 < 0.08, RMR = 0.061 < 0.08 the model demonstrates an acceptable fit to the data. Therefore, the validity of the three-factor structure revealed by the exploratory factor analysis was also confirmed by confirmatory factor analysis. In other words, the scale can be used to measure the consumption behaviours of people who play digital games.
Fit Indices Used in Confirmatory Factor Analysis.

Regression Weights of the Model
Regression weights are presented in Table 12. These values represent the predictive power of the observed variables for the latent variables, that is, the factor loadings. Since the p-values for each pairwise relationship is less than .05, the factor loadings are statistically significant. Significant factor loadings indicate that the items correctly load onto the respective factors.
Regression Weights for the Model.
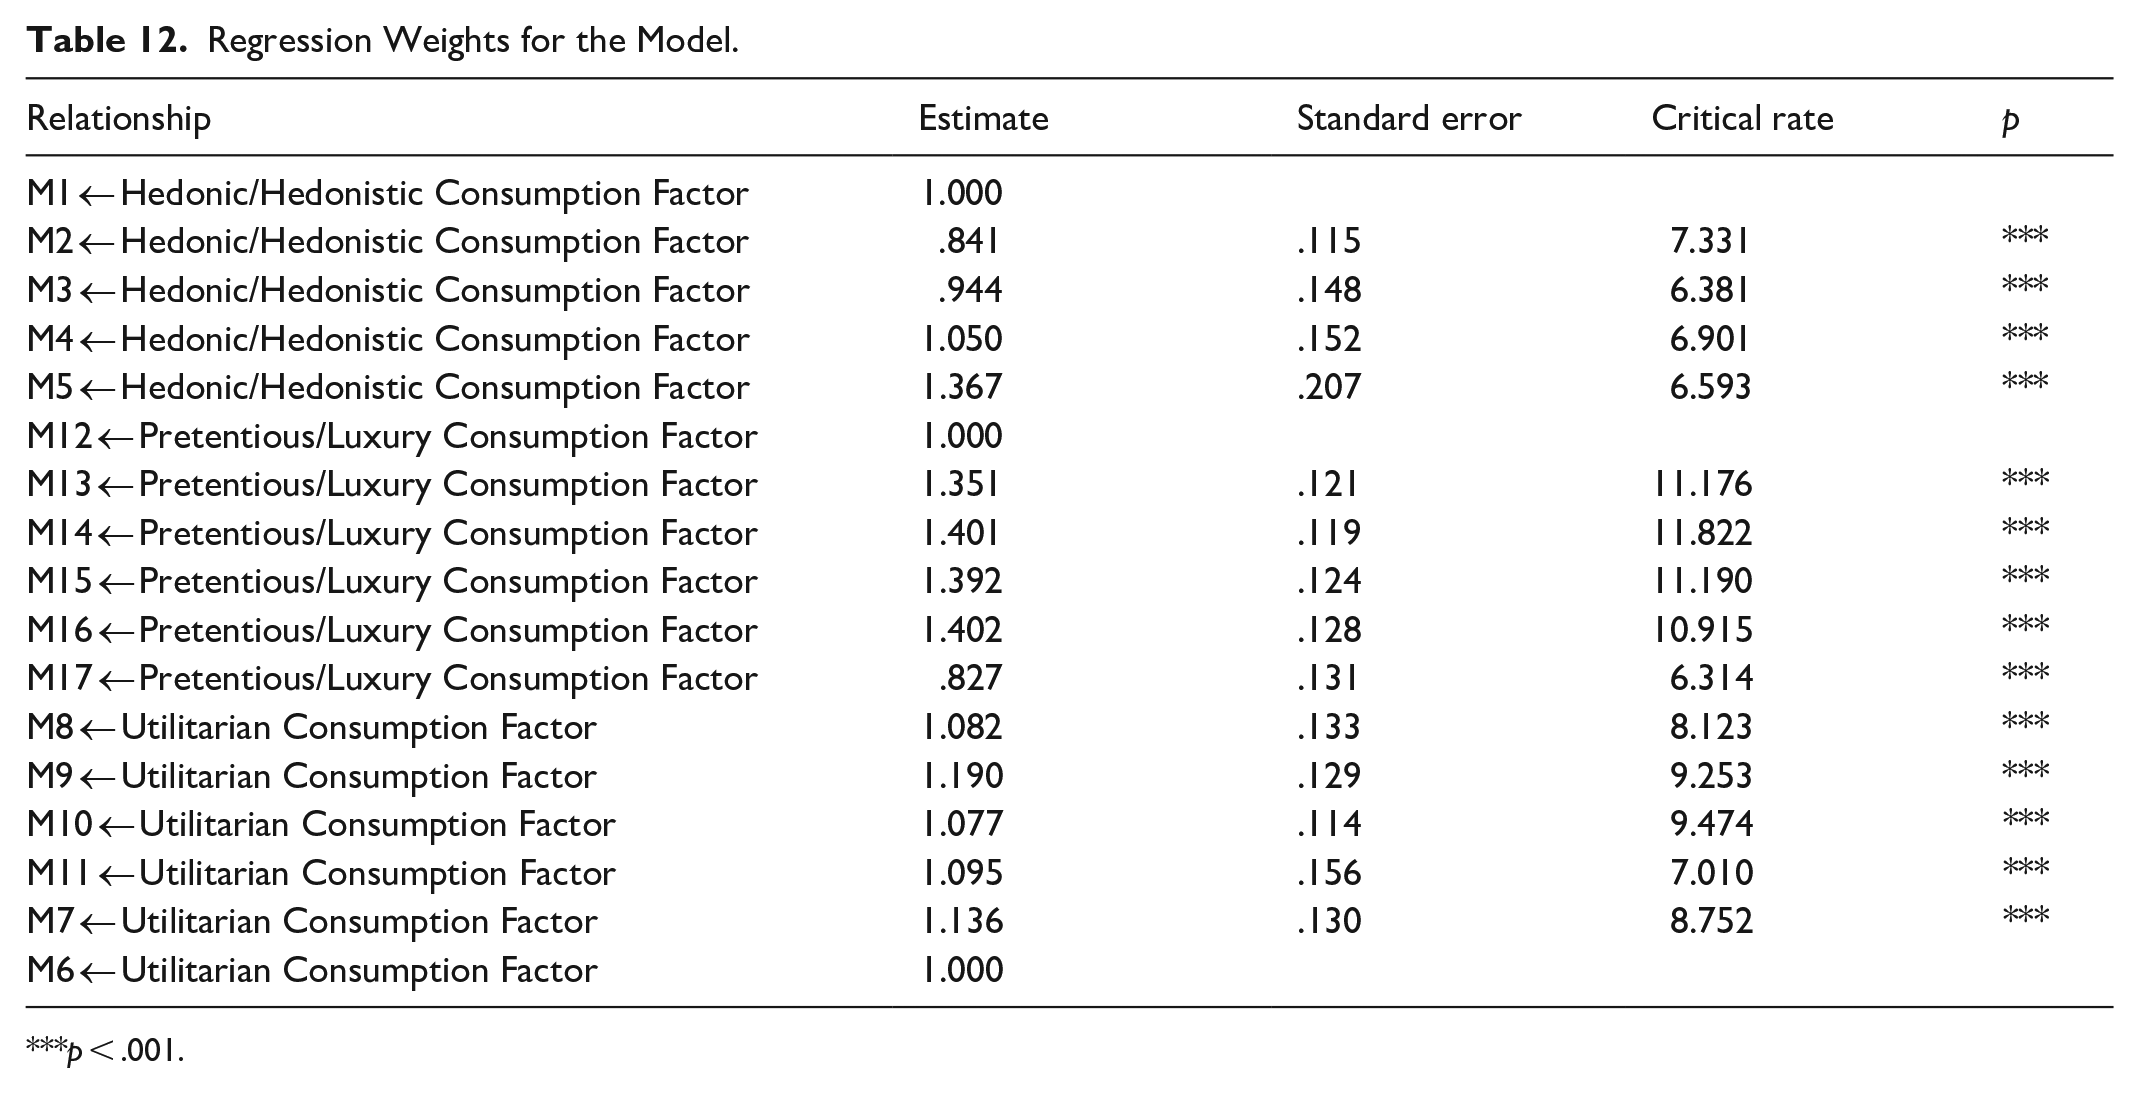
p < .001.
Another important aspect of confirmatory factor analysis is the estimation of regression weights. The standardized regression weight coefficients are presented in Table 13. These values reflect the predictive power of the observed variables for the latent variables, that is, the factor loadings.
Standard Regression Coefficients.

The AMOS diagram of the model obtained as a result of the confirmatory factor analysis is given in Figure 3.

AMOS diagram of the model.
Normality, Reliability, and Validity of Data
According to Bartlett’s Test of Sphericity, a significance (p-value) of less than .01 indicates that the assumption of multivariate normality in the data is met (Akgül & Çevik, 2003, p. 428; Hair et al., 2019, p. 374). To assess construct validity, explanatory factor analysis was performed, followed by confirmatory factor analysis to test discriminant validity (Bollen, 1989). One of the fundamental assumptions in developing Likert-type scales is that a monotonic relationship exists between the attitude being measured and each item in the scale. In other words, each item is assumed to measure the same underlying attitude (Tavşancıl, 2014, p. 152). Therefore, when developing a Likert-type scale, it is appropriate to use Cronbach’s α coefficient, an accepted measure of internal consistency, to determine the scale’s reliability level. Cronbach’s α coefficient ranges from 0 to 1 and a higher α coefficient (closer to 1) indicates that the items in the scale are more consistent with each other and are more likely to measure elements of the same construct (Tezbaşaran, 2008, p. 46). Reliability levels according to Cronbach’s α values are provided below.
According to the data in Table 14, the reliability levels of all factors (F1: α = .817; F2: α = .870; F3: α = .939), as well as of all items and the entire scale comprising 17 items, were found to be highly reliable, with a Cronbach’s alpha internal consistency coefficient of α = .924. The Guttman Split-Half Reliability Coefficient is a statistical measure used to assess the reliability of a test or questionnaire. This method divides the test into two equal halves, calculates the correlation between the results of both halves and thereby determines the internal consistency of the test. It is widely used, particularly in psychological testing and educational assessments (Cronbach, 1951). The Guttman Split-Half method applies the Spearman-Brown formula to adjust the reliability estimate, providing a more accurate reflection of the overall reliability of the test (Spearman, 1910).
Internal Consistency Coefficients of the E-Sports Consumption Behaviour Assessment Scale.

Evaluation of Quantitative and Qualitative Findings Together
The integration of qualitative and quantitative findings revealed a high level of consistency across data sources. Thematic analysis of interviews identified three core dimensions of e-sports consumption behaviour: Hedonic/Hedonistic Consumption, Utilitarian Consumption, and Pretentious/Luxury Consumption. These themes were also clearly reflected in the quantitative scale items and responses.
For instance, under the hedonic consumption theme, qualitative codes such as visual feast, teamwork pleasure, playing during unhappy times, and excitement of competition were prominently emphasized by all or most participants (e.g., P1–P12). These align directly with quantitative scale items such as:
“The visual spectacle in e-sports gives me pleasure” (M1)
“Teamwork in e-sports gives me pleasure” (M2)
“The competitive environment in e-sports gives me pleasure” (M5)
This overlap indicates that emotional and aesthetic motivations are consistently perceived and measured.
Similarly, the Utilitarian Consumption theme, represented by codes like development of mental ability, problem-solving, and visual intelligence, was confirmed by all participants in the qualitative phase. Quantitative items such as:
“E-sports help improve my problem-solving skills” (M12)
“E-sports contributes to the development of my visual intelligence and attention skills” (M13)
“E-sports helps me gain stress management skills” (M14)
support the notion that participants perceive tangible cognitive and psychological benefits from e-sports participation.
In the case of Pretentious/Luxury Consumption, qualitative codes including spending money on equipment, high cost of access, and owning unique items were emphasized by most participants. These perceptions were directly measured with quantitative items such as:
“I spend money on new and expensive products in e-sports” (M16)
“Even though the cost of accessing e-sports is high, I am willing to spend on it” (M18)
“Even though the cost of in-game abilities is high, I am willing to spend on them” (M20)
Overall, the consistency between the qualitative codes and quantitative items confirms that the developed measurement scale accurately captures the underlying dimensions of e-sports consumption. This alignment strengthens the construct validity of the scale and indicates a coherent structure between what participants experience and what the scale measures.
Discussion
The paper’s extensive validation process, including content validity, confirmatory factor analysis and internal consistency measures, addresses this research question effectively. The overall Cronbach’s alpha value of the scale is .924, indicating excellent reliability. Additionally, the three-factor structure confirmed by confirmatory factor analysis (CFA) reflects the complex nature of e-sports (electronic sports) consumption behaviours. These findings suggest that the E-Sports Consumption Behaviour Assessment Scale (E-CBAs) is a robust measurement tool, suitable for use in future research.
Recent studies on scale validity and reliability in the literature support these findings. For instance, Kline (2023), in his work on psychometric theory, emphasizes the importance of reliability and validity criteria in scale development. According to Kline, Cronbach’s alpha values of .90 and above indicate excellent reliability. Additionally, Hair et al. (2019) underscores the importance of using CFA in validity and reliability analyses.
Recent studies in the field of e-sports and digital consumption further support these findings. For instance, De Grove et al. (2016) reported high Cronbach’s alpha values (.91) in the scales they developed to measure e-sports players’ motivation, emphasizing the importance of valid and reliable tools for analysing the multifaceted nature of e-sports consumption behaviours. Similarly, Johnson and Woodcock (2018) examined motivations for e-sports participation and found high internal consistency and validity in their scales. Likewise, the e-sports participation motivation scale developed by M. Gül et al. (2019) also demonstrated a high level of reliability.
E-sports consumption behaviours can be categorized into three key dimensions. Hedonic consumption reflects the pursuit of pleasure and emotional satisfaction during gameplay, driven by entertainment and immersive experiences (Holbrook & Hirschman, 1982; Przybylski et al., 2010; Hamari & Keronen, 2017). The scale developed in this study—E-CBAs—offers a distinct contribution to the literature by integrating hedonic, utilitarian, and luxury consumption dimensions in the context of e-sports. Unlike previous tools that focus predominantly on gaming motivations (e.g., enjoyment, escapism, competition), the E-CBAs scale centres explicitly on consumption behaviour, particularly spending tendencies and consumer identity, which have been underexplored in digital gaming studies (Lehdonvirta, 2009; Hamari & Sjöblom, 2017). Compared to the Gaming Motivation Scale (Lafrenière et al., 2012) or the Motivation to Play Online Games scale (Holl et al., 2024), which prioritize psychological drivers, E-CBAs provides a behavioural economic lens to understand digital consumption in e-sports. Moreover, while Johnson and Woodcock (2019) highlight the symbolic meaning of purchases in forming gamer identity, few existing tools measure this as a structured psychometric construct, as E-CBAs does with its “luxury consumption” subscale. Building upon Baudrillard’s (1998) view of consumption as a coded system of signs through which individuals communicate social meaning, and Veblen’s (1899) notion of conspicuous consumption as a marker of social status, the developed measurement instrument bridges symbolic consumption theory with contemporary models of digital consumer behaviour. Within the e-sports ecosystem—where virtual possessions, avatars, and platform-based interactions increasingly function as signifiers of identity and prestige—this tool provides a refined framework to assess how individuals perform distinction, belonging, and symbolic value through their digital engagements.
The concept of luxury consumption has evolved significantly, moving beyond traditional luxury products to encompass symbolic, psychological, and social elements across diverse domains, including digital platforms like e-sports. In the current study, one of the subdimensions of consumption behaviour identified through factor analysis is “luxury consumption,” which involves status-oriented, symbolic and identity-forming consumption patterns among e-sports players.
Hudders and Pandelaere (2012) suggest that luxury consumption can temporarily increase subjective well-being by enhancing positive affect and life satisfaction, especially among highly materialistic individuals. In this light, e-sports players may engage in luxury consumption behaviours—such as purchasing rare skins or premium items—not only to elevate their digital identities but also to fulfil psychological needs for self-enhancement and social comparison. This consumption behaviour may serve a compensatory function, particularly among younger consumers navigating digital environments that reward status symbols (Hudders & Pandelaere, 2012). Similarly, Dogan et al. (2020) conceptualize luxury consumption tendency as a stable personality trait that drives individuals to purchase unique and expensive products to differentiate themselves and signal status. This framework aligns closely with the findings of the current study, where professional e-sports players demonstrate consumption patterns driven by the symbolic value of digital assets. Their spending on rare in-game items or exclusive access passes may not only reflect financial capacity but also indicate a deep-rooted psychological desire to stand out and belong to a perceived elite community. Moreover, Scussel and Demo (2018) emphasize the role of relational aspects in luxury consumption, particularly in emerging markets. They argue that luxury brands engage customers not only through quality and prestige but also by fostering emotional bonds and identity coherence. This notion can be extended to the e-sports context, where consumption is not merely transactional but deeply embedded in brand loyalty, community participation, and relational identification with gaming companies or platforms. Players’ choices to invest in certain brands (e.g., Riot Games, Valve) may be interpreted as expressions of relational trust and aspirational identity, akin to luxury fashion brand loyalty in traditional settings.
Ultimately, the presence of luxury consumption as a significant dimension in the newly developed E-CBAs scale underscores a shift in how we interpret digital and virtual status symbols. These findings support the view that e-sports environments mirror broader consumer trends, where individuals actively seek both utilitarian benefits and symbolic value through their purchases. In sum, the intersection of luxury consumption, digital identity formation, and community belonging positions e-sports as a fertile domain for further research into emerging forms of conspicuous and identity-based consumption.
Conclusions and Recommendations
This paper employs a mixed-methods approach to explore the economic and social dimensions of the digital gaming industry, with a focus on e-sports. A new measurement tool—E-Sports Consumption Behaviour Assessment Scale (E-CBAs)—was developed to assess consumer trends. Qualitative findings highlight that digital games enhance social skills, promote teamwork, and support personal development through improved problem-solving and stress management. Quantitative results reveal strong consumer spending, especially in e-sports, contributing significantly to industry growth. In-game purchases and tournament participation sustain investment and innovation. Overall, digital games emerge not only as entertainment but also as socially and economically influential tools. The study confirms the industry’s broad appeal and the E-CBAs scale’s value for assessing electronic sports consumer behaviour in scientific contexts.
In conclusion, the E-CBAs scale developed to measure consumer behaviours and tendencies in electronic sports comprises 17 items across three sub-dimensions: hedonic consumption, utilitarian consumption and pretentious/luxury consumption. The scale contains no reverse-scored items and utilizes a five-point Likert scale (1: strongly disagree, 2: disagree, 3: undecided, 4: agree, 5: strongly agree). The minimum possible score on the scale is 17, while the maximum is 85. Based on the total score averages derived from the measurement tool, consumption tendency levels are defined as follows: low (17–39; Likert mean = 1.00–2.29), medium (40–62; Likert mean = 2.30–3.69), and high (63–85; Likert mean = 3.70–5.00).
Limitations and Strengths
This study presents several strengths alongside some limitations that should be acknowledged for the accurate interpretation of its findings and future research implications.
Strengths
One of the foremost strengths of the study lies in its mixed-methods design, which enabled a robust triangulation of qualitative and quantitative data. The initial qualitative interviews conducted with 12 professional e-sports players ensured content validity through real-life experiences and context-specific insights, directly informing the item pool of the scale. This methodologically grounded approach enhanced both the construct and face validity of the measurement tool.
In terms of measurement instrument quality, the E-Sports Consumption Behaviour Assessment Scale (E-CBAs) demonstrated high internal consistency (Cronbach’s alpha = .924), strong construct validity (as confirmed by EFA and CFA), and explained a cumulative variance of 66.37%, which exceeds the commonly accepted threshold in social sciences. The three-factor structure—Hedonic, Utilitarian, and Luxury Consumption—showed both theoretical and empirical coherence, confirming that the instrument captures distinct but interrelated dimensions of e-sports consumption behaviour.
Furthermore, the large and diverse sample size (N = 314), with participants from multiple e-sports titles including Valorant, LoL, CS:GO, PUBG, and FIFA, provided adequate statistical power and enhanced the generalizability of findings within the Turkish e-sports context. The demographic profile revealed that the sample predominantly comprised individuals aged 18 to 25, an age group that aligns with global e-sports engagement patterns, thereby reflecting high ecological validity.
Limitations
Despite its contributions, the study is subject to several limitations. Firstly, the sample is geographically limited to Türkiye, and thus, cultural, economic, and infrastructural differences may limit the generalizability of findings to other regions where e-sports ecosystems function differently (e.g., North America, East Asia).
Secondly, the gender distribution in the sample is heavily male-dominated (82.5% male vs. 17.5% female). This gender imbalance restricts the exploration of consumption behaviours across diverse gender identities. Importantly, this limitation is also reflective of a broader structural issue in accessing female e-sports players. In Türkiye, the visibility and organized participation of women in competitive e-sports remain limited due to social, cultural, and logistical barriers, including a lack of targeted communities, sponsorship, and representation in major tournaments. These challenges reduced the feasibility of recruiting a balanced gender sample.
Additionally, while the scale development process was rigorous, it relied primarily on self-reported measures, which are susceptible to biases such as social desirability and recall inaccuracy. Although Harman’s Single Factor Test results indicated no significant common method variance (explained variance <50%), future studies should consider incorporating behavioural data (e.g., actual purchase history, in-game behaviour logs) to cross-validate findings.
Lastly, although the scale underwent expert validation and pilot testing, its applicability to non-professional or casual gamers remains untested. The recruitment criteria—requiring participants to have a minimum of 1 year of e-sports experience—may have excluded novice users, thus narrowing the scope of the scale’s relevance.
Theoretical Recommendations
This study contributes to the existing literature by presenting a scale that encapsulates three distinct yet interrelated dimensions of e-sports consumption. Drawing from theories of hedonic utility, symbolic consumption and status signalling the E-CBAs scale allows future researchers to explore not only how and why players consume, but also how these patterns relate to identity construction, digital capital, and market segmentation within e-sports communities.
Practical Recommendations
For game developers, the identification of luxury-oriented consumers highlights the importance of integrating premium visual assets and exclusive in-game items. For marketers, understanding the interplay between hedonic pleasure and utilitarian value allows for more tailored promotional strategies—targeting both emotional resonance and functionality. For educators and youth programme designers, the findings emphasize the potential of e-sports platforms to foster cognitive and social skills, suggesting opportunities for integrating game-based learning or gamified education in youth engagement policies.
Footnotes
Appendix A
Acknowledgements
This paper is derived from the PhD thesis of the first author. On the other hand, this paper was supported by the Scientific and Technological Research Council of Türkiye (TUBITAK), Directorate of Support Programmes for Scientists (BIDEB) 2211/A Domestic Graduate Scholarship Programme (Project Number: 1649B032100567). We would like to thank TUBITAK-2211/A Programme for their support.
Author Contributions
OG, ZY: Conceptualization, Data curation, Formal analysis, Investigation, Methodology, Software, Writing – original draft, Writing – review & editing. OG, ZY: Methodology, Writing – original draft. OG, ZY: Conceptualization, Methodology, Writing – original draft, Writing – review & editing.
Ethical Considerations
This paper was conducted with the decision of Sivas Cumhuriyet University/Türkiye, Scientific Research and Publication Ethics Committee dated December 27, 2022 and numbered E-60263016-050.06.04-245517.
Funding
The author(s) disclosed receipt of the following financial support for the research, authorship, and/or publication of this article: On the other hand, this paper was supported by the Scientific and Technological Research Council of Türkiye (TUBITAK), Directorate of Support Programmes for Scientists (BIDEB) 2211/A Domestic Graduate Scholarship Programme (Project Number: 1649B032100567).
Declaration of Conflicting Interests
The author(s) declared no potential conflicts of interest with respect to the research, authorship, and/or publication of this article.
Data Availability Statement
Data used in the research can be requested from the corresponding author. The corresponding author may share the data after providing an explanation of why the data should be published.