
Abstract
Customer choices in online retailing are often influenced by sequential search behavior. However, most existing models ignore the dynamic property of this process. To address this gap, we study a bi-objective product selection and ranking (BP-SS) problem considering sequential search, aiming to jointly optimize the expected revenue and market share. We first develop a two-stage choice model with consideration sets to capture how sequential search influences customer decision-making. Based on this model, we formulate the BP-SS problem and analyze its structural properties, including problem reformulation, unimodality analysis and ranking rules. To solve the problem efficiently, we develop a dynamic programing-based approximation algorithm. Numerical experiments demonstrate that the algorithm consistently outperforms benchmark methods, especially in large-scale scenarios. Moreover, a moderate increase in the trade-off parameter substantially improves market share without a huge revenue loss. This study offers a novel and robust framework for product selection and ranking in online retailing, offering practical insights for balancing profitability and competitive positioning.
Introduction
With the rapid growth of online retailing and the increasing diversity of product offerings, retailers are facing growing challenges in optimizing product selection and ranking strategies (Chen et al., 2025; Compiani et al., 2024). The overwhelming volume of available products often exceeds customers’ cognitive limits, making it difficult for retailers to effectively manage product visibility and influence customer decisions (Dahooie et al., 2024; Huh & Liu, 2025). Although a broader product assortment can enhance consumer appeal, it may also increase decision complexity (Liu & Li, 2024). Therefore, effective product selection and ranking strategies are essential for facilitating customer decision-making and ensuring the visibility of the most relevant products.
One critical challenge in this domain arises from customer behavior under sequential search (R. Ursu et al., 2025). Empirical evidence indicates that customers are more likely to select products positioned prominently in the lists, which underscores the importance of product ranking in purchase decisions (Compiani et al., 2024; R. M. Ursu, 2018). This behavioral pattern shows that customer choices are influenced not only by the inherent utility of products but also by their ranking in the product list. In this context, sequential search plays a crucial role in shaping purchase outcomes, so optimizing the product selection and ranking decision requires careful consideration of sequential search.
Another critical challenge pertains to the objectives used in product selection and ranking. Most existing studies focus exclusively on revenue maximization and achieve substantial advancements in the fields of marketing and operations (Caro et al., 2020; Heger & Klein, 2024). However, as market competition intensifies, relying solely on revenue objectives may overlook long-term strategic goals. Increasingly, scholars and practitioners recognize the strategic importance of market share (Maddah et al., 2021; R. Wang & Sahin, 2018). In a competitive market, increasing market share enhances customer loyalty, improves brand visibility, and secures a retailer’s market position (Tan & Guo, 2023). Therefore, it is crucial for retailers to strike a balance between short-term revenue and long-term market share when optimizing product selection and ranking decisions.
To address these challenges, it is essential to effectively capture customer choice behavior when they confront numerous product options (Tan et al., 2024). The Multinomial Logit (MNL) model is one of the most widely used tools for capturing such choice behavior, due to its strong predictive ability and interpretability (Prashker & Bekhor, 2004; Train, 2009). The MNL model is widely adopted in operations and marketing for modeling utility-maximizing choice behavior (Feng et al., 2022; Talluri & van Ryzin, 2004). Recent studies further highlight its practical relevance, particularly in real-world applications. For instance, a large-scale field experiment conducted on the Alibaba platform demonstrates the practical superiority of the MNL model over machine learning approaches in terms of financial performance (Feldman et al., 2022). Motivated by these advantages, this study adopts the MNL model to investigate product selection and ranking under sequential search.
Building on these insights, this study employs the MNL model to investigate the interaction of customer choice and develops a bi-objective product selection and ranking (BP-SS) problem considering sequential search. The aim is to jointly optimize the expected revenue and market share, providing a structured understanding of how retailers can balance short-term revenue with long-term strategic competitiveness. Specifically, this research seeks to answer three key questions: (1) How does sequential search impact customer choice behavior? (2) How can we develop a mathematical model for the BP-SS problem? (3) What efficient methods can be developed to solve the proposed problem?
To address these questions, we first adopt the MNL model and introduce a two-stage choice model with consideration sets to capture customer behavior under sequential search. Based on this model, we formulate the BP-SS problem and analyze its structural properties to support algorithmic design. Given the problem’s NP-hardness, we reformulate it and develop a dynamic programing-based approximation algorithm to obtain near-optimal solutions. Finally, extensive numerical experiments using both simulation and real-world datasets are conducted to validate the effectiveness and scalability of the proposed algorithm.
The main contributions of this paper are as follows:
We introduce a two-stage choice model that explicitly accounts for sequential search in customer choice.
We formulate the BP-SS problem that integrates both the expected revenue and market share objectives, which offers a more comprehensive performance metric for retail decision-making.
We analyze the structural properties of the BP-SS problem, including problem reformulation, unimodality analysis, and ranking rules.
We present an efficient approximation algorithm based on dynamic programing. The results show that this algorithm outperforms existing benchmarks, particularly in large-scale instances.
The remainder of this paper is organized as follows. Section 2 reviews the relevant literature. Section 3 describes the two-stage choice model and formulates the BP-SS problem. Section 4 presents the problem analysis, and Section 5 introduces the proposed approximation algorithm. Section 6 reports the results of numerical experiments to evaluate algorithm performance. Finally, Section 7 shows the conclusions.
Literature Review
Sequential Search
Due to limited attention or search costs, customers tend to prioritize products that appear at the top of online listings (Agarwal et al., 2011; Rock et al., 2024). Existing studies highlight the significance of product ranking in shaping customer choice behavior. Products positioned higher on the page receive more attention and benefit from enhanced visibility, leading to an increased likelihood of selection (Chandon et al., 2009; Ghose & Yang, 2009; Santos et al., 2012; R. M. Ursu et al., 2024). This behavior is referred to as sequential search, where customers browse products sequentially and make choices based on the order of appearance (Kim et al., 2017). Sequential search implies that customer choice is influenced not only by product assortment but also by the order in which products are presented. Neglecting these factors may result in biased estimations of customer preferences (Adomavicius & Zhang, 2016; Asadpour et al., 2023; Cao & Sun, 2024; Ferreira et al., 2022).
To model customer decision-making under sequential search, researchers develop two primary frameworks. The first is the Cascade model, which characterizes customer behavior as a multi-stage process and assumes that products are viewed in a top-down sequence based on their vertical position on a webpage (Gao et al., 2022; Zhao et al., 2025). The second is the choice model with consideration sets. In this model, the selection process occurs in two stages: customers initially form a consideration set of sequentially viewed products and then make an optimal choice from this set (Aouad et al., 2021; Hauser, 2014; Heger & Klein, 2024).
The related literature suggests that the consideration set offers a robust framework for explaining heterogeneity in customer preferences, accounting for up to 80% of the variance in decision-making processes, even with rough assumptions on consideration set distributions (Manzini & Mariotti, 2014). Empirical results further validate its robustness in reflecting the effects of sequential search on customer decisions (Santos et al., 2012; R. M. Ursu et al., 2024).
Product Selection and Ranking Problem
Customer Choice Model
To capture the complexity of customer decision-making, researchers have introduced numerous customer choice models (Berbeglia et al., 2022; Demoliner & Damacena, 2019). A review of related literature identifies discrete choice models as the most popular choice models, including the MNL model (Kök & Fisher, 2007; Tan & Guo, 2023), the Nested Logit model (Hensher & Greene, 2002; Tarhini et al., 2023) and the Mixed Logit model (McFadden & Train, 2000; Tan et al., 2024).
Among these models, we focus on the MNL model due to its relevance to our study. The MNL model assumes that each product is associated with a utility consisting of a deterministic component derived from observable attributes and a random component determined by unobserved factors (Lu, 2024). Due to its computational simplicity and interpretability, the MNL model is extensively applied in disciplines, such as transportation (Deneke et al., 2024; Lo & Topaloglu, 2022), marketing (R. Wang, 2021; M. Wang et al., 2023), and product decisions (Iurasova, 2025; Strauss et al., 2018).
Bi-Objective Optimization
Most existing studies on product selection and ranking focus on expected revenue maximization. For example, Gallego et al. (2020) consider consumer heterogeneity and present a product framing and pricing model. Aouad and Segev (2021) propose a polynomial-time approximation scheme to find near-optimal ranking positions for product ranking based on vertically differentiated preferences. Lei et al. (2022) examine revenue optimization under inventory constraints.
However, these studies often neglect customer-centric objectives. In contrast, a growing body of literature addresses alternative goals, such as market share maximization. For instance, R. Wang and Sahin (2018) explore the impact of customer search cost and propose the k-quasi-attractiveness-ordered strategy to maximize market share. Asadpour et al. (2023) study the sequential submodular maximization problem in online retailing to maximize purchase engagement. Tan and Guo (2023) study a capacitated assortment problem that considers market share, and they provide a two-stage approach for deriving an optimal solution. Despite this progress, the combined optimization of revenue and market share remains underexplored in the product selection and ranking problem.
Approximation Method
Given the computational complexity of product selection and ranking problems, researchers develop various approximation algorithms. For instance, R. Wang and Sahin (2018) provide a fully polynomial time approximation algorithm to solve the product ranking problem considering consumer search cost. Gallego et al. (2020) develop an algorithm with an approximation ratio of
In summary, although sequential search and product optimization are prevalent in online retailing, existing literature rarely integrates them into a unified analytical framework. This study is the first to utilize the MNL model to explore the interaction between sequential search and customer choice, while also considering the trade-offs between revenue and market share in the BP-SS problem. Compared to existing research, this work offers a more comprehensive and technically rigorous approach to product selection and ranking.
Problem Description
Figure 1 illustrates the three main stages of the methodology proposed in this study: problem description, property analysis, and approximation algorithm. The problem description phase involves a theoretical analysis of customer choice behavior utilizing consideration sets and the MNL model, which culminates in the formulation of the BP-SS model. This model seeks to optimize both expected revenue and market share. The property analysis phase transforms the BP-SS model into the RBP-SS model by partitioning product preference weights. This transformation is followed by an unimodality analysis of the bi-objective function, and the derivation of ranking rules to guarantee convergence of the solution. The final phase introduces the dynamic programing-based approximation algorithm, and its performance is validated through numerical experiments using both simulation and real-world datasets.

Methodology presented in this study.
Sequential Search and Choice Model
We construct a nested list structure for consideration sets to analyze the impact of sequential search on customer choice behavior. For simplicity, we exclude costs associated with stockouts, replenishment, and procurement. We assume that customers consider only a subset of the available products before making a purchase, referred to as the consideration set (Bettman et al., 1998). This set comprises all products that a customer sequentially browses, with its size being positively correlated with the search effort exerted by the customer during the product search process (Mehta et al., 2003). Hence, products ranked higher are more likely to be included in the consideration sets.
To formalize customer behavior under sequential search, we propose a two-stage choice model, illustrated in Figure 2. In the first stage, customers sequentially browse the available product list and form consideration sets based on product rankings. In the second stage, customers make their final purchase decision from the formed consideration set. We assume that the customer choice behavior adheres to the MNL model, wherein customers select the product that maximizes utility, which depends on product attributes (e.g., price, quality) and customer preferences. Although sequential search significantly influences the composition of consideration sets in the first stage, it does not affect the preference weights assigned to products in the second stage.

Illustration of two-stage choice model.
We consider a market with n candidate products and n candidate product positions. Given a product ranking
The probability distribution of the consideration set is related to product rankings. Customers are categorized according to the final positions they browse. We let
Once a consideration set
Let m denote the position index of product i in the ranking π. Given the consideration set

where
Since product preference weights are exogenous, we have

The probability of the no-purchase option is
This two-stage customer choice model offers two key advantages. First, it provides a more accurate representation of customer choice behavior under sequential search and offers a better explanation of the uncertainty in the customer decision-making process. Second, it establishes a clear theoretical foundation for understanding the interaction between product choice and ranking position, which is crucial for investigating the BP-SS problem.
Model Formulation
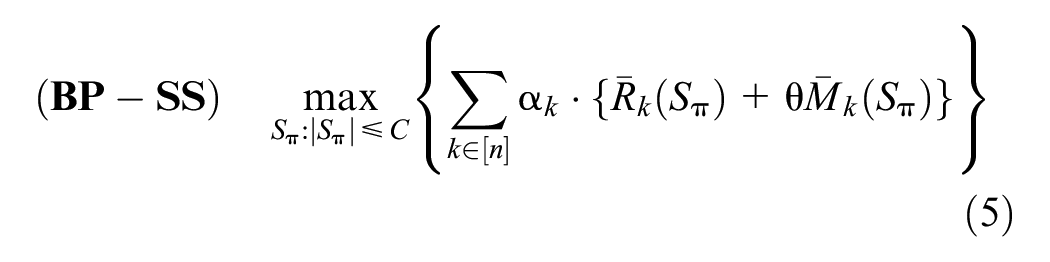
We present the bi-objective function that considers the expected revenue and market share and then build the mathematical model for the BP-SS problem. Given the product consideration set

Equation 3 represents the traditional objective that focuses only on the expected revenue, which is insufficient in a competitive market environment. Market share also plays a pivotal role in enhancing the retailer’s competitive positioning. Therefore, we introduce market share as a second optimization objective, denoted as

Given the product consideration set
We assume that the parameter θ is exogenous and the product consideration set
Problem Analyze
We analyze the properties of the BP-SS problem to develop an efficient approximation algorithm. Since existing literature suggests that the traditional product selection problem is NP-hard even with two customer groups (Bront et al., 2009; Rusmevichientong et al., 2014), the BP-SS problem is also NP-hard. Unless P=NP, it is unlikely that an optimal solution to the BP-SS problem can be found in polynomial time. Therefore, we reformulate the problem and analyze its properties to establish a theoretical foundation for developing an efficient approximation algorithm.
Problem Reformulation
Since the BP-SS problem is NP-hard and involves large data dimensions with high computational complexity, we propose a reformulation that simplifies the BP-SS problem while minimizing the loss in the value of the bi-objective function. Specifically, the reformulation consists of two main steps: converting the raw product preference weights into structured data and refining the bi-objective function.
First, we let

where
The boundary of the partition is defined as
Figure 3 depicts the reformulation of product preference weights and the formation of product partitions. The long vertical lines in Figure 3 represent the original preference weights of the products within the interval
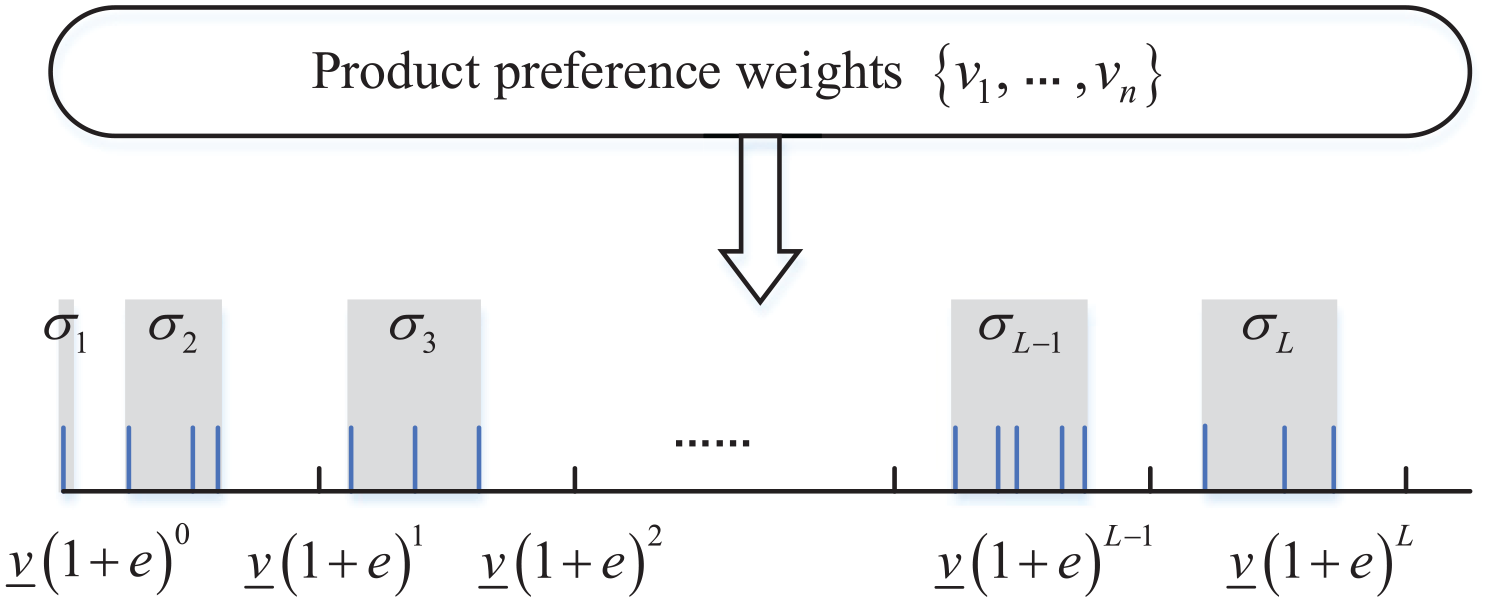
Illustration of product partition sets.
Then, we refine the bi-objective function. We let
The goal of this reformulation is to convert the product weights and bi-objective function data into a structured format, facilitating the design of the approximation algorithm. Since the expected revenue and market share objectives are formulated as polynomial functions with respect to
Unimodality Analysis
We conduct a theoretical analysis of the relationship between the ranking positions and the values of the bi-objective function. To facilitate this analysis, we define the bi-objective function
Proof. We employ a counterfactual approach and assume that there exists a ranking position

According to
Then, we interchange products at the
Thus, we have
This conclusion contradicts the claim that
The unimodal property in Lemma 1 implies that the value of the bi-objective function increases as customers begin browsing products, peaking at an optimal ranking position. Beyond this point, further browsing results in diminishing revenues as the probability of customer choice decreases with the additional products presented. This observation highlights the trade-offs between customer engagement and the efficiency of product selection. Figure 4 provides a visualization of the unimodal pattern of the bi-objective function.

Unimodality of the bi-objective function.
In Figure 4, the bi-objective function exhibits a unimodal pattern, characterized by a single maximum value. This property guarantees the existence of a unique optimal solution, which greatly simplifies the decision-making process for retailers. In practice, the unimodal function ensures an optimal solution within the given constraints, enhancing the ability to model and forecast economic behavior, particularly in competitive markets. Moreover, the unimodal property supports more effective decision-making decisions such as product ranking, pricing strategies, and promotional activities. For example, when customer willingness to engage in product searches is low, retailers can implement targeted incentives, such as offering discounts or rewards for browsing a certain number of items, to enhance consumer engagement. The presence of a distinct peak in the unimodal function facilitates the identification of the most effective strategies for long-term growth and revenue maximization, ensuring a more efficient resource allocation.
Ranking Rules
We introduce specific product ranking rules to simplify the solution of the BP-SS problem. To maximize the expected market share, we employ an empirical solution that arranges products in descending order based on their preference weights. However, this weight-order policy places high-weighted products at the top positions, which results in smaller customer consideration sets that overlook high-revenue products placed at lower positions, thereby reducing the expected revenue. Similarly, to maximize the expected revenue, the empirical solution ranks products based on their expected revenues, placing high-revenue products at the top position. However, this leads to an inadequate supply of products and a decreased likelihood of customer choice.
To balance the expected revenue and market share objectives, we adopt the following product ranking rules. Let
Based on Assumption 1, we introduce two product ranking rules to guide the solution of the RBP-SS problem. Assumption 1(a) posits that when two products have identical preference weights, the product i with higher revenue is ranked higher, that is
These ranking rules serve to simplify the computational complexity of the RBP-SS problem by structuring the ranking logic. Assuming deterministic demand and fixed preference weights, these rules provide a foundation for the design of the efficient approximation algorithm that strike a balance between maximizing the expected revenue and market share.
We then demonstrate that the optimal solution to the RBP-SS problem follows Assumption 1, as shown in Lemma 2.
Proof. We use a counterfactual approach to prove Lemma 2. First, we claim that the optimal solution

As
Similarly, we claim that the optimal solution
Lemma 2 confirms that the optimal solution to the RBP-SS problem satisfies the ranking rules. These rules simplify the solution process without causing a significant loss in the value of the bi-objective function. Moreover, since products satisfying these rules correspond to approximate counterparts in the product partitions, the ranking rules offer a robust foundation for the subsequent design of the approximation algorithm with negligible loss of optimality.
Approximation Algorithm
Conceptual Framework
We present the conceptual framework of the proposed approximation algorithm for solving the RBP-SS problem. The central idea involves building an approximation function

Conceptual illustration of the approximation algorithm.
As shown in Figure 5, the abscissa denotes the ranking positions of products viewed by customers, while the ordinate denotes the values of the bi-objective function. Given a parameter
The approximation function
Given that the bi-objective function is unimodal with respect to ranking positions, the minimum value of each partition set
This approach offers several computational advantages. First, it reduces the number of function evaluations by approximating each partition using only its boundary values. Second, it alleviates the need for detailed knowledge of the underlying probability distribution of individual products, and it requires only the aggregated probabilities
In summary, when the number of partition sets is sufficiently large, the approximation function provides a close estimate of the original bi-objective function, as shown in Figure 5. Because approximate preference weights and revenues are expressed as integer powers of
Algorithm Procedure
Based on the above framework, we present the implementation steps of the approximation algorithm. The flowchart of this algorithm is shown in Figure 6.

Flowchart of the approximation algorithm.
As illustrated in Figure 6, the approximation algorithm begins with data collecting. These inputs include product weights, revenues, probability distributions, and the related parameters. Following this preparatory step, the algorithm proceeds in four main steps.

where
Equation 8 comprises two main components: the first captures the cumulative value of the bi-objective function
To ensure the existence of an optimal solution to the recursive formulation, appropriate boundary conditions must be defined. Specifically, for the initial partition set

We then discuss the constraints of the recursive equations. First, we assume that the partition sets are organized in a nested list structure. Second, the solution must satisfy the capacity constraint, denoted by
Moreover, we need to determine the optimal ranking positions for the selected products. This process involves two main steps: first, sorting the L partition sets to form the initial sequence of ranking positions; second, sorting the products within each partition set according to the ranking rules. This ensures that the solution maximizes the objective function of the recursive Equation 8 and forms an optimal ranking position strategy π for the product consideration set
The pseudocode for the approximation algorithm is presented as follows.
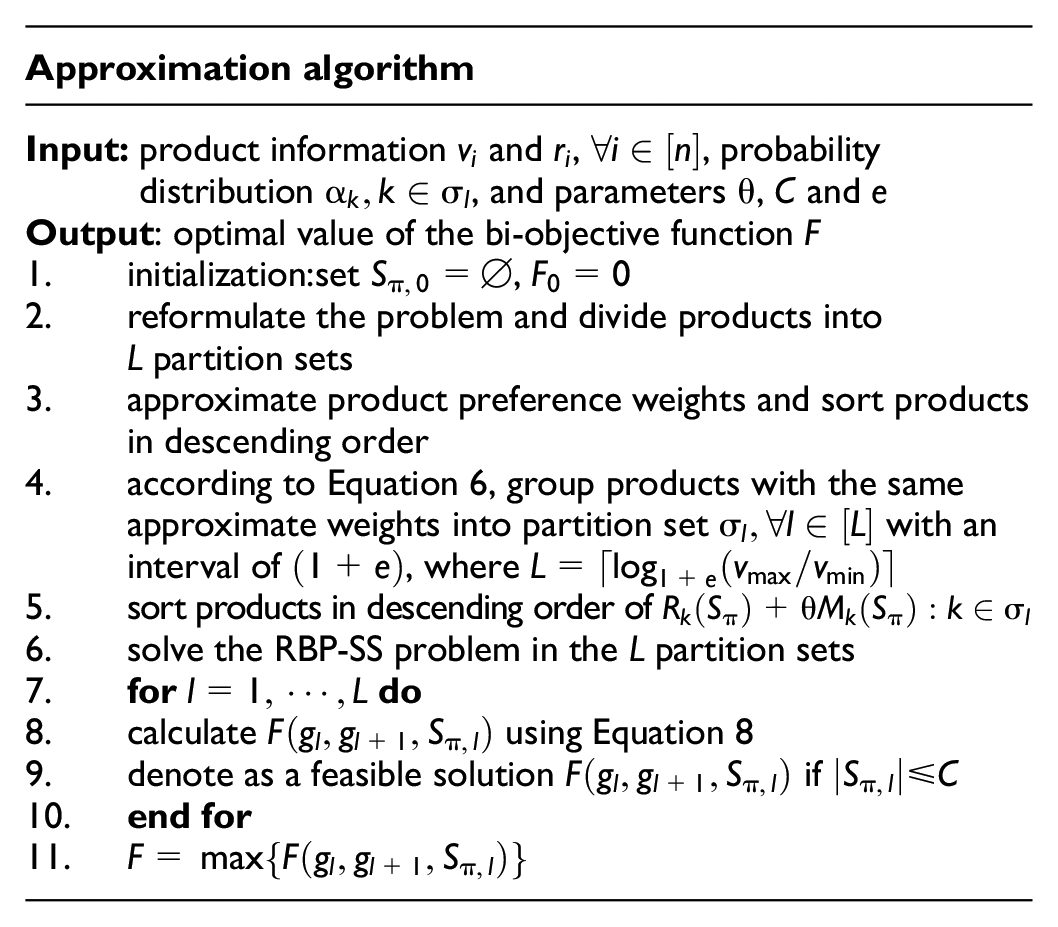
Since the running time of the approximation algorithm varies exponentially with the number of products, this algorithm qualifies as a polynomial time approximation algorithm. We then examine its approximation quality in Lemma 3.
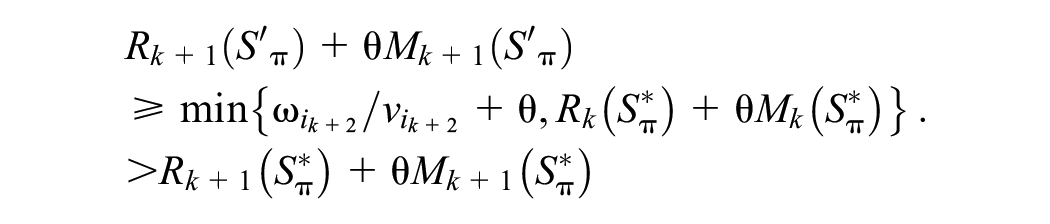
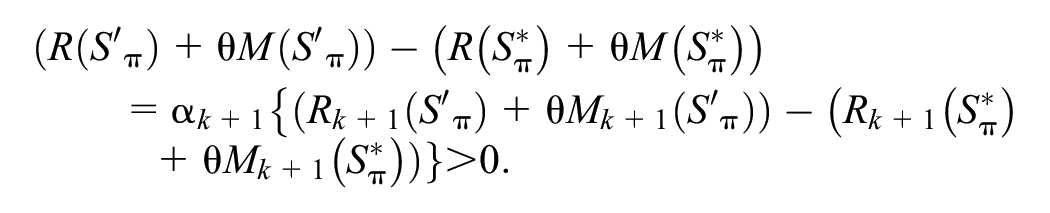
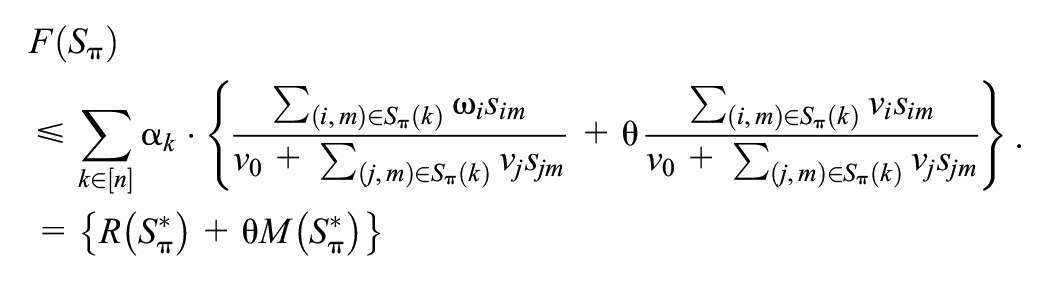
Proof. We first examine the left-hand side of the inequality. We have

Then, we examine the right-hand side of the inequality. We have
Proof ends.
Lemma 3 demonstrates that the proposed approximation algorithm achieves a guaranteed performance bound. Specifically, the solution obtained by the algorithm is within a factor of
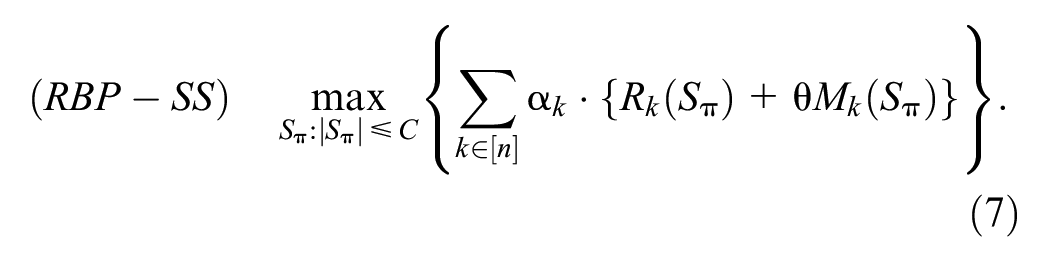
According to Lemma 3, we present robust and general convergence results for the approximation algorithm. Unlike heuristic methods that rely on simulation-based validation, the proposed algorithm offers a formal theoretical guarantee on solution quality under any reformulation of the BP-SS problem. This makes it particularly advantageous in practical applications, such as retail product selection and ranking, where reliable and interpretable decision-making frameworks are essential.
Numerical Experiments
Benchmark Algorithms
To evaluate the performance of the approximation algorithm in solving the BP-SS problem, we compare it with two classical solution methods: revenue order and local search. The implementation details of these benchmark algorithms are described in the following.
Simulation Study
The simulation data setup is described as follows. The revenue parameters are generated as independent random numbers from a standard lognormal distribution, and the product preference weight parameters are generated as independent random numbers from a uniform distribution over [0,1]. We denote the capacity constraint as
Simulation Results
We set the number of products
Results of the Simulation Cases.

Table 1 presents the average values of the bi-objective function obtained by the approximation algorithm and two benchmark algorithms. The second, third, and fifth columns show the average values solved by the approximation algorithm (AA), local search (LS), and revenue order (RO). The fourth and sixth columns report the gaps between the AA and LS, and between the AA and RO, respectively.
From Table 1, when the number of candidate products is small, the average values of the bi-objective function obtained by the approximation algorithm are slightly lower than those obtained by the local search, but substantially higher than those obtained by the revenue order. Notably, the performance gap between the approximation algorithm and local search increases as the number of products increases. This is attributed to the tendency of local search to converge prematurely to local optima in large-scale instances. Additionally, the approximation algorithm consistently outperforms the revenue order method, although the performance gap narrows as the product set size increases. Overall, the approximation algorithm demonstrates robust performance and scalability in addressing the BP-SS problem.
We then provide the average running time of 10 simulation instances across four cases in Table 2.
Average Running Time of the Simulation Cases.

Table 2 reveals a significant difference in the average running times between the approximation algorithm and local search. For small-scale cases (
Sensitivity Analysis
Impact of Data Volume
To evaluate the impact of data volume, we compare the performance of the three algorithms across different problem sizes. Figure 7 presents the bi-objective function values for 10 random simulation cases with varying product numbers.
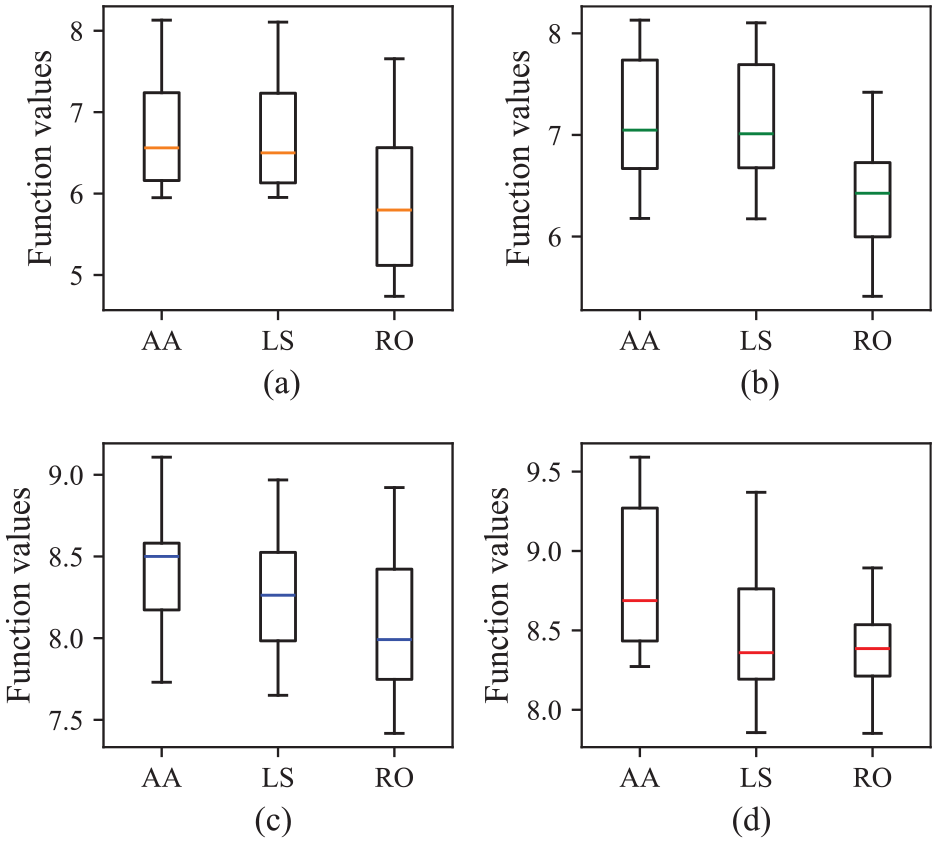
Results of different data volumes: (a) n = 30, (b) n = 50, (c) n = 300, and (d) n = 500.
Figure 7 reveals the performance of the three algorithms in four different cases. In small-scale cases, the approximation algorithm exhibits stable and consistent performance, indicating its reliability in limited data environments. As the product number increases, the approximation algorithm maintains superior stability and effectiveness. This suggests that the approximation algorithm is well-suited to handling large-scale data and offers reliable optimization outcomes.
To further analyze the influence of data volume on the approximation algorithm, we present the function values of the three algorithms in small and large data, as shown in Figure 8.
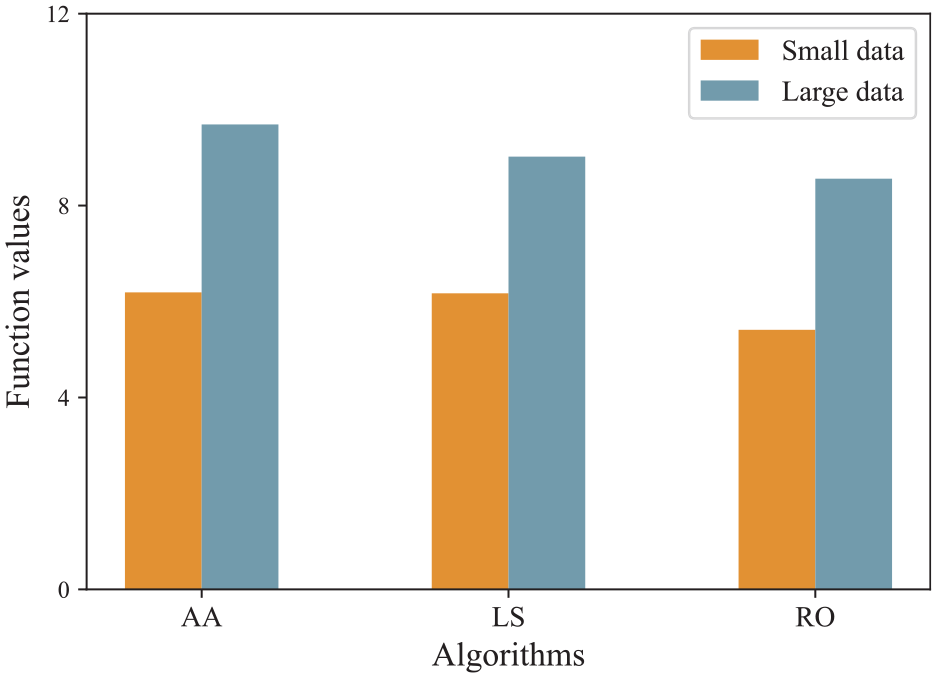
Results under small and large data.
Figure 8 shows that the performance of the revenue order method is suboptimal for both small and large data. While the local search maintains relatively strong performance in smaller datasets, its effectiveness declines sharply as the data volume increases. Conversely, the approximation algorithm sustains high performance, validating its adaptability and robustness in large-scale decision-making environments. Therefore, the proposed approximation algorithm shows better adaptability and optimization capabilities for solving the BP-SS problem.
Impact of the Trade-Off Parameter
To explore the impact of the trade-off parameter θ on the computational results, we randomly generate two instances of
Results Under Different Trade-Off Parameters.

In Table 3, the first column denotes the number of products, while the second column denotes the different trade-off parameters. The third and fourth columns show the optimal values of the expected revenue (Ren) and market share (MS) obtained by the approximation algorithm. The fifth, sixth and eighth columns report the optimal bi-objective values obtained by the three algorithms (AA, LS and RO). The seventh and ninth columns represent the performance gaps between the approximation algorithm and the two benchmark algorithms.
Table 3 presents the optimal solutions of the three algorithms under different trade-off parameters. Intuitively, an increase in trade-off parameters corresponds to an increase in the expected market share but a decrease in the expected revenue. For instance, increasing the parameters (from 1 to 3) leads to a slight decrease in expected revenues (from 5.99 to 5.84) and a substantial increase in market share (from 73.45% to 81.24%). This shift results from prioritizing broader market reach, thereby replacing high-revenue items with products of greater appeal.
To visualize this relationship, Figure 9 plots the trends in the expected revenue and market share under different trade-off parameters.

Revenue and market share under different trade-off parameters: (a) n = 30 and (b) n = 300.
Figure 9 illustrates the trends in the expected revenue (blue curve) and market share (orange curve) under different trade-off parameters in the two instances (n = 30 and n = 300). The results show that the expected revenue decreases and the expected market share increases as the trade-off parameter increases. This pattern holds consistently across both small and large instances. When the trade-off parameter is low, increasing it effectively boosts market share without significant revenue loss. However, when the trade-off parameter is high, further increases lead to diminishing returns in revenue, despite a slight increase in market share. This phenomenon can be attributed to intensified market competition and resource constraints, where further pursuit of market share may not translate into proportional gains.
Real-World Application
To further validate the practical effectiveness of the approximation algorithm, we apply it to a real-world dataset of apples obtained from Platform A, located in Chengdu, China. This dataset is collected from March 13 to April 13, 2023, and contains transaction records of 48 candidate apple products. Each product is described by two quantitative features: revenue (in yuan) and an estimated preference weight. The revenue values are directly extracted from the raw transaction data. To estimate the preference weights, we employ the Expectation-Maximization (EM) algorithm (Vulcano et al., 2012). Table 4 summarizes the key features of this dataset.
Data Description.

After discussing with the platform’s operations manager, the retailer aims to select up to 12 products from the pool of 48 candidates to maximize the expected revenue and market share. To achieve this, we incorporate the capacity constraint
Table 5 presents the results under different trade-off parameters in the real-world application. As shown in Table 5, the trade-off parameter governs the balance between maximizing revenue and expanding market share. As the trade-off parameter increases, the expected market share rises while the expected revenue decreases.
Results in the Real-World Application.
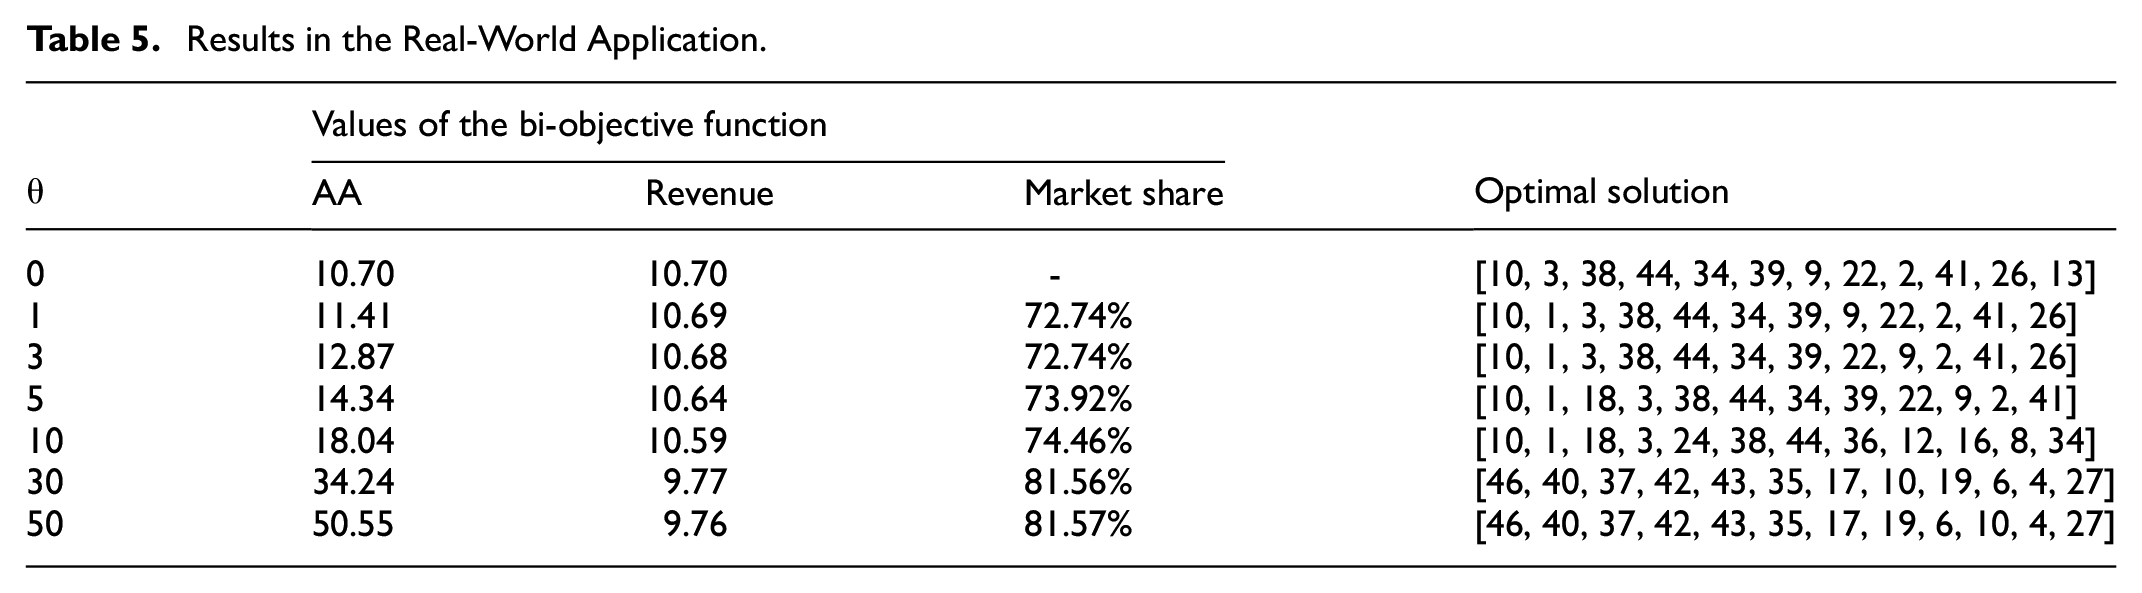
The results demonstrate that as the trade-off parameter increases appropriately, the expected market share rises without incurring significant revenue loss, especially when the trade-off parameter is small. This behavior reflects the inherent tension between the two objectives. For instance, moderate increases in the trade-off parameter from 3 to 5 yield a 1.18% increase in market share achieved with a mere 0.04 unit decrease in the expected revenue. This indicates that retailers can strategically adjust their objective function to prioritize broader market appeal without sacrificing profitability.
From a managerial perspective, the findings in Table 5 underscore the practical value of the approximation algorithm in enabling data-driven product selection. The algorithm allows retailers to adjust their strategic priorities by controlling the trade-off parameter by business objectives. Moreover, the results reveal diminishing marginal returns in market share as the parameter increases, highlighting a point beyond which further resource allocation may not be cost-effective.
Therefore, in market saturation or budget limitations, retailers may prefer to maintain a balanced product portfolio that prioritizes high-revenue items while securing a market share threshold sufficient to retain competitiveness. Additionally, the algorithm provides the optimal product mix and corresponding rankings, thereby offering an actionable framework for online product assortment planning and performance management.
Discussion and Conclusions
This study addresses the bi-objective optimization problem for product selection and ranking in online retailing. Specifically, it focuses on the impact of sequential search behavior and the trade-offs between the expected revenue and market share. To address this challenge, we first construct a two-stage choice model that incorporates consideration sets and then formulate the BP-SS problem. The aim is to jointly optimize the product selection and ranking decision to achieve a balanced outcome between competing business objectives. To solve the BP-SS problem, we propose a dynamic programing-based approximation algorithm and validate its performance through extensive numerical simulations and real-world applications. The results provide valuable theoretical insights and practical guidance, laying the groundwork for further research and real-world implementations.
Theoretical Implications
From a theoretical perspective, our contributions are threefold.
First, we extend the classical MNL model by integrating it with a two-stage choice framework that includes consideration sets. This enhanced model captures more realistic consumer decision-making processes by considering its sequential and probabilistic properties. Unlike conventional MNL-based approaches, our model accommodates the sequential and dynamic nature of product visibility and consumer fatigue, thereby offering a more nuanced representation of consumer purchasing behavior.
Second, we introduce the bi-objective optimization framework that jointly considers the expected revenue and market share, which advances the literature beyond traditional single-objective models. This bi-objective structure reflects the multi-faceted nature of business goals in e-commerce, where retailers must balance immediate profitability with long-term strategic positioning. Our numerical results demonstrate that modest adjustments to the trade-off parameter can yield significant improvements in market share without significant revenue loss. This finding is consistent with and builds upon prior work such as Maddah et al. (2021), who also emphasize the value of multi-objective decision-making in retail analytics.
Third, our proposed dynamic programing-based approximation algorithm introduces an efficient and scalable approach for solving complex product selection and ranking problems. The algorithm exhibits robust performance across multiple test scenarios. For instance, in large-scale settings with 500 candidate products, it achieves an 89.93% improvement in computational efficiency over benchmark methods without compromising solution quality. This makes it a promising approach for deployment in real-time and large-scale retail environments.
Overall, these contributions offer a novel methodological and analytical framework that bridges behavioral modeling, multi-objective optimization, and algorithmic efficiency, thus advancing both the theory and application of assortment planning and product prioritization in digital commerce.
Practical Implications
From a practical perspective, the findings also offer actionable insights for practitioners operating in competitive online retail markets.
First, the bi-objective optimization framework provides a structured and data-driven approach to managing product selection and ranking. By explicitly modeling the trade-offs between short-term revenue and long-term market share, the proposed method enables retailers to tailor their assortment strategies according to dynamic business objectives. This is particularly critical in competitive, fast-paced markets where customer loyalty is low and strategic assortment decisions must balance performance with differentiation.
Second, integrating product selection with ranking optimization enables retailers to align their offerings more effectively with consumer preferences and shopping behaviors. Retailers can utilize this framework to deploy strategic positioning strategies. For example, placing high-margin or seasonal products in top-ranking positions increases exposure and conversion. Real-world practices, such as Amazon’s use of customer browsing and purchasing data to personalize assortments (Kim et al., 2017), underscore the practical relevance of such strategies. Our findings suggest that for retailers with lower market penetration, strategically ranking high-utility products alongside selectively chosen high-margin items can serve as a dual-purpose approach, which maximizes purchase likelihood while facilitating opportunities for cross-selling and upselling. This strategy fosters increased customer engagement and supports both short-term and long-term growth goals.
Third, the proposed dynamic programing-based approximation algorithm offers a flexible and computationally tractable tool for product assortment planning. Retailers can adapt this algorithm to various market contexts by incorporating business constraints and customer segmentation data. Beyond e-commerce, this framework holds promise for broader applications in domains such as healthcare, education, and public policy (Binsar & Mauritsius, 2020). For instance, in healthcare decision-making, a similar bi-objective framework could be employed to rank treatment options based on expected health outcomes and patient satisfaction, thereby improving allocation efficiency and service personalization.
Limitations and Future Research Directions
Despite the valuable contributions of this study, there are several limitations and future research directions. First, this study focuses on a specific online retailing environment and does not explore alternative approaches from cross-disciplinary perspectives. Thus, it would be interesting to apply the proposed model and algorithm to other domains, such as healthcare and education. Second, it would be interesting to incorporate varying customer segments and provide a more nuanced model of customer behaviors, like the mixed logit model or Markov model. Besides, it would be valuable to expand the scope to include other market information, such as pricing or omnichannel strategies, and provide robust optimization strategies of how this information influences product selection and ranking decisions.
Footnotes
Ethical Considerations
This article does not contain any studies with human or animal participants.
Consent to Participate
There are no human participants in this article and informed consent is not required.
Author Contributions
Yuyang Tan: Conceptualization, Methodology, Software, Writing—original draft, Writing—review & editing. Hao Gong: Investigation, Visualization. Chunxiang Guo: Supervision, Project administration.
Funding
The author(s) disclosed receipt of the following financial support for the research, authorship, and/or publication of this article: This work was supported by the Key project of Sichuan Provincial Key Research Base of Philosophy and Social Sciences [grant number Xq24B10] and the Talent Project of Xihua University [grant number w2420130].
Declaration of Conflicting Interests
The author(s) declared no potential conflicts of interest with respect to the research, authorship, and/or publication of this article.
Data Availability Statement
The first author will make available the datasets used and analyzed in this study upon reasonable request.