
Abstract
When online retailers allow third-party sellers to place certain products on their platforms, these sellers become not only collaborators but also competitors. The purpose of this study is to compare the differences in price discounts between Third-Party Marketplace (3PM) sellers and Fulfilled by Walmart (FBW) sellers on Walmart.com over time. The results, based on data collected in the form of the daily prices of 54,162 products offered by Walmart during the holiday season, show that the average discount for 3PM sellers is significantly lower than that for FBW sellers. In addition, across product categories, FBW sellers had significantly higher average discounts than 3PM sellers in the electronics, housewares, and toys categories. Furthermore, the level of discount began to increase in early November and peaked around Christmas. Our findings may help retailers manage their dealings with these third-party sellers while also helping consumers to optimize their purchasing decisions.
Introduction
Along with the development of the internet and technology, online retail is growing rapidly in the world. The 4th Quarter 2018 Retail E-Commerce Sales Report indicates that e-commerce sales reached 513.6 billion, accounting for 9.9% of total sales in the United States. Many online retail companies not only sell products on their own websites but also allow and even encourage third-party sellers to use their platforms. These third-party sellers thus become partners and potential competitors of the online retail companies. The purpose of this study is to investigate the pricing strategies of these third-party sellers, compared with that of the corresponding online retail company, employing large-scale empirical data.
For conducting the analysis, we chose Walmart as the target company for two reasons. First, it is well known that Walmart is the world’s largest offline retailer, with annual revenues of nearly US$500 billion. Although only a relatively small proportion of its total revenue comes from online retail (Walmart, 2018), to change this situation as quickly as possible, Walmart has expanded its online retail business through mergers and acquisitions. In 2018, Walmart’s online retail growth rate reached 39.4%, and its online business accounted for 4.0% of all online retail sales in the United States, totaling US$20.91 billion (eMarketer, 2018). Therefore, Walmart plays a considerable role in the United States online retail industry. Second, Walmart provides an online marketplace and allows third-party sellers to sell their products in it. Sellers on Walmart.com can be divided into two types: Third-Party Marketplace (3PM) sellers and Fulfilled by Walmart (FBW) sellers. The 3PM is defined as a Walmart Marketplace that provides sellers with an interface to the product catalog and may also support payment, logistics or ordering, secure transactions, and so on (Tsalgatidou & Pitoura, 2001). In other words, 3PM sellers use Walmart Marketplace as a channel to sell their products, but they still control the products. On Walmart Marketplace, items will be shown as owned and shipped by individual brands while these sellers are also responsible for listing optimization, pricing, and fulfillment. For the Fulfillment by Walmart (FBW) seller, Walmart is listed as the seller and controls all digital aspects such as listing optimization, advertising, and pricing. In addition, these sellers use a combination of Walmart’s store distribution centers, fulfillment centers, and shipping fleets. Since Walmart is the leader in offline retail, unlike other online retailers such as Amazon and eBay, FBW sellers can be supported by additional offline services; for example, a customer who purchases products from an FBW seller can receive or return products at a nearby physical store. This may lead to an essential difference between the 3PM and FBW sellers in designing pricing strategies. In short, Walmart is one of the primary online retailers, and its mature offline retail experience makes it especially suitable to be employed in exploring the differences between 3PM and FBW sellers.
Because the issues discussed in this study are related to price changes over time, it was necessary for us to construct an empirical study. The research sample consequently includes many products’ historical prices. More than 50,000 products from both seller types are considered in the research sample based on certain data filtering conditions, which will be detailed in Section “Research Design.” The next question to be decided was the selection range of our sample period. We focused on the price discounts during the holiday season in 2018. The holiday season is generally considered to run from November to early January, incorporating Veterans Day, Thanksgiving, Black Friday, Small Business Saturday, Super Sunday, Cyber Monday, Christmas, and New Year. While product discounts may be applied at any time, for most retailers (consumers) in the United States, the holiday season at the end of each year is definitely the most important period for generating revenue (purchasing goods). Statista (2019b) points out that e-commerce retail revenues in the 2018 holiday season amounted to US$123.73 billion, showing a 16.6% growth rate. Due to the popularity of holiday season shopping, some studies have been conducted on consumer behavior in this period. For example, Swilley and Goldsmith (2013) explored the consumer attitudes and intentions toward shopping in the mall or online at Black Friday and Cyber Monday. Oh and Kwon (2009) showed that price promotions affect consumer spending across various channels during the holiday season. However, there has been no other academic literature focusing on changes in price discounts during the holiday season using large-scale real data, and we attempt to fill this gap. In addition, more and more retailers are encouraging 3PM sellers to use their platforms to attract customers, so we are interested in understanding the pricing strategies used by these 3PM sellers during the holiday season as compared with those used by online retail companies (i.e., FBM).
The main innovations of this study can be seen in relation to the following three points. First, measuring the discount level by means of empirical data remains a challenge. As calculating discounts always requires a baseline value, it is not easy to define the working concept of discount. In the past, most of the literature explored similar issues from the perspective of price dispersions (Baye et al., 2003; Pan et al., 2004; Ratchford et al., 2003). However, in our context, as we are discussing price discounts during the holiday season, the direct use of the initial price as the benchmark value should be precisely in line with the consumer’s actual feelings. Being given a selection of more than 50,000 products, we collected their prices every day from the Walmart.com website during the holiday season. This data set is considered sufficient for the relevant analysis. Moreover, from the consumer’s perspective, the average discount for all products may not be cognitively salient, while higher discounts on a small number of products are more attractive to him or her. This study proposes two discount level indicators to consider the effect of high discounts on those products.
Second, offering price discounts is one of the most effective sales tools for any business (Han et al., 2001; Lim et al., 2005; Srinivasan et al., 2004). However, to our knowledge, there has been no study investigating the discount level for third-party sellers on an online retailer’s website. As mentioned earlier, these third-party sellers are both partners and potential competitors for online retailers, and their pricing strategies are often not constrained by the online retailers. Therefore, understanding more about third-party seller pricing behavior can help online retailers further optimize their online retail businesses. However, consumers always want to find a better price. This study reveals that different types of sellers offer price discounts in different ways, which can help consumers make purchasing decisions. Third, we further conduct a dynamic analysis of the discount level. Specifically, based on the empirical results, we study the daily discount level during the holiday season for both types of sellers. The understanding achieved can further help in the making of timing decision for customers who want to purchase certain products or for online retailers who plan to offer certain price discounts.
This article is organized as follows: we proceed with a literature review of research on the holiday season, price discounts, and consumer (or retailer) behaviors. Section “Research Design” presents the research design, including a description of the data collection process. In addition, we demonstrate how price discounts are to be measured and define two discount-level indicators. In Section “Results,” we report on an empirical analysis using large-scale data collected from Walmart.com and follow this with an interpretation of the relevant results. Finally, we discuss the research findings and present management implications, research limitations, and future research directions.
Literature Review
The Holiday Season
The U.S. holiday season, also referred to as the Christmas shopping season, traditionally begins around Thanksgiving (the fourth Thursday in November) and ends right after New Year’s Eve. This is the strongest sales period of the year, and sales during this period are a major source of revenue for retailers in the United States. Any e-retailer that wants to maintain significant sales throughout the year must consider Black Friday and the subsequent holiday season as a decisive promotion period. For example, according to Statista’s statistical presentation of the United States retail e-commerce sales during the 2018 holiday season, Cyber Monday generated the highest amount of e-commerce sales, with a reported total of US$7.9 billion. In second place was Black Friday, with online sales of US$6.2 billion (Statista, 2019a). In anticipation of the holiday season, many e-retailers typically increase inventories, increase the number of their employees, prepare new promotions, extend their return policies, and set special shipping deadlines for guaranteed delivery to improve their customer-friendly service. Taken together, the combination of these factors creates a context for unequaled shopping activity which, although easily perceived, has received surprising little research attention.
There are several reasons to study the holiday season. First, there is a lack of research in the area of the holiday season although holiday shopping is the main source of income for many retailers. Indeed, the academic literature makes it possible to confirm the amount spent on holiday shopping promotions and suggests where the dollars should be placed (Oh & Kwon, 2009; Suri, 1996). Second, many countries have seasonal shopping festivals; examples include Black Friday in the United States and Singles’ Day in China. Research on these events can lead to the identification of cross-cultural similarities and differences in retailers’ (or consumers’) behavior (Zhu et al., 2017). Third, if retailers better understand how consumers are shopping on various retailers’ websites, they can develop and implement more effective marketing strategies for these customers during the peak holiday season. Each of these points highlights the potential value of research on the holiday season for retailers.
Price Discounts and Consumer (or Retailer) Behaviors
Previous studies have discussed price discounts from different perspectives. Some researchers have suggested economic rationales to explain why companies provide price promotions, for example, from the perspective of inherent demand uncertainty, when the seller is faced with uncertainty of demand and is motivated to engage in clearance sales (Lazear, 1986). Alternatively, from the perspective of inventory-cost shifting, Blattberg et al. (1981) show that promotions help to shift inventory holding costs from retailers to individual consumers because they encourage consumers to stockpile. However, researchers have shown that price promotion can be part of a mixed strategy in response to perceptions of market price differences among consumers (Varian, 1980). Finally, from the perspective of consumer stockpiling, Salop and Stiglitz (1982) argue that consumer stockpiling and incomplete information about prices can drive price promotion to the point of an equilibrium for competitive markets.
Price has a significant impact on the consumer’s buying behavior (Dickson & Sawyer, 1990; Erickson & Johansson, 1985; Lichtenstein et al., 1993) and consequently on the company’s sales and profits (Lim et al., 2005; Srinivasan et al., 2004). Therefore, price discounts are the most effective of all marketing mix elements, have taken the main share of the marketing budgets in most consumer-packaged categories (Han et al., 2001; Lim et al., 2005; Srinivasan et al., 2004), and have affected consumers’ choices almost ubiquitously (Alford & Biswas, 2002; Palazon et al., 2009). It has been found that the price promotion of individual products depends on the frequency and depth of the promotion, as well as the nature of the brand or the product transaction (Bell et al., 1999; Blattberg & Neslin, 1990). In addition, previous price promotion research has shown that a higher discount level (i.e., greater discount depth) was found to significantly reduce search intention and increase perception of the value of the deal and buying intention (Alford & Biswas, 2002; Lichtenstein & Bearden, 1989; Lichtenstein et al., 1991). Lee and Stoel (2014) showed that discount size increases customers’ perceived risk, which in turn affects their purchase intention. In general, when customers are faced with high discounts in the online market, they will have doubts about the quality of the products and the credibility of the retailers that provide these discounts; that is, they will associate high discounts with risks. Thus, when price discounts are unexpectedly large, customers may be skeptical about the reliability of the product and the retailer (Gwinner et al., 1998). Past studies have looked at the difference between online and offline price discounts. For example, Kukar-Kinney and Carlson (2015) have shown that discounts are generally highest when offered online. However, previous research did not examine the differences between specific seller types, such as between the discount context of 3PM sellers and the discount context of direct online retailers. It is particularly important to explore the differences in aggressive discounts across different seller types in online contexts, as previous research indicates a range of aggressive discounts from approximately 50% to 90% (Carlson & Kukar-Kinney, 2018; Eisenbeiss et al., 2015; Kukar-Kinney & Carlson 2015; Parsons et al., 2014). Previous studies have explored the effects of different discount levels through an experimental design approach, an approach that is unlikely to allow for careful analysis of different products at different price levels. In this study, based on daily price data collected for 54,162 products, we propose two discount level indicators and consider the impact of high discounts during the holiday season (see Section “Discount-Level Measurement” for details).
Research Design
Data Collection and Filtering Process
The purpose of this study was to compare the differences in price discounts between the 3PM and the FBW sellers on Walmart.com over time, and it was thus necessary to construct an empirical study. The advantage of this study is that the researcher can effectively determine price patterns over time, which makes possible a high degree of accuracy when changes are observed. Due to there being a large number of products, this study selected products from four common product categories as the research sample, namely beauty, electronics, home items, and toys. With the Walmart Open Application Programming Interface (https://developer.walmartlabs.com), we were able to easily determine several features of any product, for exmaple, sale prices, number of reviews, and stock status. In detail, the data collection process was as follows. It should be noted that each category considered in this research can be subdivided into hundreds of subcategories. Our research sample included the products listed in the first 100 pages of each subcategory. In other words, some less popular products in each subcategory were excluded from our sample. Following the above sample selection rule, we used web crawler technology to collect all of the corresponding product identifications (PIDs) in August 2018. To rule out the impact of the new product’s selling price strategy on the results of this study, we waited for 2 months before beginning the formal data collection. Then, using the Walmart Open API with these PIDs, we carried out data collection once every 24 hr from November 4, 2018, to January 6, 2019. It is worthwhile to note that this period covered several important holiday seasons, including Veterans’ Day, Black Friday, Cyber Monday, Christmas, and New Year.
Several data filtering rules were adopted in this study. First, to ensure that the products in the sample could indeed be purchased by consumers, the product’s stock status had to be presented as available at least 1 day during the sample period. In addition, any product with zero reviews on November 4, 2018 was also deleted, that is, products in our sample had been purchased at least once on Walmart.com. Second, since a few products had unusually high prices or prices of zero, we required the product price to be greater than zero and less than US$3,000. Any product whose price did not fall into that price range in the full sample period was excluded from the sample. Finally, after deleting the products with incomplete information including seller type, category, and price, we included 54,162 products in the empirical study.
Price Discounts Measurement
In this section, we explain the means by which the price discounts were measured. First, unless otherwise stated in the text, the price refers to the actual sales price listed on the website. Although some product listings may present their official prices at the same time, we believe that the actual sales price is more valuable for making purchasing decisions. For a given product, this study sets the first observed price as a benchmark. When the subsequent price was below the benchmark, we conclude the seller was offering a discount. We should further explain the reason for the above definition of discount. In general, the product price is dynamic over time, so it is always necessary to use a benchmark value to measure its discount. One possible method is to use the official price as the benchmark and calculate the price discount by the difference between the official and sale prices, but for many products, the former is not observable. This study takes the perspective of consumer purchasing decisions. Suppose that when consumers are considering buying a product, they have observed the related price in advance and formed a mental benchmark. If the price drops lower than this benchmark, the new price can be regarded as a discount by the consumer.
Formally, we denote the price of product i at time t as

For example, supposing the prices of a product for five consecutive days to be US$10, US$9, US$9, US$7, and US$8, the benchmark in this case is US$10. Then the discounts for the following four days are 10%, 10%, 30%, and 20%, respectively. In addition, it is clear that the maximum discount is 30%.
Discount-Level Measurement
One straightforward approach to comparing the discount levels of different types of products is to use the average discount. However, according to Cavallo (2017), up to 72% of products have identical price levels at one time, which leads to the average discount being highly influenced by the percentage of products that are not discounted. More importantly, from the customer’s point of view, it makes more sense to have a larger discount on just some products than a small discount on most products. For example, among 10 products with two promotions, one with a 10% discount on all products and another with a 50% discount on only two special products, even if the average discount is the same in both cases, the customer may feel that the latter discount is more significant than the former. To accurately reflect the impact of a few highly discounted products in the overall market, this study proposes two new indicators to measure the level of product discounts.
The first indicator is related to the p-quantile of a specific distribution with 0 < p < 1. Given a finite sample with N observations, the p-quantile is defined as the x-value in this distribution, which entails that p * N observations will show a value less than x. Accordingly, we denote DL1(q) as the (1 − q)-quantile of

Differences in DL1 between 3PM and FBW sellers for all products.

Differences in DL2 between 3PM and FBW sellers for all products.
Results
Sample Characteristics
Given the data collection and filtering process described in Section “Data collection and filtering process,” our sample contains 54,162 products from four different product categories, that is, beauty, electronics, home items, and toys. By recording the price of each product at a fixed time per day from November 4, 2018, to January 6, 2019, we obtained 64 observation prices for each product. Consequently, we had a cross-sectional and time series data set, specifically, balanced panel data with 54,162 members and 64 periods, in which the number of observations was 3,466,368. Since the first observation price for each product was regarded as the benchmark in this study, we specify the descriptive statistics of prices on November 4, 2018, in Table 1. The average price of all products was US$52.21, and the price range was US$0.01 to US$2949. Next, we explore the differences in sample characteristics among various seller types and various product categories.
Descriptive Statistics.

Note. N refers to the number of observations belonging to that category. S.D. is an abbreviation of “standard deviation.” FBW = Fulfilled by Walmart.
First, we divided our sample by the seller types. Hence, the sample sizes of the 3PM and the FBW sellers were 23,148 and 31,014, respectively. The price ranges of both were similar, but the average price of the 3PM sellers was clearly higher than that of the FBW sellers. In addition, the 3PM sellers also showed a larger standard deviation than the FBW sellers. Thus, in general, compared with those sold by FBW sellers, products sold by 3PM sellers had the following characteristics: they were fewer in number, they had higher average selling prices, and they showed larger price variations. Second, the sample was divided into four product categories. It should be noted that electronic product category primarily includes home appliances, for example, refrigerators and televisions, but excludes cell phones. The number of products in each category exceeds 8,200, with the largest number of products in the home items category. Due to the characteristics of products in various categories, there are considerable differences among the means or the standard deviations of prices for different categories. Specifically, both the average and standard deviation of electronic (beauty) product prices are the largest (smallest) among the four categories. Although the average prices of home and toy products are similar, the variability of the latter is much greater than that of the former. To sum up, after inspecting the above characteristics, we did not find any oddness, so we can conclude the data are well-collected. In the following discussion, we explore the influence of seller type on discounts based on the data sample.
Comparisons of 3PM and FBW
To investigate the discount levels of products, we first calculate
Comparisons of Discount Levels Between 3PM and FBW.

Note. ***, **, and * denote coefficient significance at 0.1%, 1%, and 5%, respectively. FBW = Fulfilled by Walmart.
The indicator DL1(q) is a discount threshold with a parameter q, which means the number of products with a discount exceeding the threshold DL1(q) is 100 * q% of all products. As shown in Table 2, among all products, 10% have a discount of more than 25%. When we further consider the top 1% of the discounted products, we find that their discounts are more than 56%. Then, we discuss the differences between the 3PM and the FBW sellers. As DL1 is essentially a quantile of discount distribution, we can use the two-sample rank test (Johnson et al., 1987) to verify whether two quantiles are equal or not. When q = 0.1, the DL1 for the FBW sellers is significantly greater than that of the 3PM sellers (p-value < 0.001). Nevertheless, when q becomes smaller, the result is reversed. For example, in terms of discounts, the top 1% of 3PM sellers all provide a discount greater than 65%; for the discount of the FBW sellers is only larger than 50%. Based on the two-sample rank test, when q = 0.025 or 0.010, we can conclude that the discount threshold for the 3PM sellers is significantly greater than that of the FBW sellers (p-value < 0.001). To further explore the relationship between DL1 and the seller type, we plot the DL1 values for both seller types in Figure 1, given q from 0.10 to 0.01. We can see that as q becomes smaller, the difference in DL1 between the 3PM and the FBW sellers changes from negative to positive. This result also supports the findings related to DL1 in Table 2.
Similar to DL1, indicator DL2 also focuses on high discount products and is used to measure discount levels. Specifically, DL2(d) expresses the percentage of the product that has a discount of more than a discount threshold d. Among all products, 24.5% have a discount of more than 10%. Moreover, products that offer more than 50% off comprise 1.59%. To examine the difference in DL2 between the 3PM and FBW sellers, we adopted the two population proportions test to examine statistical significance. In brief, the outcomes of DL2 are consistent with those DL1. When the discount threshold is relatively small, that is, d = 0.1 to 0.3, the FBW sellers have a greater DL2, but when the discount threshold is relatively larger, that is, d = 0.4 and 0.5, the 3PM sellers have a greater DL2. All of the above results are statistically significant (p-value < 0.001). In addition, we also examined in detail the differences in DL2 between the two seller types. Figure 2 shows that when d becomes larger, the difference in DL2 between the 3PM and the FBW sellers also changes from negative to positive, a result which is consistent with the findings illustrated in Figure 1.
Discounts in Various Product Categories
In the previous discussion, we explored the question of whether the discounts offered by different seller types during the holiday season had the same characteristics. In this section, we further subdivide the products into four categories to explore not only the differences in the discounts among various categories but also how the discount is affected by the seller type. All results are reported in Table 3 and can be summarized in three points as follows. First, we explore the outcomes associated with average discounts. The average discount on beauty and toys is quite different, at 4.63% and 10.19%, respectively. Moreover, compared with 3PM sellers, the average discount for FBW sellers is significantly greater in the electronics, home items, and toys categories. Second, from the perspective of DL1 or DL2, beauty products have the lowest discount level, while toy products have the highest one, which is consistent with the viewpoint from the perspective of the average discount. Third, 3PM sellers are more inclined to offer a particularly high discount on a few products. For instance, 5.96% of 3PM sellers are willing to offer more than 50% discounts on toys products, but only 2.24% of FBW sellers do the same. Specifically, for DL1(0.01) as well as for DL2(0.50), 3PM sellers offer a significantly higher discount level compared with FBW sellers (p-value < 0.001).
Comparisons of Discount Levels Between 3PM and FBW in Various Product Categories.
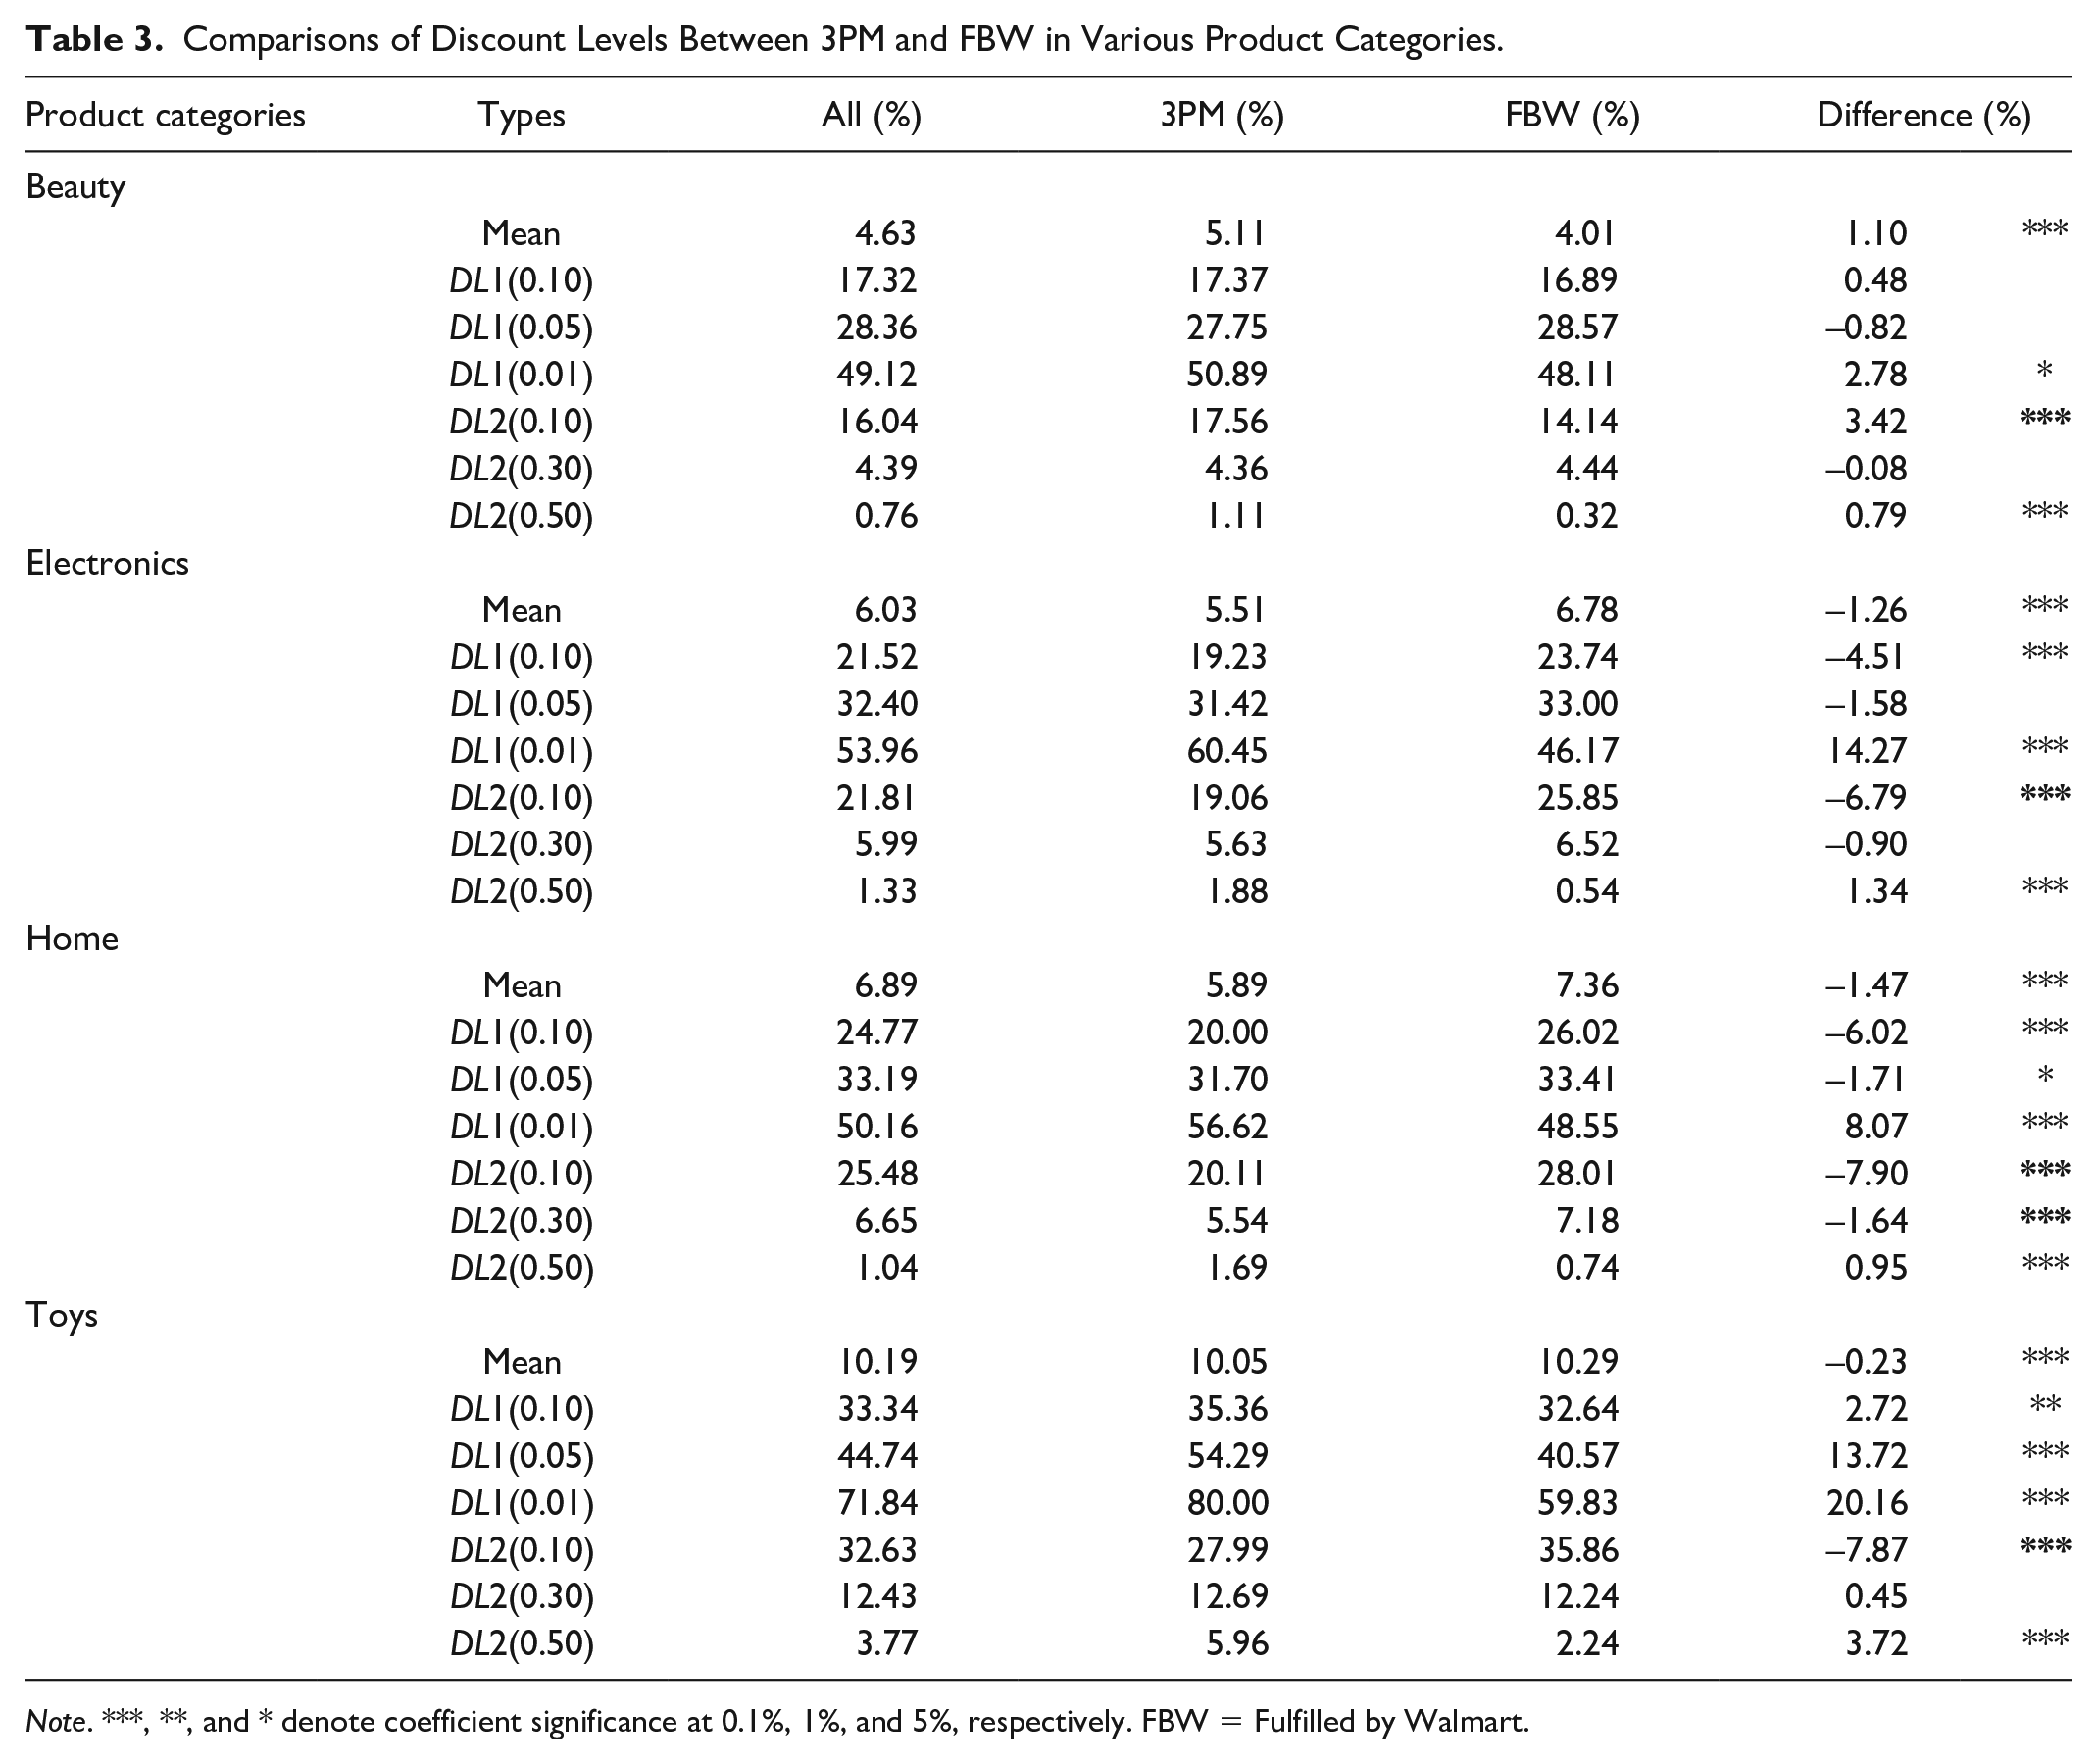
Note. ***, **, and * denote coefficient significance at 0.1%, 1%, and 5%, respectively. FBW = Fulfilled by Walmart.
Dynamics Analysis for Discounts
It is worthwhile to note that the discount discussed previously refers to the maximum discount for product i,

Dynamics analysis for DL1(0.01, t) during the sample period.

Dynamics analysis for DL2(0.5, t) during the sample period.
Conclusion
Discussion and Managerial Implications
More and more retailers, such as Walmart Marketplace, Amazon Marketplace, Sears Marketplace, and so on, are adopting a dual-format model. In addition to being traditional merchants (buying and reselling goods), these retailers are providing a platform for 3PM sellers to enter and compete for the same customers. The purpose of this study is to compare the differences in price discounts between 3PM sellers and FBW sellers on Walmart’s website during the holiday season. Based on large-scale panel data with 54,162 products during 64 periods, we arrive at three main findings. First, the average maximum discount for the holiday season is 6.99%; the four categories of products with the highest discounts from high to low are toys (10.19%), home items (6.89%), electronics (6.03%), and beauty (4.63%). Among the high-discount products, 1% of products were offered at more than 56.41% off, while 1.59% of products were offered at over 50% off. Second, the average maximum discount for 3PM sellers (6.43%) is significantly smaller than that for FBW sellers (7.40%). However, we found that 3PM sellers are more likely to offer particularly high discounts on a few products. For example, 2.42% of 3PM sellers offer a discount of greater than 50%, but only 0.97% of FBW sellers do this. Moreover, we also conclude these results are robust for four product category subsamples. Third, if we divide the holiday season roughly into three subperiods, that is, from Veterans’ Day to before Black Friday, from Black Friday to Christmas, and after Christmas to the end of the New Year, the trend of the discount level for different seller types varies slightly with time in terms of the DL1 or DL2 indicators. For 3PM sellers, from Veterans’ Day to before Black Friday, the discount level rises sharply and then continues to increase at a lower rate, while it remains stable during the third subperiod. For FBW sellers, the trend of the discount level in the first two subperiods is similar to that of 3PM sellers, but their discount level decreases slightly after Christmas to the end of the New Year.
Based on the empirical results described above, we suggest certain managerial implications for retailers and consumers. From the perspective of retailers, online retailer managers should be aware that 3PM sellers are their potential competitors. In particular, these sellers are more likely to offer very attractive price promotions to increase sales and grab market share during the holiday season. However, according to Lee and Stoel (2014), when customers encounter high discounts in online marketplaces, they become skeptical about the quality of the products and the credibility of the retailers offering these discounts, and they associate high discounts with risk. Therefore, regardless of whether sellers are 3PM or FBW sellers, when adopting a discount strategy, they should be aware that when price discounts are unexpectedly large, customers may be skeptical about the reliability of the product and the retailer (Gwinner et al., 1998). In addition, several studies have reported that dual-channel retailers tend to charge identical prices in online and offline stores (Cavallo, 2017; Wolk & Ebling, 2010). For example, Cavallo (2017) collected data from 56 dual-channel retailers in 10 countries and reported that 72% of the retailers charged the same prices online and offline and priced their products similarly. Thus, for some retailers like Walmart, which generate most of their revenues from offline retail, how to coordinate online and offline product prices for optimizing company profits becomes a crucial issue since third-party sellers are beyond their control and can arbitrarily offer a competitive price. From the perspective of consumers, our results imply some useful suggestions for making better purchasing decisions. First, the average maximum discount is less than 7%, which suggests that discounts offered by most sellers are still limited, even during the holiday season. Second, consumers can find more high-discount products offered by third-party sellers, especially for toys. Third, even if Black Friday is the most popular shopping day, it may be worthwhile to wait for more price promotion activities before Christmas. However, price is not the only consideration in consumers’ buying decisions, and sellers can use other strategies to increase sales. For example, personalized product recommendations or personalized search filters can influence consumer decisions and even sellers and retail markets (Dinerstein et al., 2018; Jiang & Zou, 2020; Yang & Gao, 2017). With reductions in consumer search costs, Walmart should be able to reduce referral fees for 3PM sellers if their elasticity of demand increases significantly, potentially producing a 3-win outcome for Walmart, 3PM sellers, and consumers (Jiang & Zou, 2020).
Limitations and Directions for Future Research
There are some limitations to this study and also suggest potential directions for future studies. First, this study only considers the daily prices of the four product categories in the 2018 holiday season. The data collection process is time- and labor-consuming, preventing us from collecting data on more product categories over a longer period of time. Many studies have shown differences in the degree of price dispersion across product categories (Pan et al., 2004; Shankar & Bolton, 2004). Future studies could obtain price data over a longer period of time (e.g., 1 year) and explore the relationship between price discounts over different times and using different product categories to provide a more comprehensive understanding of the price discount phenomenon. Second, this study is limited to third-party sellers on the Walmart website. As we have previously emphasized, Walmart’s robust offline retail system provides more comprehensive support for FBW sellers, so Walmart’s 3PM sellers are in a relatively weak position. This may make them more motivated to carry out price promotions, but our sample cannot be used to verify this argument. Future research can further compare third-party sellers on Walmart’s website and other online retail platforms, which may help third-party sellers choose the optimal online retail platform. In addition, future research that collects and uses sales data to explore the relationship between price discounts and sales could also lead to a fuller understanding of the impact of different product categories on third-party sellers’ performance at a variety of price discount levels.
Footnotes
Appendix A
Appendix B
Acknowledgements
The authors thank the editor and four anonymous referees for very helpful comments and suggestions that greatly improved the paper. The authors are listed in alphabetical order and contributed equally to the manuscript.
Declaration of Conflicting Interests
The author(s) declared no potential conflicts of interest with respect to the research, authorship, and/or publication of this article.
Funding
The author(s) disclosed receipt of the following financial support for the research, authorship, and/or publication of this article: This work was supported by the MOE Layout foundation of Humanities and Social Sciences (20YJAZH102) and MOE Project of Humanities and Social Sciences (20YJCZH199).