
Abstract
This study examines whether and how the research and development (R&D) tax deduction policies affect corporate industrial chain linkages. Using data from Chinese A-share listed companies covering 2007 to 2022, empirical research was conducted using the difference-in-differences (DID) method. The results indicate that the R&D tax deduction policy positively impacts corporate industrial chain linkages. Mechanism tests show that the policy promotes corporate industrial chain linkages by reducing internal production and external transaction costs. Heterogeneity analysis reveals that the policy’s effect on enhancing industrial chain linkages is more pronounced for large-scale, state-owned, mature, and manufacturing enterprises. This study further finds that the business environment significantly moderates the relationship between R&D tax deduction policies and corporate industrial chain linkages.
Introduction
In the context of global supply chain restructuring, corporate innovation has become essential for enhancing the modernisation and stability of industrial and supply chains (Guo et al., 2023). A country’s ability to autonomously control its industrial and supply chains improves its competitiveness within the global value chain, strengthens performance, and enhances its capacity to manage uncertainties (Ersahin et al., 2024). However, owing to the risks and externalities involved in research and development (R&D), firms often invest less than their socially optimal level in innovation (Negassi & Sattin, 2019). To address this issue, governments have introduced various measures to encourage R&D investment, with the R&D tax deduction policy widely regarded as an effective tool for promoting corporate innovation (Akcigit et al., 2022). These incentives highlight the strategic role of tax policy in supporting corporate innovation while enhancing the resilience and modernisation of industrial supply chains.
Previous research has explored factors for supply chain adjustments, including foreign trade, digital economy, and fiscal policies. Studies have shown that against the backdrop of Sino-American trade frictions, trade restrictions lead U.S. firms to maintain indirect relations with China through third countries (Luo & Wang, 2025). The digital economy is critical in reshaping industrial cooperation and fostering new global models (P. Li & Zhao, 2024; Sundarakani et al., 2024). Fiscal policies such as value-added tax (VAT) reductions, export rebates, and R&D tax incentives have strengthened the autonomy and resilience of industrial supply chains (Shafiee & Honarvar, 2023; Yang et al., 2025).
However, our understanding of the R&D deduction policy is further limited by a disproportionate focus on the direct influence of the deduction policy on technology advancement while overlooking its implications for supply chain management. Regarding the research and development (R&D) super-deduction policy, most scholars study its impact on corporate R&D investment and contend that it can reduce corporate R&D costs, increase corporate cash flow, and ultimately increase corporate R&D innovation investment. An R&D super-deduction policy can enhance corporate R&D investment and innovation levels, and its incentive effects are more pronounced for private enterprises and the manufacturing sector (Zhuoma et al., 2024). Some scholars have differing views on this topic. He et al. (2023) examine the relationship between tax incentives and abnormal R&D expenditures among Chinese A-share listed companies (2007–2018), finding that R&D tax policies prompted corporate manipulation of R&D expenditures for tax avoidance, leading to abnormal growth. Tang and Liu (2024) reveal that the R&D super-deduction policy mitigates the inhibitory effects of financing constraints on cost markups, enhancing total factor productivity (Song & Wang, 2023) and boosting corporate employment levels (Hu et al., 2025). While prior research has analysed factors influencing industrial chain linkages and the impact of R&D super-deduction policies on corporate performance, the effect of tax reforms, particularly on industrial chain linkages, remains understudied.
To address this, we use 24,030 firm-year observations from Chinese enterprises, propose a theoretical framework, and investigate how tax reforms, especially the R&D super-deduction policy, influence industrial chain linkages. As China deepens its innovation-driven development strategy, positioning innovation as the cornerstone of modernisation, the R&D super-deduction policy plays a crucial role in enhancing cash flow, encouraging investment, and stabilising supply chains.
Our study contributes to the literature in three ways. First, it expands existing research on R&D tax policies by focusing on the causal relationship between R&D tax deductions and corporate supply chain linkages. While previous research primarily examined the effects of R&D tax deductions on corporate innovation investment, human capital, and digital transformation (Chen & Yang, 2019; Jacobs, 2021; J. Li et al., 2023), this study fills a critical gap by exploring how policy influences corporate supply chain linkages. This study sheds new light on the broader economic and industrial impacts of R&D tax policies, offering a fresh perspective on how tax incentives can enhance supply chain integration and resilience.
Second, this study offers new insights into how R&D tax deductions influence supply chain linkages by empirically connecting tax incentives to reduced production and transaction costs. While most research on R&D tax policies focuses on firm-level innovation outcomes (Qian et al., 2023), few explore their effects on supply chain performance and stability. By developing and testing a mathematical model, we show that R&D tax deductions drive technological innovation and enhance supply chain efficiency and resilience. This provides valuable empirical evidence for policymakers to design tax policies that strengthen innovation and supply chain security, enriching the literature on fiscal policies and industrial development.
Third, this study highlights the critical yet underexplored role of R&D tax deductions in modernising and stabilising industrial supply chains. While prior research emphasises external factors like foreign trade and digital transformation (Sundarakani et al., 2024), we demonstrate that tax policies are equally crucial for enhancing supply chain autonomy and resilience. Using China’s progressive R&D tax reforms as a quasi-natural experiment, this study provides a robust framework to assess the long-term economic impacts of tax policy on supply chain dynamics. These findings offer practical guidance for designing forward-looking tax policies that promote innovation, supply chain modernisation, and industrial sustainability.
Hypothesis Development
The industrial chain consists of vertical and horizontal labour divisions. High external transaction costs drive firms toward vertical integration, while lower external costs encourage market-based specialisation. A firm’s boundaries are determined by the balance between internal production costs and external transaction costs (Sathiya et al., 2021). An R&D tax deduction policy may trigger changes in internal production and external transaction costs, resulting in the contraction or expansion of a firm’s boundaries. Drawing on Sundarakani et al. (2024), this study establishes a mathematical economic model to explore the relationship between R&D tax deduction policies, internal production costs, external transaction costs, and corporate supply chain linkages. This study proposes the corresponding research hypotheses.
This study considers a representative firm that produces final product y, which requires the input of N intermediate products along the production chain. Each intermediate product i is produced by a firm with a comparative advantage, where the demand for each intermediate product i is Xi, and the intermediate products are continuous i

where ρ represents the elasticity of substitution and

When opting for in-house production, a firm’s production costs primarily depend on its technological level (T) and factor endowments (F). On the one hand, vertical division of labour in the supply chain implies that the firm, based on its existing business, expands either upstream (e.g. raw material suppliers) or downstream (e.g. customers), leading to integrated operations involving supply, production, or distribution. However, the firm must pay higher supervision costs to mitigate principal-agent issues. Given that the branches of a firm are not independent entities, an integrated firm cannot effectively use market mechanisms to incentivise its branches, giving rise to agency problems between the branches and corporate headquarters, such as shirking and self-interest seeking (Ozbas & Scharfstein, 2010). As the degree of vertical integration increases, a firm’s internal structure becomes more complex, the number of branches requiring coordination increases, and the firm’s internal control costs increase accordingly.
Correspondingly, an R&D tax deduction policy may reduce firms’ internal production costs in two ways: First, the policy stipulates that the operating and maintenance expenses, rental fees, and depreciation costs of equipment used in R&D activities can be deducted as direct input costs. This stipulation encourages firms to increase their investments in advanced machinery and equipment, accelerate product and technological upgrades, enhance innovation efficiency, and contribute to improvements in total factor productivity (TFP). Second, the R&D tax deduction policy incentivises firms to invest in improving their information systems. By establishing digital platforms for internal management and financial control, firms can achieve greater transparency, helping to reduce speculative behaviour among branch offices, thereby lowering the supervisory costs associated with vertical integration and efficiency losses from agency problems.
In summary, R&D tax deductions enhance TFP, reduce supervisory costs, lower internal production costs, and promote vertical integration. This fosters close cooperation between upstream and downstream supply chain enterprises, with upstream firms specialising in raw materials or components and downstream firms handling assembly, marketing, and other stages. This model improves information exchange, resource sharing, and interdependence across supply chain segments, strengthening linkages.
When purchasing products externally, the firm incurs three external transaction costs: (1) a firm incurs search costs when finding suitable trading partners. Once a trading partner has been identified, the firm must pay a series of negotiation and bargaining costs related to drafting and signing contracts. (2) External purchasing of products requires sufficient financial resources involving financing costs. (3) a firm’s production is closely tied to contract execution. If the supplier breaches the contract, the firm may experience a disruption in the production chain owing to raw material shortages. Similarly, if the firm defaults, the supplier may face operational challenges, such as inventory build-up, as they struggle to find another suitable trading partner in the short term. These are important aspects of external transaction costs.
The R&D tax deduction policy reduces firms’ external transaction costs in three key ways. First, it encourages greater R&D investment, enhancing innovation and competitiveness. This improved market position makes it easier for firms to find partners and negotiate terms, reducing search and contracting costs. Second, per efficient market theory and signalling mechanisms, the policy alleviates financing constraints by reducing information asymmetry and increasing financial transparency. Firms leveraging R&D tax deductions send positive signals to the market, attracting investments and benefiting from stricter financial scrutiny, which further enhances transparency and funding access. Third, the policy helps match firms with high-quality partners by increasing reputational risks for defaults, thereby reducing contract breaches.
These reductions in transaction costs foster horizontal specialisation, allowing firms to focus on core products or services, enhancing efficiency and quality through specialisation. Collaboration within similar or adjacent production stages strengthens supply chain integration. Whether through vertical or horizontal specialisation, the policy optimizes resource allocation, reduces costs, improves TFP, and enhances industrial chain linkages.
When external environments or market demands shift, firms mitigate risks by diversifying suppliers or sales channels, reducing reliance on single sources and strengthening industrial chain linkages. Amid global industrial chain restructuring, firms seek trade with industries of higher upstreamness to expand supply chains, ensuring autonomy and control. Higher upstreamness signifies greater reliance on other industrial sectors, resulting in stronger linkages and profitability.
To stabilize supply chains and mitigate risks, firms also strengthen ties with existing partners, forming a community of shared interests. Trading with industries of higher upstreamness enhances competitiveness, market share, and profitability. Over time, increasing trade with upstream industries and reducing trade with downstream ones bolsters overall industrial chain linkages, driving industrial chain upgrades and sustainability.
An enterprise production aims to maximise profits and minimise total costs. Therefore, minimising only unit production costs is necessary.


By solving the Lagrangian functions in Equations 3 and 4, the minimised unit production cost function is derived as follows:

Taking the first-order derivative of Equation 5, the optimal boundary E between in-house products and intermediate goods is determined, thereby minimising the firm’s unit cost.

The following solution is thus obtained:

With the continued implementation of the R&D super-deduction policy, the internal production and external transaction costs of firms will decline to varying degrees, denoted as
Research Design
Data
This study utilises data from Chinese A-share listed companies on the Shanghai and Shenzhen stock exchanges from 2007 to 2022, along with data from the national input-output tables as the research sample. The process of sample selection and data preparation is as follows: (1) companies labelled as ST, *ST, and PT due to abnormal operations are excluded; (2) financial and insurance companies are omitted from the sample; (3) firms with missing or inaccurate financial data, such as total assets, total liabilities, operating income, and total profit, are excluded; and (4) a 1% winsorisation is applied to all continuous variables to mitigate the effect of outliers. The data for listed companies are sourced from CSMAR, and the input-output table data come from the Chinese Input-Output Association.
Variables
Dependent Variable: Linkage
In the context of deepening the global division of labour, technology spillover and diffusion effects are transmitted across industries and firms. Therefore, enhancing industrial chain integration and encouraging technologically advanced firms to extend and expand along both ends of the value chain is crucial for strengthening industrial and supply chains’ autonomy, control, and governance capabilities. The existing research indicates three main methods for measuring industrial chain integration. The first method is the measurement from the perspective of domestic and international value composition or trade value-added using the World Input-Output Table or the Chinese Input-Output Table (Koopman et al., 2012, 2014). The second involves calculating the foreign value-added rates of firm exports using micro-level firm or product data (Handley & Limão, 2017; Kee & Tang, 2016; Ludema et al., 2021; Vrh, 2019). The third method involves constructing a comprehensive indicator of firms’ industrial chain integration by combining micro-level firm data with input-output tables (Acemoglu et al., 2010; Nocke & Thanassoulis, 2014). Drawing on previous studies and considering data availability, this study combines firms’ value-added with input-output tables to construct a measurement indicator reflecting firms’ overall industrial chain integration.
First, this paper uses ‘product of adjusted value-added to sales (A_VAS) and the industry upstreamness’ as the measurement indicator for firm industrial chain integration (Linkage_up). Economically, the higher the industry upstreamness, the farther the industry is from final demand, meaning that producing one unit of the product for final demand requires more support from other sectors, indicating a higher degree of industrial linkage. Generally, firms at the lower end of the value chain capture a smaller share of value added in market transactions because of their lower technological content and higher proportion of intermediate inputs. Conversely, a higher value-added share implies that a firm is positioned at the higher end of the value chain with a broader range of linked firms and industries, thus reflecting a greater degree of industrial chain integration. Combining these two factors comprehensively reflects a firm’s overall degree of industrial chain integration. Specifically, referring to the research of Antràs et al. (2012), the upstreamness is calculated using the 2018 Chinese input-output table to determine the weighted average distance of each industry’s products from final demand. Following Koopman et al. (2012), the adjusted value-added sourcing (VAS) (A_VAS) score was calculated as follows:

In Equation 8, the value added equals the difference between sales revenue and purchase cost. Net assets are equal to total assets minus total liabilities and the average return on assets is the average net asset return across industries for each year. Samples with A_VAS score outside the (0–1] range are excluded. Given that the value of industry upstreamness is greater than or equal to 1, A_VAS falls within the (0, 1] range. Therefore, the larger the product of A_VAS and industry upstreamness, the higher the degree of a firm’s industrial chain integration.
Secondly, this paper uses the ‘product of adjusted value-added to sales (A_VAS) and the number of production stages in the industry’ as the measurement indicator for firm industrial chain integration (Linkage_pr). The number of production stages in the literature is also referred to as production fragmentation, vertical specialisation, or multistage production. It measures the number of stages involved in the production process of a certain industry’s product, with the value representing the firms’ weighted participation in the industry’s production sequence. The longer the production stages, the more intermediate production processes the industry’s product is involved in and the further the product is from the final consumption demand. This concept is similar to the upstreamness indicator calculated by Antràs et al. (2012), which measures the weighted average distance between a certain industry’s product and final consumption demand. However, these two methods differ in their specific calculation methods; the former uses an iterative method to calculate upstreamness, whereas the latter uses a recursive method to measure the distance to the final demand. Thus, this concept provides an alternative approach to test the core conclusions of this study by replacing industry upstreamness with the number of production stages and reconstructing a firm’s industrial chain integration indicator.
Independent Variable: R&D Super-Deduction Policy (Treat × Post)
Treat is an industry dummy variable. If a firm belongs to an industry on the negative list, meaning that it is not affected by the R&D super-deduction policy, Treat is assigned the value of zero; otherwise, it is assigned the value of one. Post represents a policy implementation year dummy variable with a 0 for years before 2017 and 1 for 2017 and beyond. Industries on the negative list include: tobacco manufacturing, accommodation and food services, wholesale and retail trade, real estate, leasing and business services, and entertainment.
Control Variable
To mitigate the impact of omitted variables on the regression results, following Guo et al. (2023), the following control variables are included in the baseline regression model: lnsize, debt, profit, cost, tobin_q, roe, and lnage. Additionally, the following firm governance structure variables are included: top1, double, and audit. The definitions of these variables are listed in Table 1.
Definition of Main Variables.

Model
In 2017, the State Administration of Taxation issued the ‘Announcement of the State Administration of Taxation on Issues Related to the Scope of Pre-tax Deduction of R&D Expenses’, which clarified the scope and operational details of R&D expenses, providing clearer guidance for enterprises. Therefore, this study considers the 2017 R&D super-deduction policy reform as a quasi-natural experiment and employs the difference-in-differences (DID) method to examine its impact on firms’ industrial chain integration. The baseline regression model is as follows:

where i represents the firm, and t represents the year. The dependent variable Linkageit represents a firm’s industrial chain integration level measured by two specific indicators: Linkage_up and Linkage_pr. Treat is an industry dummy variable that equals zero if the firm belongs to an industry on the negative list and one otherwise. Post is a policy implementation dummy variable that equals zero for the years before 2017 and one for 2017 and beyond. Controlsit denotes a set of control variables, μi represents firm fixed effects, λt represents year fixed effects, and εit is the random error term. Standard errors are clustered at the firm level to mitigate the impact of firm-level autocorrelation on the empirical results.
Identification Strategy
To incentivise small- and medium-sized enterprises (SMEs) to increase investment in research and development (R&D) and support technological innovation, special policies for technology-oriented SMEs were introduced in 2017. According to the announcement of the State Taxation Administration on issues concerning the scope of pre-tax additional deductions for R&D expenses (Announcement No. 40 of the State Taxation Administration, 2017), technology-oriented SMEs were granted an increased pre-tax additional deduction rate of 75% for their R&D expenses from 1 January 2017 to 31 December 2019 when the expenses did not result in intangible assets or 175% of the cost of intangible assets. This adjustment further enhances the incentive effect of the policy. Document Cai Shui [2017] No. 34 provides a quasi-natural experiment to understand the impact of additional R&D deduction policies on enterprises’ interindustry linkages. To identify the causal relationship between the additional R&D deduction policy and the inter-industry linkages of enterprises, we constructed a DID model, with enterprises on the negative list serving as the control group and the remaining enterprises as the treatment group.
Specifically, we selected the following six industries as a negative list: tobacco manufacturing, accommodation and catering services, wholesale and retail trade, real estate, leasing and business services, and entertainment. Therefore, if a company belongs to one of these six industries, it is considered unaffected by the R&D additional deduction policy and is classified into the control group; thus, Treat equals zero.
Additionally, we set the dummy variable Post to 1 for 2017 and onwards and 0 for before 2017. The coefficient of the interaction term between Treat and Post reflects the impact of the additional R&D deduction policy. In particular, the DID term allows us to examine the impact on the interindustry linkages of enterprises between industries that enjoy the additional R&D deduction policy and those that do not before and after the policy implementation. If the coefficient α1 is significantly greater than 0, then the R&D additional deduction policy undoubtedly promotes the inter-industry linkages of enterprises.
Descriptive Statistics
Table 2 reports the descriptive statistics of the main variables. As shown in Table 2, the mean value of firm industrial chain integration (Linkage_up) is 2.1870, with a standard deviation of 1.0844, and the mean value of firm industrial chain integration (Linkage_pr) is 2.5857, with a standard deviation of 1.5883, indicating significant differences in industrial chain integration across firms. The mean of the treatment dummy variable (Treat) is 0.9228, suggesting that 92.28% of the firms in the sample do not belong to industries on the negative list. The mean of the time dummy variable (Post) is 0.4839, indicating that 48.39% of the sample pertains to the period after 2017. Other control variables show noticeable differences between samples, demonstrating a good sample distribution.
Descriptive Statistics.

Results
Parallel Trends
A key requirement for using the Difference-in-Differences (DID) model is to pass the parallel trend test, which confirms that the treatment and control groups follow similar trends before policy implementation. In this study, we test whether firms’ industrial chain integration satisfies this assumption, with 2017 as the year of policy impact. If the estimated coefficients for the pre-policy period are not significant, this suggests that the treatment and control groups have consistent development trends, validating the parallel trend assumption. Conversely, significant coefficients would indicate that this assumption was not met.
The results of the parallel-trend tests are shown in Figure 1. For simplicity, 2014 and earlier were grouped as pre_3 and 2020 and later as post_3. Thus, the graph shows only three periods: before and after policy implementation. As depicted in Figure 1, regardless of whether Linkage_up or Linkage_pr is used as the dependent variable, the coefficients of pre_3 to pre_1 are insignificant, indicating no difference between the treatment and control groups before the R&D super-deduction policy. However, the coefficients for post_1 to post_3 are significantly positive, suggesting notable differences between the groups after implementing the policy. These results confirm that the parallel trend assumption holds in this study.

Parallel trend graph. (a) Linkage_up. (b) Linkage_pr.
Baseline Results
Table 3 reports the benchmark regression results for the impact of the additional R&D deduction policy on the linkages of enterprises in the industrial chain. Columns (1) to (3) have Linkage_up as the dependent variable, with only enterprise fixed effects and year fixed effects controlled for in Column (1); Columns (2) and (3) include enterprise financial-level control variables and enterprise governance structure-level control variables, respectively. Similarly, Columns (4) to (6) in Table 3 use Linkage_pr as the dependent variable.
The Impact of the R&D Super-Deduction on Firms’ Industrial Chain Integration.

Note. Cluster robust standard errors are in parentheses.
, **, and * Indicate significant at the 1%, 5%, and 10% levels, respectively.
As shown In Columns (1) to (3), the dependent variable is Linkage_up, and the coefficient estimate for Treat × Post is significantly positive at the 1% level. After including the control variables and fixed effects, the coefficient estimate was 0.1629, and the adjusted R-squared was .7865. Thus, after implementing the R&D tax deduction policy, the enterprise’s industrial chain level increased by 0.1629, indicating that the policy significantly enhanced the enterprise’s industrial chain linkage level. In economic terms, compared with enterprises not affected by the R&D tax deduction policy, the industrial chain linkage (Linkage_up) of enterprises affected by the policy increased by 7.45% compared with the sample mean (0.1629/2.1870 = 0.0745). Columns (4) to (6) use Linkage_pr as the dependent variable and show that the estimated coefficients of the core explanatory variable Treat × Post are significantly positive. In Column (6) of Table 3, the estimated coefficient for the R&D tax deduction policy is 0.1797 and the adjusted R-squared is .8430. Thus, after implementing the R&D tax deduction policy, the enterprise’s industrial chain level increased by 0.1797, indicating that the policy significantly enhanced the enterprise’s industrial chain linkage level. In economic terms, compared with enterprises not affected by the R&D tax deduction policy, the industrial chain linkage (Linkage_pr) of enterprises affected by the policy increased by 6.95% compared with the sample mean (0.1797/2.5857 = 0.0695). This conclusion is consistent with Yuan and Li (2021), who argue that R&D incentive policies encourage innovators to compete and cooperate, thereby forming and improving the industrial value chain. Therefore, our results are consistent with Hypothesis 1, in that the positive effect of the R&D super-deduction policy promotes industrial chain integration within firms.
For the control variables, the coefficient of lnsize is significantly positive, indicating that larger firms tend to have higher levels of industrial chain integration. This is likely because of their greater market power, which allows them to attract more suppliers and customers. The coefficient of debt is also significantly positive, suggesting that stronger financial capacity supports industrial chain integration. A moderate debt-to-assets ratio signals robust financing, which aids industrial chain development.
The coefficient of profit is significantly positive, showing that higher profitability enhances industrial chain integration, consistent with economic observations. Conversely, high operating costs negatively affect integration because these costs can reflect inefficiencies in production or management. Return on equity (roe), a key profitability measure, positively influences integration by enabling efficient capital use and fostering financial stability in chain expansion. However, the coefficient of lnage is negative, suggesting that younger firms have stronger innovation capabilities, leading to greater industrial chain integration. In contrast, mature firms may face stagnation due to established routines and a lack of innovation drive, hindering their industrial chains’ further development.
Robustness Tests
Substitution of Independent Variables
This study constructs alternative indicators for industrial chain linkages for robustness testing to address the potential measurement bias in the dependent variable that could affect the baseline regression results. Specifically, the procurement to operating revenue ratio is used as a measure of VAS, multiplied by the industry’s upstream degree and the number of production stages, to create alternative indicators for firms’ industrial chain linkages. Table 4 presents the regression results obtained using these indicators. The estimated coefficients for Treat × Post are all significant and positive, indicating that the R&D super-deduction policy promotes industrial chain linkages, consistent with the baseline regression results.
Substitution of Independent Variables.

Note. This table omits the control variables and the constant term regression results, which are the same in the following table.
Indicate significant at the 1% level.
Standard errors clustered at different levels
This study clusters standard errors at higher levels, including the industry, city, and provincial levels. Columns (1) and (2) of Table 5 present the regression results with industry-level clustered standard errors, whereas Columns (3) and (4) present the results with city-level clustering. Columns (5) and (6) show the results with province-level clustered standard errors. Across all models, the coefficients of the interaction term Treat × Post remained significantly positive, further confirming the robustness of the study’s conclusions.
Changing the Clustering Hierarchy.

and ** Indicate significant at the 1% and 5% levels, respectively.
More Fixed Effects
This study incorporates province- and industry-fixed effects based on the baseline regression. Columns (1) and (2) of Table 6 present the regression results for firm, time, and industry fixed effects, whereas Columns (3) and (4) show the results for firm, time, and province fixed effects. Columns (5) and (6) include the firm, time, industry, and province fixed effects, respectively. In all cases, the coefficients of the interaction term Treat × Post remained significantly positive, confirming the robustness of the baseline regression results.
Addition of Province and Industry Fixed Effects.

Indicate significant at the 1% level.
Propensity Score Matching Difference-in-Differences
Given that industries on the negative list of the R&D superdeduction policy may not have been randomly selected, the experimental and control groups may not have fully satisfied the parallel trend assumption. We applied the propensity score matching difference-in-differences (PSM-DID) method for regression analysis to address the potential sample selection bias. The steps are as follows: firm financial variables, such as lnsize, debt, profit, cost, tobin_q, roe, and lnage are selected as the matching variables. We calculated the propensity score, representing the likelihood that each firm is in the treatment group. The original sample was then matched using 1:1 nearest neighbour matching, 1:3 nearest neighbour matching, and radius matching, followed by a DID regression. As shown in Table 7, after adjusting for differences in firm characteristics, the coefficients of Treat × Post remain significantly positive, further confirming the robustness of the study’s conclusions.
Propensity Score Matching Difference-in-Differences Method.

Indicate significant at the 1% level.
Exclusion of Other Macro-Policy Interferences
During the sample period, the Ministry of Finance and the State Administration of Taxation issued several policies, including the ‘Notice on Improving the Enterprise Income Tax Policy for Accelerated Depreciation of Fixed Assets’, the ‘Notice on Further Improving the Enterprise Income Tax Policy for Accelerated Depreciation of Fixed Assets’, and the ‘Announcement on Expanding the Scope of the Preferential Policy for Accelerated Depreciation of Fixed Assets’. An accelerated depreciation policy encourages firms to increase fixed asset investments (Du & Zou, 2023), which may influence their industrial chain linkages. To account for this, we included a dummy variable for accelerated depreciation reform (policy1) in the baseline regression. As shown in Columns (1) and (2) of Table 8, the coefficients on the interaction term Treat × Post remain significantly positive, indicating that the baseline results are robust even after controlling for this policy.
Exclusion of Other Policies.
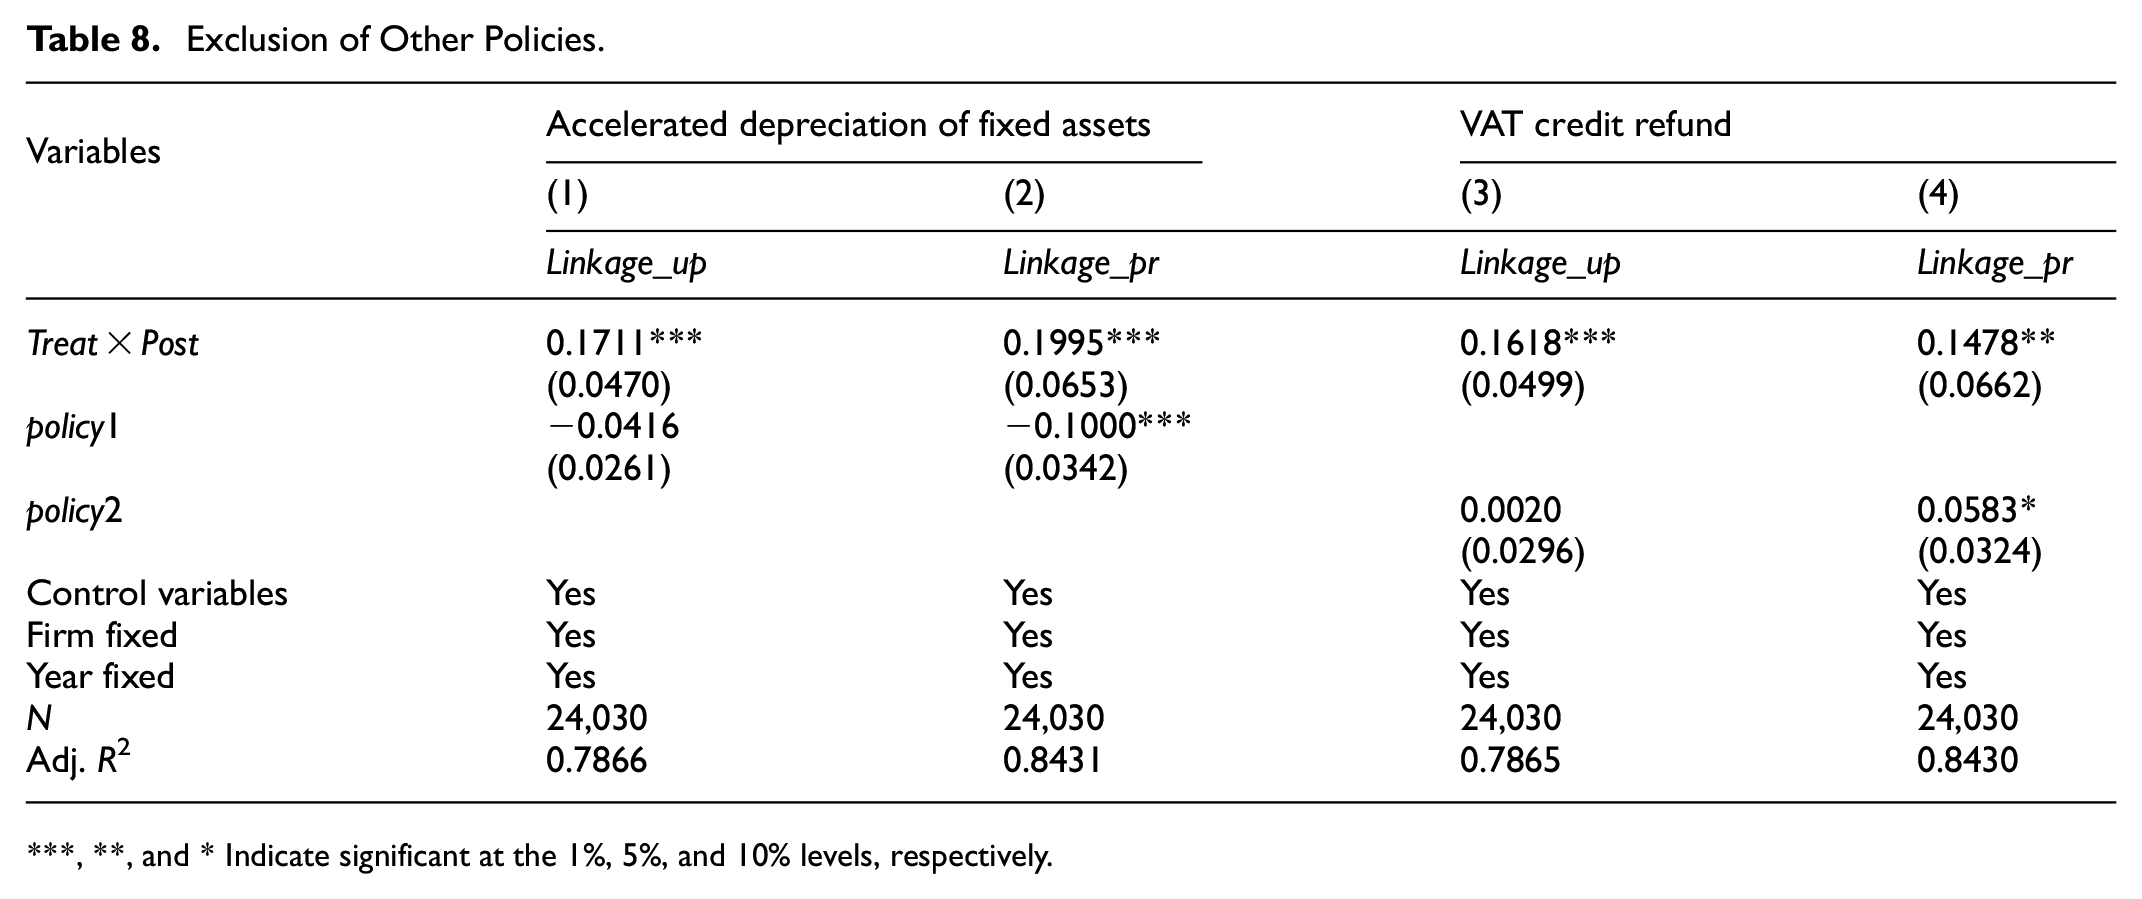
, **, and * Indicate significant at the 1%, 5%, and 10% levels, respectively.
Additionally, during the sample period, the Ministry of Finance and the State Administration of Taxation introduced the ‘Notice on the Tax Policies Related to the Refund of VAT Credit for Certain Industries in 2018’. The VAT credit refund policy helps ease firms’ financing constraints but may also affect their industrial chain linkages. To account for the potential influence of this policy, a dummy variable for the VAT credit refund reform (policy2) is included in the baseline regression. As shown in Columns (3) and (4) of Table 8, the coefficients of the core explanatory variable Treat × Post remain significantly positive, confirming the robustness of the baseline results even after controlling for the effects of other policies.
Placebo Testing
Considering that other random factors might have affected the empirical results, a placebo test was conducted as a robustness check. Random industries from the pilot policy of R&D super-deduction are selected to generate a new policy treatment dummy variable, Treat, multiplied by Post to form a new interaction term. To avoid interference from low-probability events on the empirical results, 500 random samples were used. Figure 2 shows the kernel density estimation of the coefficients and corresponding p-value distributions of the randomly generated interaction terms when the dependent variables are Linkage_up and Linkage_pr. As shown in Figure 2, the distribution of the estimated coefficients was centred around 0 and most of the p-values were greater than .1, indicating that the placebo test was passed. Therefore, the impact on enterprise industrial chain linkages is caused by the R&D super-deduction policy and not by random events.

Placebo test. (a) Linkage_up. (b) Linkage_pr.
Mechanism Test and Heterogeneity Analysis
Mechanism Test
This study further explores how the R&D super-deduction policy affects enterprise–industrial chain linkages. The specific mechanism testing model was as follows:

In Equations 10 and 11, M represents the mechanism variables, including TFP (TFP), internal management costs (MgtCost), asset specificity (Asset), and external financing constraints (Exfian). The definitions and notations of the other variables are consistent with those of the baseline regression.
Internal Production Cost Mechanisms
This study used TFP and MgtCost to measure firms’ internal production costs. In terms of TFP, following the approach of Wu et al. (2023), the LP method is used to calculate TFP. The labour input, capital input, and intermediate input and output variables were measured by the number of employees, net value of fixed assets, operating costs, and main business income of the firm, respectively. Column (1) of Table 9 shows that when the dependent variable is TFP, the coefficient estimate for Treat × Post is significantly positive at the 1% level, and the adjusted R-squared is .9617, indicating that the policy significantly enhances firms’ TFP. The results in Columns (2) and (3) indicate that, when the dependent variable is enterprise industrial chain linkages, the coefficient estimate of Treat × Post is significantly positive at the 1% level, suggesting that the R&D super-deduction policy strengthens enterprise industrial chain linkages by improving TFP.
Mechanism Test I: Internal Production Costs Mechanisms.
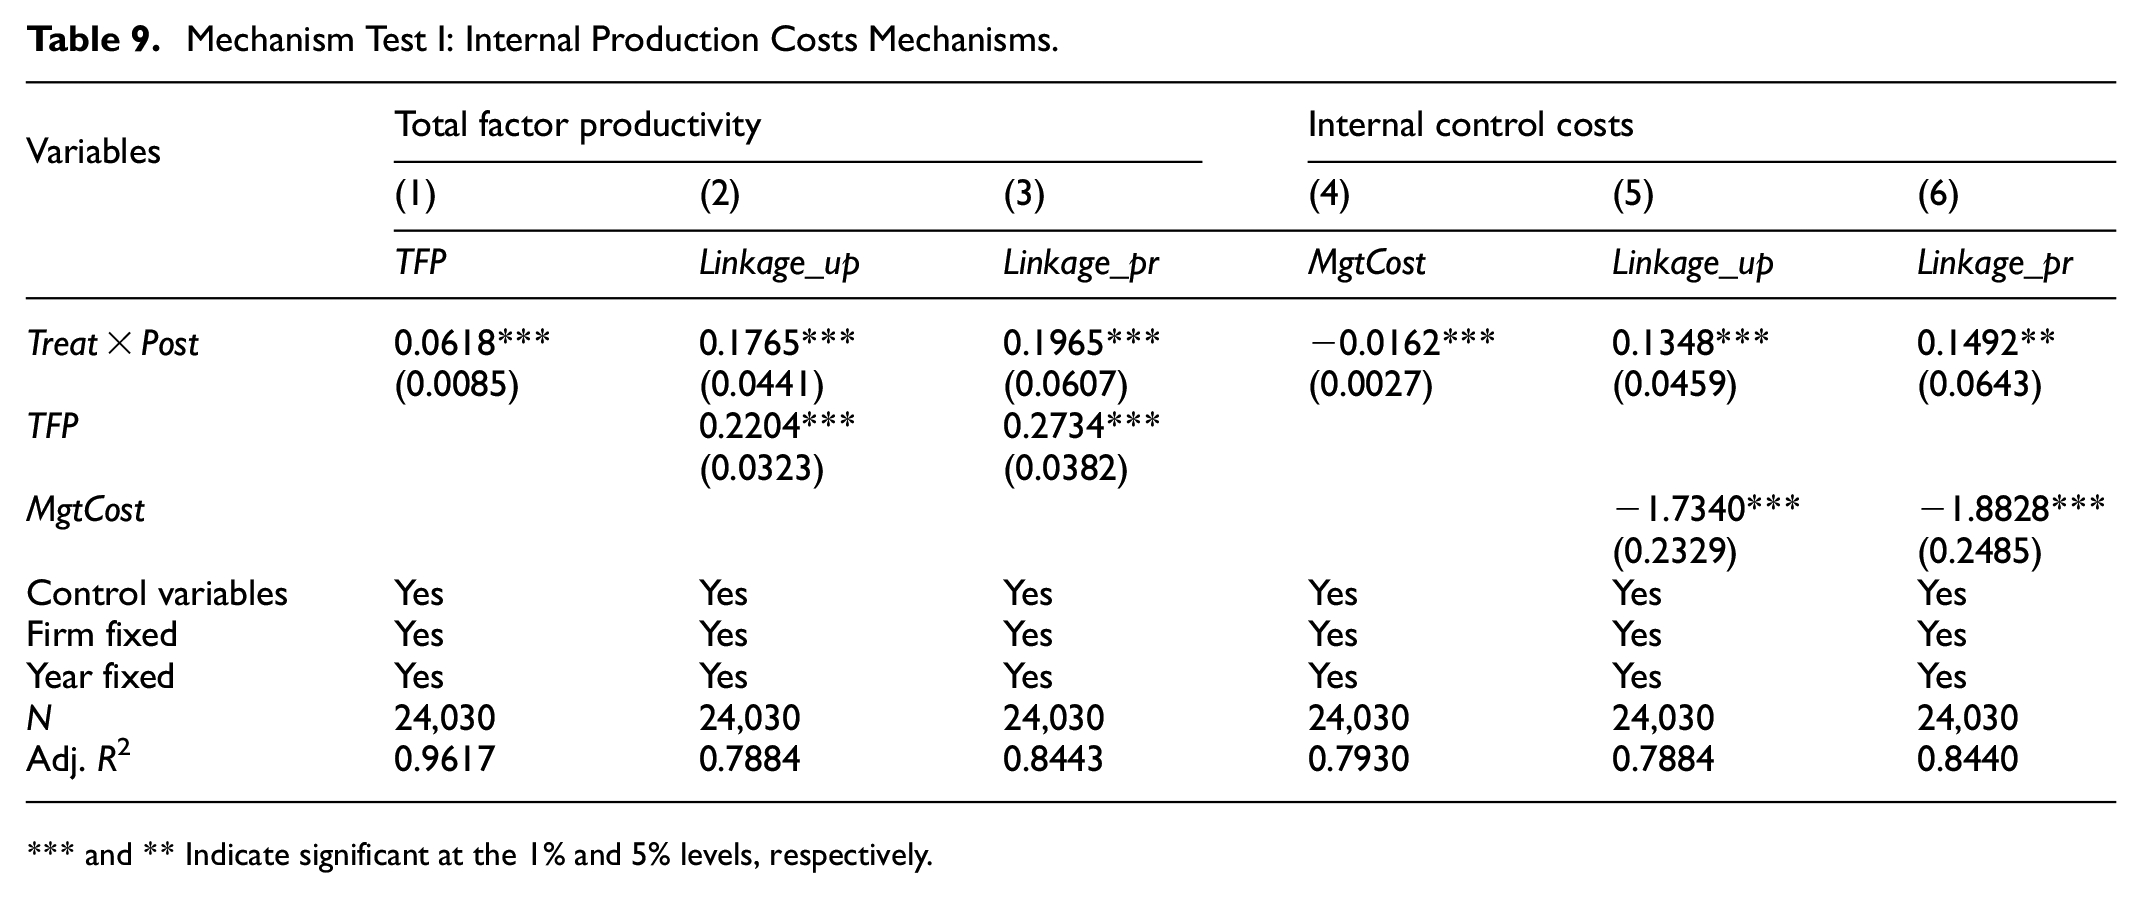
and ** Indicate significant at the 1% and 5% levels, respectively.
In terms of internal management costs, following Xiang et al. (2020), this study measures MgtCost using the ratio of a firm’s management expenses to its operating revenue. The results in Column (4) of Table 9 show that when the dependent variable is internal management costs, the coefficient estimate for Treat × Post is significantly negative at the 1% level, and the adjusted R-squared is .7930, indicating that the policy significantly reduces internal management costs. This conclusion is consistent with the view of Zhang et al. (2024) that tax subsidies can improve corporate productivity. The results in Columns (5) and (6) indicate that when the dependent variable is enterprise industrial chain linkages, the coefficient estimate for Treat × Post is significantly positive at the 5% level. In contrast, the coefficient of internal management costs is significantly negative, suggesting that the R&D super-deduction policy enhances enterprise industrial chain linkages by reducing internal management costs. Therefore, our results are consistent with Hypothesis 2 in that the positive effect of the R&D super-deduction policy, by reducing internal production costs, promotes vertical division of labour, thereby enhancing industrial chain integration.
External Transaction Cost Mechanisms
This study primarily measures firms’ external transaction costs from two perspectives: asset specificity (Asset) and external financing constraints (Exfian). Firms with high asset specificity are likelier to exploit their trading partners. When one party makes a specific investment and the contracts are incomplete, the other party may exploit the investment’s immobility by threatening to exit the transaction to increase its bargaining power and gain additional benefits. Drawing on Conti et al. (2008), we use the ratio of fixed assets to total assets to measure asset specificity (Asset) as a reflection of firms’ external transaction costs. The results in Column (1) of Table 10 show that the coefficient estimate for Treat × Post is significantly negative at the 1% level and the adjusted R-squared is .7713, indicating that the policy can significantly suppress the increase in asset specificity levels. The results in Columns (2) and (3) indicate that when the dependent variable is enterprise industrial chain linkages, the coefficient estimate of Treat × Post is significantly positive at the 1% level, suggesting that the R&D super-deduction policy enhances enterprise industrial chain linkages by reducing asset specificity levels.
Mechanism Test II: External Transaction Cost Mechanisms.

Indicate significant at the 1% level.
Following the approach of Minetti et al. (2019), this study measures external financing constraints (Exfian) using the difference between 1 and the ratio between current assets and liabilities to total assets at the end of the period. A higher value indicates stronger external financing constraints faced by firms. The results in Column (4) of Table 10 show that when the dependent variable is Exfian, the coefficient estimate for Treat × Post is significantly negative at the 1% level, and the adjusted R-squared is .8661, indicating that the policy effectively alleviates firms’ external financing constraints. The results in Columns (5) and (6) indicate that when the dependent variable is enterprise industrial chain linkages, the coefficient estimate for Treat × Post is significantly positive at the 1% level, suggesting that the R&D super deduction policy enhances enterprise industrial chain linkages by alleviating external financing constraints.This conclusion is consistent with Calabrese et al.’s (2024) view that innovation incentive policies can alleviate corporate financing constraints. Therefore, our results are consistent with Hypothesis 3 in that the positive effect of the R&D super-deduction policy promotes the horizontal division of labour by reducing external transaction costs, thereby enhancing industrial chain integration.
Heterogeneity Analysis
The previous analysis confirmed that the R&D super deduction policy significantly promoted enterprise–industrial chain linkages. However, this policy has different effects on different types of firms. To address this question, we conducted regression analysis using a triple-difference model based on firm size, ownership structure, firm age, and industry differences.
The first is the difference in the firm size. Using the median firm size as the standard, firms larger than the median are classified as large-scale enterprises (Size = 1), while the remaining firms are classified as small-scale enterprises (Size = 0). Columns (1) and (2) of Table 11 show that the coefficients of the interaction term Treat × Post × Size are significantly positive, indicating that the R&D superdeduction policy significantly promoted industrial chain linkages for large-scale enterprises.
Heterogeneity Analysis.

and ** Indicate significant at the 1% and 5% levels, respectively.
The second reason is the difference in ownership structures. Firms with different ownership structures exhibit significant differences in their sensitivities to policies. As a result, the R&D super-deduction policy may have different impacts on the industrial chain linkages between SOEs and non-SOEs. Based on ownership structure (Own), firms are categorised as state-owned enterprises (Own = 1) and non-state-owned enterprises (Own = 0). The results in Columns (3) and (4) of Table 11 show that the coefficients of the interaction term Treat × Post × Own are significantly positive, indicating that the R&D super-deduction policy has a stronger effect on promoting industrial chain linkages in SOEs, which aligns with theoretical expectations.
The third factor is differences in firm age. Using the median firm age as a standard, firms older than the median were classified as mature enterprises (Age = 1), whereas the remaining firms were categorised as start-ups (Age = 0). Columns (5) and (6) of Table 11 show that the estimated coefficients of the interaction term Treat × Post × Age are significantly positive, indicating that the R&D super-deduction policy promotes industrial chain linkages in mature enterprises.
Fourth, industry differences exist. Manufacturing is the backbone of the real economy, often requiring significant investments in product R&D, equipment upgrades, and continuous innovation to adapt to market changes and meet consumer demands. Therefore, the impact of the R&D super-deduction policy on industrial chain linkages may differ between manufacturing and non-manufacturing firms. This study categorises firms by industry into manufacturing enterprises (Manu = 1) and non-manufacturing enterprises (Manu = 0). In Columns (7) and (8) of Table 11, the coefficients of the interaction term Treat × Post × Manu are significantly positive, indicating that the R&D super-deduction policy significantly promoted industrial chain linkages in manufacturing firms compared to non-manufacturing firms.
Further Analysis
The business environment is an important reflection of a region’s economic soft power. Due to differences in economic strength, resource endowments, and policy frameworks across regions, there are significant disparities in business environments between different areas. A favourable business environment signifies a region’s sound administrative, fair, and legal environment. Therefore, in different business environments, the effect of the R&D super deduction policy on promoting enterprise–industrial chain linkages naturally varies.
First, a favourable administrative environment ensures that enterprises can understand and benefit from the R&D super-deduction policy in a timely and accurate manner, reducing the issue of insufficient policy utilisation caused by information asymmetry. In such an environment, firms continue increasing their R&D investment, enhancing their industrial chain linkages. Second, the quality of the market environment directly affects market access and competition conditions for enterprises. In a fairly competitive market, an R&D super-deduction policy can more effectively incentivise firms to increase R&D investment, improve product market competitiveness, and strengthen industrial chain linkages. Finally, a well-established legal and regulatory system can provide firms with stable operational expectations and rights protection, boosting their confidence in R&D investments.
In regions with better business environments, the R&D super-deduction policy can quickly and efficiently translate into actual R&D investment by enterprises, thereby driving technological innovation and product upgrades. Firms can fully capitalise on policy benefits, accelerating the integration and expansion of the upstream and downstream parts of the industrial chain, thus forming a more complete and robust industrial supply chain system. Therefore, the better the business environment, the stronger the effect of the R&D super-deduction policy on promoting enterprise industrial chain linkages.
To examine the impact of the business environment on the relationship between the R&D super deduction policy and enterprise industrial chain linkages, the following moderating effect model was constructed:

In this model, envir is the moderating variable representing the business environment and is measured by a dummy variable indicating whether tax-related business environment reforms were implemented. If the province (autonomous region, municipality) where the firm is located implements the tax business environment pilot reform in year t, then envir takes the value of one for that year and the following years; otherwise, it is zero. The definitions of the other variables are consistent with those of the baseline regression model. Pilot provinces (regions, cities) in 2017 include: Beijing, Shanghai, Guangzhou, Shenzhen, Jiangsu; pilot provinces (regions, cities) in 2018: Zhejiang, Jiangxi, Hubei, Guangxi, Hainan, Chongqing, Shaanxi, Xinjiang, Dalian, Ningbo, Xiamen, Qingdao.
Table 12 reports the regression results of the moderating effect of business environment optimisation. Columns (1) and (3) present the baseline regression results, while Columns (2) and (4) show the results after including the business environment moderating variable. The findings indicate that the interaction term coefficient between the R&D super deduction policy and business environment optimisation is significantly positive, suggesting that business environment optimisation has a significant positive moderating effect on the relationship between the R&D super deduction policy and enterprise industrial chain linkages. In other words, in regions with better business environments, the R&D super deduction policy has a stronger effect in promoting enterprise industrial chain linkages.
Moderating Effects of the Business Environment.
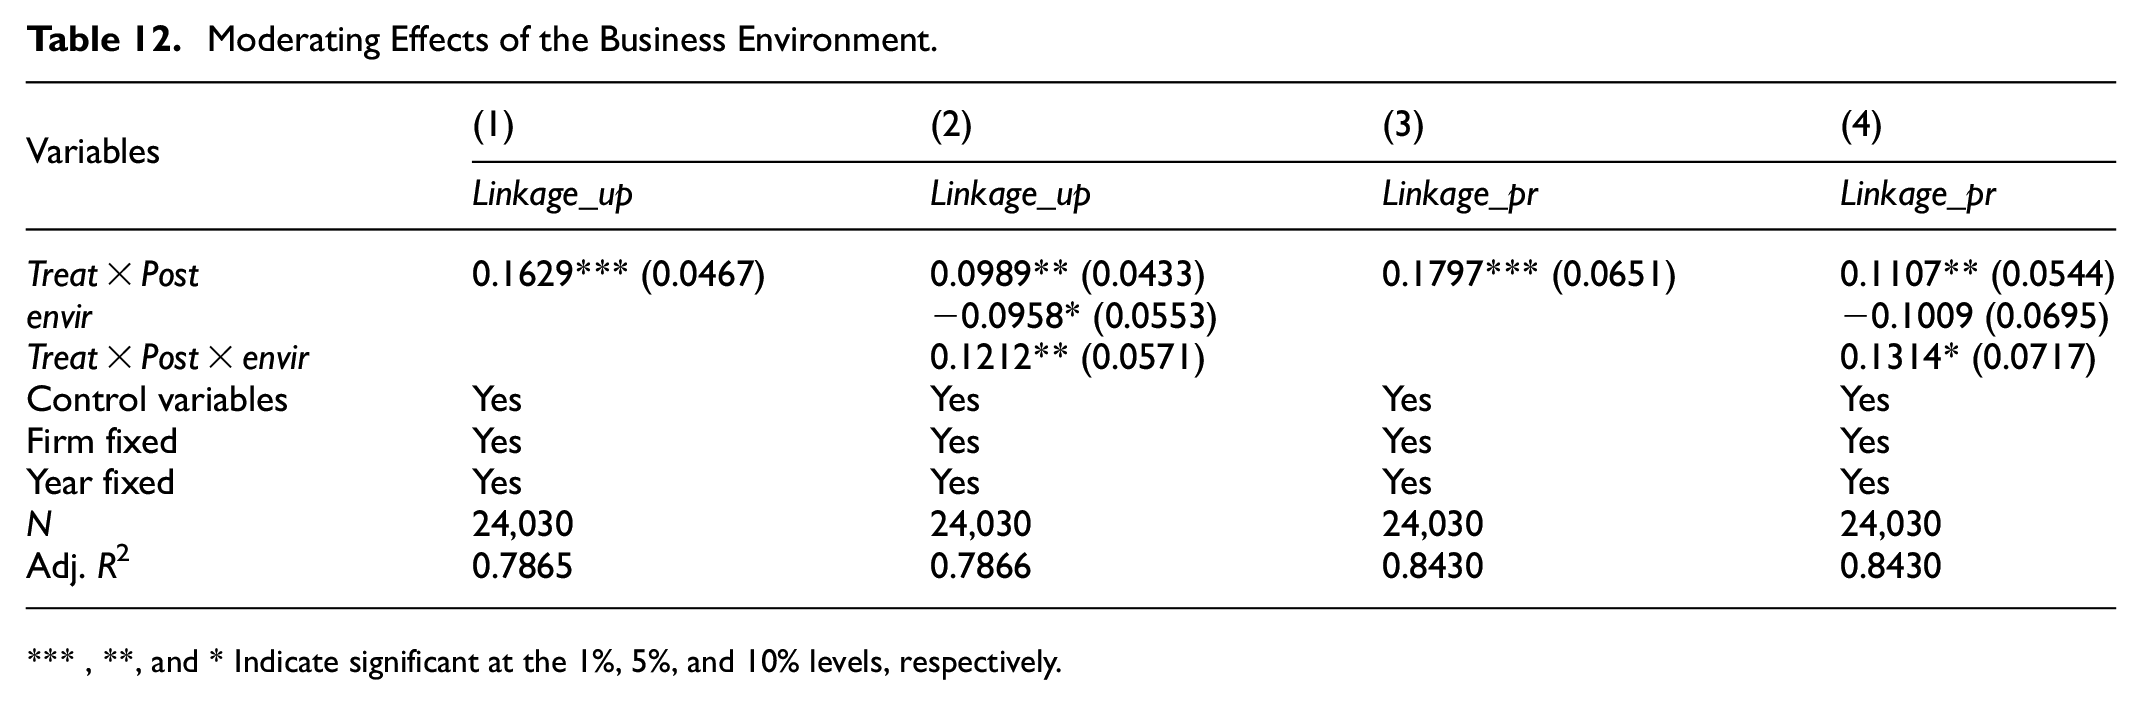
, **, and * Indicate significant at the 1%, 5%, and 10% levels, respectively.
Conclusion
Findings
We empirically examine the impact of the R&D super-deduction policy on firms’ industrial chain linkages and find that firms affected by the policy show significant improvement in these linkages compared with those unaffected. This finding suggests that the policy has effectively strengthened industrial chain integration. The mechanism tests indicate that after the policy’s implementation, the pilot firms experienced reductions in internal management, transactions, and financing costs, contributing to higher TFP and further enhancing their industrial chain linkages.
Heterogeneity analysis reveals that the positive impact of the R&D super-deduction policy is more pronounced in large-scale enterprises, state-owned enterprises, mature firms, and manufacturing companies. Moreover, using the business environment as a moderating variable, the analysis shows that regions with better-optimised business environments experience a stronger positive effect of the R&D super-deduction policy on industrial chain linkages. This finding indicates that an improved business environment significantly enhances the effectiveness of a policy in promoting industrial chain integration. For example,
Theoretical Implications
This study underscores the growing significance of R&D funding and uses the R&D deduction policy as an exogenous shock, employing a difference-in-differences technique to empirically assess the policy’s impact on industrial chain linkages. While most research on R&D tax policies focuses on firm-level innovation outcomes), few explore their effects on supply chain performance and stability. Unlike prior research focused on digital transformation, market liberalization, or technological progress, this study emphasizes the role of specific tax reforms, offering valuable insights into the effect of R&D tax deductions on corporate industrial chain linkages. By developing and testing a mathematical model, we show that R&D tax deductions drive technological innovation and enhance supply chain efficiency and resilience. The findings reveal that the policy significantly enhances these linkages by reducing internal production and external transaction costs, with differentiated impacts based on firm size, ownership, age, and industry, contributing to policymaking and economic decisions.
Practical Implications
The results have several policy implications. First, the R&D tax deduction reform should be deepened to strengthen support for supply chains and enhance enterprise resilience. The policy’s deduction ratio increasing from 50% to 100% has effectively promoted corporate innovation and industrial chain integration. However, the current ‘negative list’ excludes certain industries like wholesale and retail, limiting access to tax incentives. Dynamically adjusting the list to include transforming traditional industries and emerging sectors such as e-commerce could broaden the scope of beneficiaries and foster innovation across various fields.
Second, the policy reduces internal production and external transaction costs, encouraging a deeper division of labour, increasing corporate liquidity, and enhancing industrial chain linkages. To further these effects, local governments should simplify the declaration process, digitize approvals, and lower associated costs. Financial institutions should also support technology companies with tailored financial products and services to meet R&D funding needs.
Third, differentiated tax deduction policies are necessary to stimulate innovation and support different types of enterprises. Larger, state-owned, mature, and manufacturing firms would benefit from enhanced support, while smaller, non-state-owned, growing, and non-manufacturing enterprises require lower policy thresholds, simplified processes, and accessible services to drive development and innovation. Intellectual property protection should also be strengthened to safeguard innovative achievements and promote industrial chain linkages.
Fourth, the business environment significantly moderates the relationship between R&D tax deductions and industrial chain linkages. Optimizing this environment requires simplifying approval processes, enhancing service efficiency, and ensuring transparency in government operations. Strengthening supervision during and after the implementation of policies ensures compliance and fair competition. Introducing targeted support, such as tax incentives, subsidies, and financial aid, would further address practical enterprise needs and boost market vitality.
Limitation and Future Orientation
Despite its insights, this study has limitations. It focuses on listed companies, leaving the impact of R&D tax deductions on non-listed companies unexplored. Future research should broaden the sample to include non-listed firms for a more comprehensive understanding of the policy’s effects. Additionally, other fiscal and tax incentives during the study period may have influenced industrial chain linkages. Future studies should consider these external factors to better contextualize the impact of tax reforms on corporate behaviour.
Footnotes
Funding
The author(s) disclosed receipt of the following financial support for the research, authorship, and/or publication of this article: The author(s) acknowledge financial support from the Philosophy and Social Sciences Research in Universities of Jiangsu Province (2025SJYB1345), and the Research foundation of Jiangsu Ocean University “Haizhou Bay Talents” Innovation Program Project (PD2025015).
Declaration of Conflicting Interests
The author(s) declared no potential conflicts of interest with respect to the research, authorship, and/or publication of this article.
Data Availability Statement
Data sharing not applicable to this article as no datasets were generated or analysed during the current study.