
Abstract
The increasing importance of ambient air quality in tourism has brought urban tourism development’s effective promotion at the policy level into sharp focus. This paper leverages panel data from 276 Chinese cities at or above the prefectural level, spanning from 2007 to 2022 By considering the Ambient Air Quality Standards as a quasi-natural experiment, the study applies a difference-in-difference method to empirically assess the impact of this policy on tourism development, and its transmission mechanisms. The findings underscore that environmental regulation policies significantly contribute to advancing tourism development in cities. Moreover, the policy’s effects are found to vary according to geographic location, development scale, and economic region of the cities. Environmental regulation policies affect urban tourism through technological, scale, and structural mechanisms. These empirical insights lend substantial support to the broader implementation of environmental regulation policies across the nation. They also provide crucial guidance for the formulation of tourism development strategies that emphasize environmental regulation, both within China and globally.
Plain language summary
Good air quality is becoming a key factor in attracting tourists, pushing governments to explore how environmental policies can boost city tourism. This study looks at China’s efforts to improve air quality and how these rules have shaped tourism growth. Researchers analyzed data from 276 Chinese cities between 2007 and 2022, focusing on a major clean-air policy introduced in 2012. By comparing cities before and after the policy was implemented, they tested how stricter environmental rules influenced tourism and identified the reasons behind these changes. The results show that cities with stronger air quality regulations saw significant growth in tourism. Cleaner air made these places more appealing to visitors, while the policies also encouraged businesses to adopt greener practices. However, the benefits weren’t the same everywhere. Coastal cities, larger cities, and wealthier regions saw bigger tourism boosts from these policies compared to inland, smaller, or less-developed areas. Three main factors explain how environmental policies drive tourism growth: (1) Cities invested in cleaner technologies (e.g., energy-efficient hotels, electric transport), attracting eco-conscious travelers. (2) Stricter rules pushed polluting industries to shrink or relocate, freeing up space for tourism infrastructure like parks and cultural sites. (3) Cities shifted their economic focus toward low-pollution sectors like eco-tourism and services instead of heavy industry. These findings support China’s nationwide push for stricter environmental rules and offer lessons for other countries. For governments, the study suggests that pairing tourism plans with air quality improvements can create long-term economic benefits. For global policymakers, it highlights that environmental regulations don’t just protect nature—they can also drive sustainable tourism if tailored to a region’s geography, size, and economic strengths.
Keywords
Introduction
The 21st century marks a golden era for China’s tourism industry and a crucial period for the Asia-Pacific region (R. J. C. Chen, 2011). The Chinese government has consistently emphasized the high-quality development of tourism, implementing various policies to stimulate growth. As a result, China has emerged as the world’s largest outbound tourism spender and the third-largest inbound tourism destination, solidifying its position as a global tourism powerhouse. However, the rapid growth of tourism and the economy has led to a significant increase in air pollutants and greenhouse gas emissions (L. Zhang et al., 2014). As one of the world’s largest emitters of air pollutants, China faces severe air pollution challenges, which have become a major constraint on the development of its tourism industry. Moreover, the growth of tourism is closely linked to ecological environmental protection. The rapid regional economic growth and expansion of heavy industry enterprises have heightened the risk of deteriorating air quality, threatening the sustainability and long-term development of tourism (Sajjad et al., 2014).
Given these challenges, effectively reducing air pollution while promoting tourism growth has become a critical issue. This paper argues that government environmental policies are essential for controlling air pollution and advancing tourism development. Environmental regulations provide institutional guarantees for improving air quality. Consequently, the Chinese government and society have made significant efforts to reduce air pollution and carbon emissions. The government has shifted from relying solely on administrative measures to adopting a comprehensive approach involving legal, economic, and technological policies (Guo, 2023). In 2012, the State Council revised the Ambient Air Quality Standards, strengthening comprehensive air pollution prevention and control, and began monitoring and releasing air quality information under the new standards (W. Chen et al., 2016). The “Ambient Air Quality Standards” (hereafter referred to as the “new standard policy”) has enhanced air quality regulation, played a crucial role in ecological protection and tourism development, and set a global example for environmental protection. These measures have promoted ecological civilization and the sustainable development of urban tourism by reducing emissions and improving air quality (Z. Wang et al., 2023).
This study examines the impact of China’s command-and-control environmental regulations on tourism development, focusing on three core questions: (1) Do pollution reduction policies, exemplified by the new standard policy, improve urban tourism by lowering PM2.5 concentrations, and enhancing ecological quality? (2) Do technological innovation, population mobility, and industrial restructuring serve as critical mediators in this process? (3) How do policy effects vary across cities based on geographic location, population size, and spatial connectivity? To address these questions, we analyze Chinese city-level panel data (2007–2022) to evaluate how mandatory emission reductions under the New Standard Policy directly improve air quality, thereby increasing tourist attraction through mechanisms like the “Blue Sky Effect.” Simultaneously, pollution control triggers three transformative pathways: technological advances (e.g., clean energy adoption), population mobility (e.g., skilled labor migration), and industrial upgrading (e.g., replacing polluting industries with green sectors). These mechanisms collectively drive tourism’s transition from high-energy models to eco-friendly, high-end formats such as ecotourism and smart scenic areas (De Santis et al., 2021). This framework provides region-specific insights for aligning environmental governance with tourism economies. Finally, this study investigates whether there is spatio-temporal heterogeneity in the relationship, for example, the effects of technology and policy implementation have some differentiated effects depending on whether different regions are developed or not (Ma & Xu, 2022). Therefore, the relationship between the three is essentially the process of environmental regulation reshaping the ecology of tourism economy through pollution management, balancing the relationship between the three, and thus achieving a symbiotic win-win situation between ecological protection and tourism development.
The contributions of this study include the following: First, it is the first to integrate the new standard policy, air pollution, and tourism development into a single analytical framework. This approach provides more robust theoretical support and empirical evidence for future environmental and tourism policies compared to previous methods that used related indicators to measure environmental regulation intensity (Xiong & Wang, 2020). Second, by employing the New Standards Policy as a quasi-natural experiment and constructing a Difference-in-Differences (DID) model with the Propensity Score Matching–Difference-in-Differences (PSM-DID) method, this study overcomes limitations related to data measurement and endogeneity issues, offering more scientifically rigorous conclusions compared to other methods on the same topic (Sun et al., 2023). Third, the analysis of the heterogeneous impacts of the policy on tourism development across different regions and environmental conditions provides richer and more multidimensional data than single-standard approaches.
Literature Review and Hypothesis Development
Literature Review
Pollution Control Effects of Environmental Policies and Tourism Development
Existing studies primarily focus on the direct regulatory effects of environmental policies on air pollution. Environmental regulations are broadly categorized into command-and-control, market-based incentives, and voluntary initiatives, depending on their governance mechanisms (Ren et al., 2018). Command-and-control policies (e.g., emission standards, production restrictions) directly reduce local pollutant concentrations through mandatory emission cuts, thereby enhancing destination appeal and fostering sustainable tourism (Pivčević et al., 2020). In contrast, market-based policies (e.g., carbon trading, green subsidies) motivate corporate environmental responsibility and spur technological innovation, which can drive long-term low-carbon transitions in tourism (Y. Wang et al., 2021b). Meanwhile, voluntary initiatives centered on information disclosure (e.g., eco-city certifications) have gained prominence for promoting “societal co-governance” in pollution control by strengthening public oversight and participation (Jiang et al., 2024). Research on the nexus between environmental regulation and urban tourism development yields three key findings. First, short-term costs, such as increased corporate pollution control expenses, may suppress tourism investment while raising environmental quality standards (Inoue & Lee, 2011). Second, the relationship between environmental regulation intensity and tourism competitiveness exhibits non-linear patterns, including inverted U-shaped (M. Y. Liu & Yuan, 2018) and U-shaped dynamics (C. Peng & Yuan, 2019). Third, environmental regulation can significantly boost tourism development by incentivizing green innovation, reducing water pollution, and improving the quantity and quality of tourist attractions (Jiang et al., 2024; Sun et al., 2023). Under regulatory pressures, tourism-dependent cities often prioritize strengthening their tourism sectors (Bramwell & Cox, 2009). However, existing studies lack consensus on the overall impact of environmental regulation on tourism. Most focus narrowly on tourism-centric outcomes, failing to systematically analyze the dynamic interplay between policy, pollution, and tourism or evaluate long-term effects.
Multidimensional Impact of Air Pollution on Tourism Development
Air pollution arises from multiple drivers, including industrialization, energy consumption patterns, and transportation emissions. Its adverse effects extend beyond public health (Hu & Guo, 2021) to socio-economic dimensions. Recent studies reveal that elevated PM2.5 levels inhibit technological innovation quality (Lin et al., 2021), hinder industrial upgrading (G. Zhang et al., 2019), and trigger large-scale migration (Germani et al., 2021). Conversely, environmental policies that improve air quality can enhance tourism appeal by increasing environmental carrying capacity and creating physical space for tourism expansion (Vanhove, 2002). Notably, air pollution’s linkage to tourism has gained attention—for instance, haze events reduce travel demand (J. Peng & Xiao, 2018). However, existing research inadequately explores indirect mechanisms. Environmental policies addressing air pollution may spur innovation (e.g., clean energy technologies), attract high-skilled talent, and promote green industries to replace polluting sectors. These pathways could reshape tourism development, yet a narrow focus on short-term pollution reduction risks overlooking long-term incentives for tourism innovation. Clarifying these multi-path dynamics—linking pollution control to tourism via policy-driven mechanisms—is critical for optimizing environmental governance and balancing ecological preservation with tourism economies.
Integration of Environmental Policy, Air Pollution and Tourism Development Linkages
While existing studies have explored the individual dynamics of environmental policies, air pollution, and tourism development, critical gaps persist in understanding their interplay. First, persistently high air pollutant levels threaten public health and damage tourism appeal, compelling governments to tighten environmental regulations. Such measures drive technological upgrades and digital transformation within the tourism sector (Yang et al., 2012). Second, environmental policies may lower the “livability threshold” of polluted areas, incentivizing migration to regions with cleaner air and indirectly stimulating tourism growth in these destinations (Germani et al., 2021). However, the tripartite relationship is further complicated by unintended consequences. For instance, stringent environmental regulations in one region may improve local air quality but trigger pollution spillovers to neighboring tourism hubs through industrial relocation—a phenomenon termed the “pollution haven effect” (Sinclair, 1998). Such dynamics can also disrupt regional industrial structures, creating trade-offs between ecological preservation and tourism competitiveness. To address these complexities, a policy-pollution-tourism nexus framework is proposed. This framework would systematically unravel the mechanisms linking environmental governance to tourism outcomes, while evaluating long-term impacts such as industrial restructuring, and innovation-driven sectoral shifts.
Hypothesis Development
The Porter Hypothesis posits that environmental regulations compel firms to adopt cleaner production methods, spurring technological innovation to reduce emissions and achieve a win-win scenario for environmental protection and economic growth (Zhu et al., 2014). Reduced air pollution further lowers corporate environmental remediation costs, freeing resources for innovation and enhancing regional competitiveness through a “green compensation effect” (Deng et al., 2019). Strict regulations also incentivize increased R&D investments (Yang et al., 2012), driving innovations such as clean energy technologies and smart management systems. These advancements permeate the tourism sector, enabling service upgrades and product differentiation to bolster tourism competitiveness. Notably, technological innovation under environmental governance creates new opportunities for tourism. In high-income regions, synergies between pollution control and innovation significantly boost inbound tourism (Q. Zhang et al., 2022). Conversely, less developed areas with weaker technological absorption capacities may exhibit divergent responses, potentially hindering tourism growth (Gan et al., 2022). Based on this, the first research hypothesis is proposed:
Drawing on the push-pull theory, environmental policies reshape population mobility patterns by improving air quality, thereby driving sustainable, high-quality tourism development. First, stringent environmental regulations enhance pollution control efficiency and reduce emissions, improving regional air quality (G. Zhang et al., 2021). This mitigates air pollution’s push effects—health risks such as reduced life expectancy (Hu & Guo, 2021), diminished well-being, and elevated depression rates (X. Zhang et al., 2017)—which traditionally drive residents to migrate from polluted areas (Germani et al., 2021). Concurrently, improved air quality amplifies pull effects by expanding urban scale and bolstering green reputations, enhancing cities’ appeal as residential and tourist destinations (Lei et al., 2021). As Albalate et al. (2017) note, population mobility shapes urban demographics, directly influencing tourism demand and economic outcomes. Cleaner air thus acts as a powerful pull mechanism, attracting eco-conscious tourists and businesses, particularly green industries, and sustainable enterprises, which foster high-value tourism growth (Gullion et al., 2015). Consequently, the second research hypothesis is proposed:
The pollution haven hypothesis suggests that polluting industries may relocate to regions with weaker environmental regulations. However, stringent environmental policies compel firms to invest in air pollution control and technological upgrades, improving air quality and driving industrial restructuring (Jiang et al., 2024). For example, stricter air quality standards force energy-intensive industries to exit, freeing resources (e.g., land, capital) for green sectors like renewable energy. While some polluters may migrate to less regulated areas, localities can attract low-carbon service industries to achieve industrial modernization (Asghari, 2013). Under environmental policies, tourism often emerges as a catalyst for sustainable transitions, attracting industrial capital and guiding structural shifts (Sinclair, 1998). Industrial upgrading, particularly the rise of green sectors, reduces tourism’s carbon footprint (Zhou & Lin, 2022). In eastern China, such policies have amplified tourism growth by promoting industrial upgrades, generating sustained economic benefits (C. Liu et al., 2014; Song et al., 2021). Therefore, the third research hypothesis is proposed:
Research Design
Model Construction
The Difference-in-Differences (DID) method is an econometric tool used to assess the effects of policies or interventions by treating policy changes as “natural experiments” or “quasi-experiments” (K. Wang et al., 2019). In the context of China’s new standard policy implementation, the DID method identifies the net impact of the policy by comparing differences in air pollution and tourism development between pilot cities and non-pilot cities before and after the policy’s implementation. Specifically, by setting up a DID model, we can estimate the additional impact of the policy on pilot cities while controlling city-specific characteristics that are constant over time and macroeconomic factors that change over time. A significantly negative coefficient for the interaction term in the model indicates that the policy effectively reduced air pollution in pilot cities, a significantly positive coefficient suggests that the policy promoted tourism development in these cities.
The Propensity Scores Matching Difference-in-Differences (PSM-DID) method combines Propensity Score Matching (PSM) and DID techniques to evaluate the impact of the new standard policy on tourism development (Heckman et al., 1998). First, by estimating propensity scores based on factors such as city population density and economic development, we determine the likelihood of a city implementing the new standards. We then match pilot cities (those implementing the policy) with similar control cities that did not implement the standards. Next, using the DID method, we calculate the difference in tourism development changes between the treatment group and the matched control group before and after the policy’s implementation, thereby estimating the net effect of the new standard policy.
Tourism Development Assessment Model
To more accurately assess the impact of the new standard policy on urban tourism development in China and to eliminate potential confounding factors, we employed the Difference-in-Differences (DID) model, and the Propensity Score Matching Difference-in-Differences (PSM-DID) model. The models are constructed as follows:


Let i represent cities and t represent years. In Model (1), the dependent variable tourit represents the tourism development index for city i in year t. The variable post is a dummy variable equal to 1 when t >= 2012 and 0 otherwise. The policy pilot areas include 74 prefecture-level cities, while the non-pilot areas consist of 202 prefecture-level cities. The dummy variable treat equals 1 if city i is affected by the policy and 0 otherwise. The interaction term measures the net effect of the new standard policy on regional tourism development. Xit denotes control variables, while μt and ηi represent year fixed effects and city fixed effects, respectively. εit is the random disturbance term. In Model (2), the dependent variable touritpsm is the result after propensity score matching, with other variables remaining consistent with Model (1).
Air Improvement Effectiveness Evaluation Model
To analyze the impact of the new standards on tourism development, it is essential first to verify whether the new standard policy effectively improves regional air quality. Therefore, the model employs a difference-in-differences (DID) approach. The model is constructed as follows:

Let i represent cities and t denote years. The dependent variable is the air quality index for city i in year t. The core explanatory variables align with those in Model (1). The interaction term measures the net effect of the new standards policy on air pollution, specifically PM2.5 concentration changes. A significant negative coefficient for the interaction term would indicate that the policy effectively reduces air pollution and improves air quality. All other variables remain consistent with those in Model (1).
Variable Settings
The dependent variable in Model (1) is tourism development (Tour), measured by per capita tourism revenue, following the approach of Sun et al. (2023). This metric represents the ratio of total domestic and international tourism income to the year-end population of each city, with international income converted using the exchange rate of that year. The data were sourced from the Urban Statistical Yearbook and the Statistical Bulletin on National Economic and Social Development from 2008 to 2023.
The dependent variable in Model (2) is tourism development (Touritpsm), a new variable derived using the propensity score matching method.
The dependent variable in Model (3) is air pollution levels (PM2.5), measured using annual average PM2.5 concentration data. This data was extracted from the dataset shared by Dr. Wei Jing’s team on the National Tibetan Plateau Data Center platform (https://zenodo.org/records/6398971).
The key explanatory variable is the interaction term (Treati × Postt), which is composed of the interaction between a dummy variable for cities in the pilot program of the new standard policy and a dummy variable for the policy implementation period. A significant coefficient indicates the net effect of the policy implementation, representing the environmental regulatory impact. A positive coefficient suggests a promotional effect, while a negative one indicates a suppressive effect. If the coefficient is not significant, it implies no impact.
Control Variables: To account for socio-economic factors, this study includes the following variables, following the approaches of Xu et al. (2019) and Y. Wang et al. (2021a): (1) Regional Economic Development (Eco): Measured as the logarithm of per capita GDP. (2) Population Density (Pop): Calculated as the ratio of the total population to the area of the city. (3) Human Capital Level (Hum): Determined by the proportion of higher education students to the total population. (4) Level of Openness (Open): Assessed as the ratio of foreign capital utilization to regional GDP. (5) Government Size (Gov): Measured as the proportion of general budget expenditures to regional GDP. (6) Capital Investment Level (Invest): Calculated as the ratio of fixed investment to regional GDP. (7) Transportation Accessibility (Tra): Evaluated as the ratio of the total road area to the city area. (8) Greening Level (Green): Determined by the proportion of green space to the total area in developed zones. (9) Regional Income Level (Income): Measured as the logarithm of disposable income of urban and rural residents. (10) International Scale Level (Int): Assessed by the number of international tourists visiting.
Mechanism Variables: (1) Technology Effect (Tech): Measured as the ratio of city expenditures on science and technology to government fiscal expenditures, following the approach of F. Wang and Wu (2021). (2) Scale Effect (People): Assessed by the ratio of the city’s resident population to the registered population, based on Germani et al. (2021). (3) Structural Effect (Stru): Evaluated as the ratio of the value added by the tertiary sector to the value added by the secondary sector, following the method of Zhou and Lin (2022).
Other Variables: Tourist Numbers (Num_tour): Measured as the sum of domestic and international tourists in the region.
Data Sources
Based on data availability and following the approach of Xu et al. (2019), this study uses panel data from 276 cities in China, including Beijing, Shanghai, Tianjin, and Chongqing, for the years 2007 to 2022. Cities with administrative adjustments during the study period, such as Chaohu, Haidong, and Sansha, were excluded, although adjustments within prefecture-level cities were retained.
Since 2007, the government has strictly enforced environmental regulations and introduced or revised multiple policies, which have had an initial impact on the tourism industry. In 2020, the COVID-19 pandemic severely disrupted global tourism. In India, lockdowns worsened air quality, posing a public health threat to the sustainability of tourism (Chaudhuri & Kumar, 2022). The pandemic intensified tourists’ guilt over tourism-related pollution, altering demand and behavior. Virtual reality tourism emerged as an effective method for protecting the environment and reducing the spread of the virus (Talwar et al., 2023). Analyzing data up to 2022 allows for the examination of how the pandemic influenced the effects of new standard policy on urban tourism in China and how the pandemic moderated these effects in different regions. Additionally, the comprehensive and accessible data from 2007 to 2022 provides a solid foundation for this research.
For data processing, following Xu et al. (2019), missing values were addressed by filling them with data from the National Economic and Social Development Statistical Bulletin for the corresponding years. For years with unavailable data, values were completed using the mean of adjacent years or linear interpolation.
Data sources include the National Bureau of Statistics’“China City Statistical Yearbook” (2008–2023; www.data.stats.gov.cn), provincial and municipal statistical yearbooks, the Ministry of Culture and Tourism website, and the National Economic and Social Development Statistical Bulletin. This resulted in a panel dataset of 16 years for 276 prefecture-level cities. Detailed variable names and statistical descriptions are provided in Table 1.
Descriptive Statistics of Variables.

Empirical Analysis
Benchmark Regression
Air Pollution Effectiveness Analysis
The effective implementation of air pollution control policies is a crucial prerequisite for this study. Table 2 illustrates that without including control variables and fixed effects, the regression coefficient for the interaction term is −9.838 and significant. When fixed effects are considered, the coefficient rises to −1.834, still significant. Including both control variables and fixed effects, the coefficient is −2.504 and remains significant. These results indicate that the new standard policy has significantly reduced air pollution in the cities.
Air Pollution Treatment Results.

Note. t-values corresponding to robust standard errors are in brackets.
***, **Significant at the 1% and 5% levels, respectively.
Table 2, Column (4), indicates that higher levels of human capital and openness to trade reduce regional air pollution, while economic development and transportation convenience increase it. Population density, government size, capital investment, and greenery levels have no significant impact on pollution. This may be because human capital and openness improve environmental awareness, introduce clean technologies, and promote economic transformation, which help reduce pollution. In contrast, economic development and transportation convenience tend to exacerbate pollution due to increased industrial activity and traffic emissions. Overall, the new standard policy is effective in reducing PM2.5 levels and addressing air pollution. It has not been adversely affected by the impacts of the COVID-19 pandemic.
Benchmark Regression Results
The baseline regression results in Table 3 indicate that the new standard policy positively impacts urban tourism development. Without control variables and fixed effects, the interaction term’s regression coefficient is 9.829 and is statistically significant. After adding control variables and fixed effects separately, the coefficient decreases to 4.039 and 3.160, respectively. When both control variables and fixed effects are included, the coefficient further declines to 2.557.
Benchmark Regression Results.

***, **Significant at the 1% and 5% levels, respectively.
Additionally, as shown in Column (4) of Table 3, local economic development and human capital levels have positively influenced tourism development, while population density and government size have had a suppressive effect. The levels of openness, capital investment, transportation convenience, and greening do not show a significant impact on tourism. This suggests that economic growth and human capital have enhanced resource utilization and service quality, whereas the negative effects of population density and government size may stem from environmental pressures and issues with administrative efficiency. Overall, the new standard policy has effectively promoted regional tourism development, supporting the view that environmental regulations can boost the tourism industry (Sun et al., 2023), and this effect has not been undermined by the impact of the COVID-19 pandemic.
Parallel Trend Test
In a difference-in-differences model, it is crucial to ensure that the treatment and control groups exhibit the same trend before policy implementation—a key assumption known as the parallel trends assumption (Ferrara et al., 2012). This study employs an event study approach to test for parallel trends by observing the dynamic trends of the treatment and control groups before and after policy implementation, thereby validating whether the parallel trends assumption holds. To conduct this test, Model (4) was constructed:
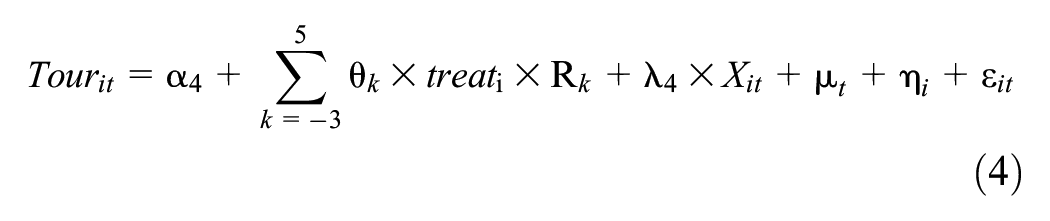
In this model, R is a dummy variable. When the difference between year t and the year of policy implementation in a given city is k, Rk is assigned a value of 1, otherwise, it is 0. All other variables remain consistent with those in Model (1). In Model (4), the primary focus is on the difference in regional tourism development between pilot cities and non-pilot cities during year k following the implementation of the new standard policy.
To simplify the data, this paper consolidates the 4 years preceding the policy implementation into a single period labeled “Period -4.” The 7 years following the policy implementation are similarly combined into “Period 7.” The year of policy implementation is used as the baseline for comparison.
The parallel trend test shown in Figure 1 indicates that the coefficient estimates for both the treatment and control groups were insignificant and small before the policy implementation, suggesting no significant differences between the two groups pre-policy. Thus, the sample passes the parallel trend test. In the year of policy implementation, the effect was not yet stable. However, 1 year later, the impact became increasingly significant, indicating a lag in the policy’s effect. This lag may be attributed to the varying degrees of local government enforcement and the accumulation of governance experience. By the seventh period, although the coefficient decreased, it remained significant. This decline could be influenced by the COVID-19 pandemic, though it did not have an overall negative impact.

Parallel trend test.
Robustness Tests
Placebo Test
To test whether the baseline regression results were influenced by unobserved variables or random factors, a placebo test was conducted. Following the method outlined by Cai et al. (2016), 123 out of 276 cities were randomly selected as a virtual treatment group, with the remaining cities serving as a virtual control group, creating a new interaction variable. Theoretically, the interaction variable for the virtual treatment group should not have a significant impact on regional tourism development, and its regression coefficient should be close to zero. If the coefficient significantly deviates from zero, it may indicate potential bias in the model. To enhance the reliability of the test, this process was repeated 500 times to obtain the kernel density distribution of the coefficients and the distribution of p-values.
Figure 2 shows that the distribution of the interaction term’s regression coefficients is close to zero and follows a normal distribution, with most p-values above .1. The actual regression coefficients significantly deviate from the distribution of the false regression coefficients, indicating that the policy effects are not coincidental. This suggests that the model is not influenced by omitted variables or random factors, confirming the robustness of the study’s conclusions.
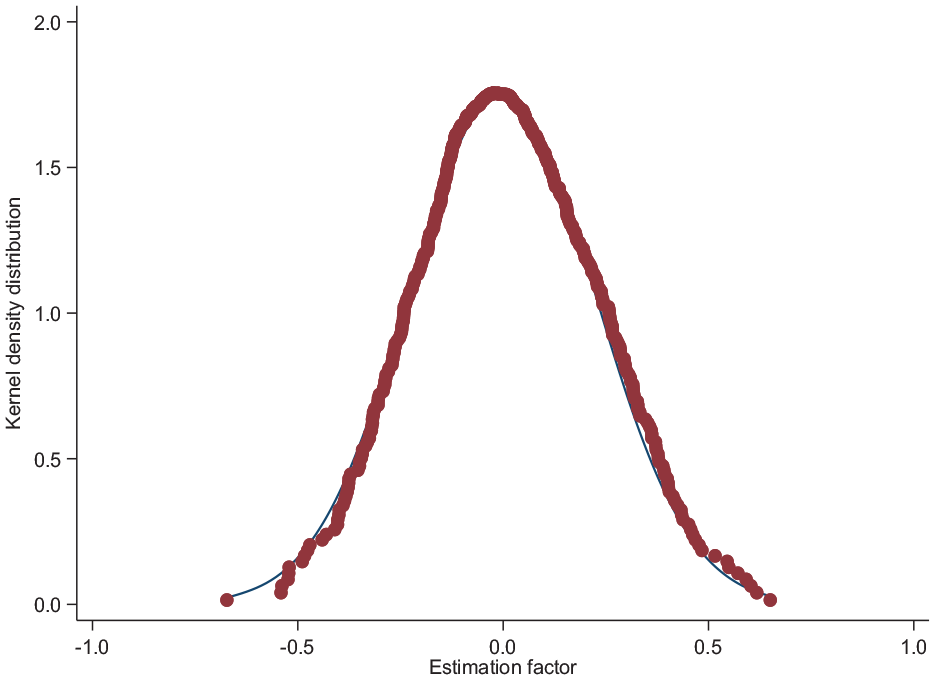
Placebo test.
PSM-DID Test
Although the new standard policy resembles a natural experiment, the selection of pilot cities was not entirely random, it was based on specific criteria, such as economic development levels, and the severity of pollution. This may introduce sample selection bias. To address this issue, this study employs a propensity score matching difference-in-differences model (PSM-DID) to match pilot cities with non-pilot cities, ensuring comparability in key characteristics between the two groups. This includes using nearest neighbor matching and caliper matching methods to reduce selection bias and mitigate endogeneity issues, thereby accurately assessing the policy’s impact.
The regression results in Table 4 demonstrate that under both matching methods, the new standard policy has significantly promoted regional tourism development. Regardless of whether control variables are included, the interaction term coefficients are consistently positive at the 1% significance level. This consistency with the baseline regression results confirms the positive impact of the new standard policy on tourism, further validating the robustness of the study’s conclusions.
PSM-DID Test.
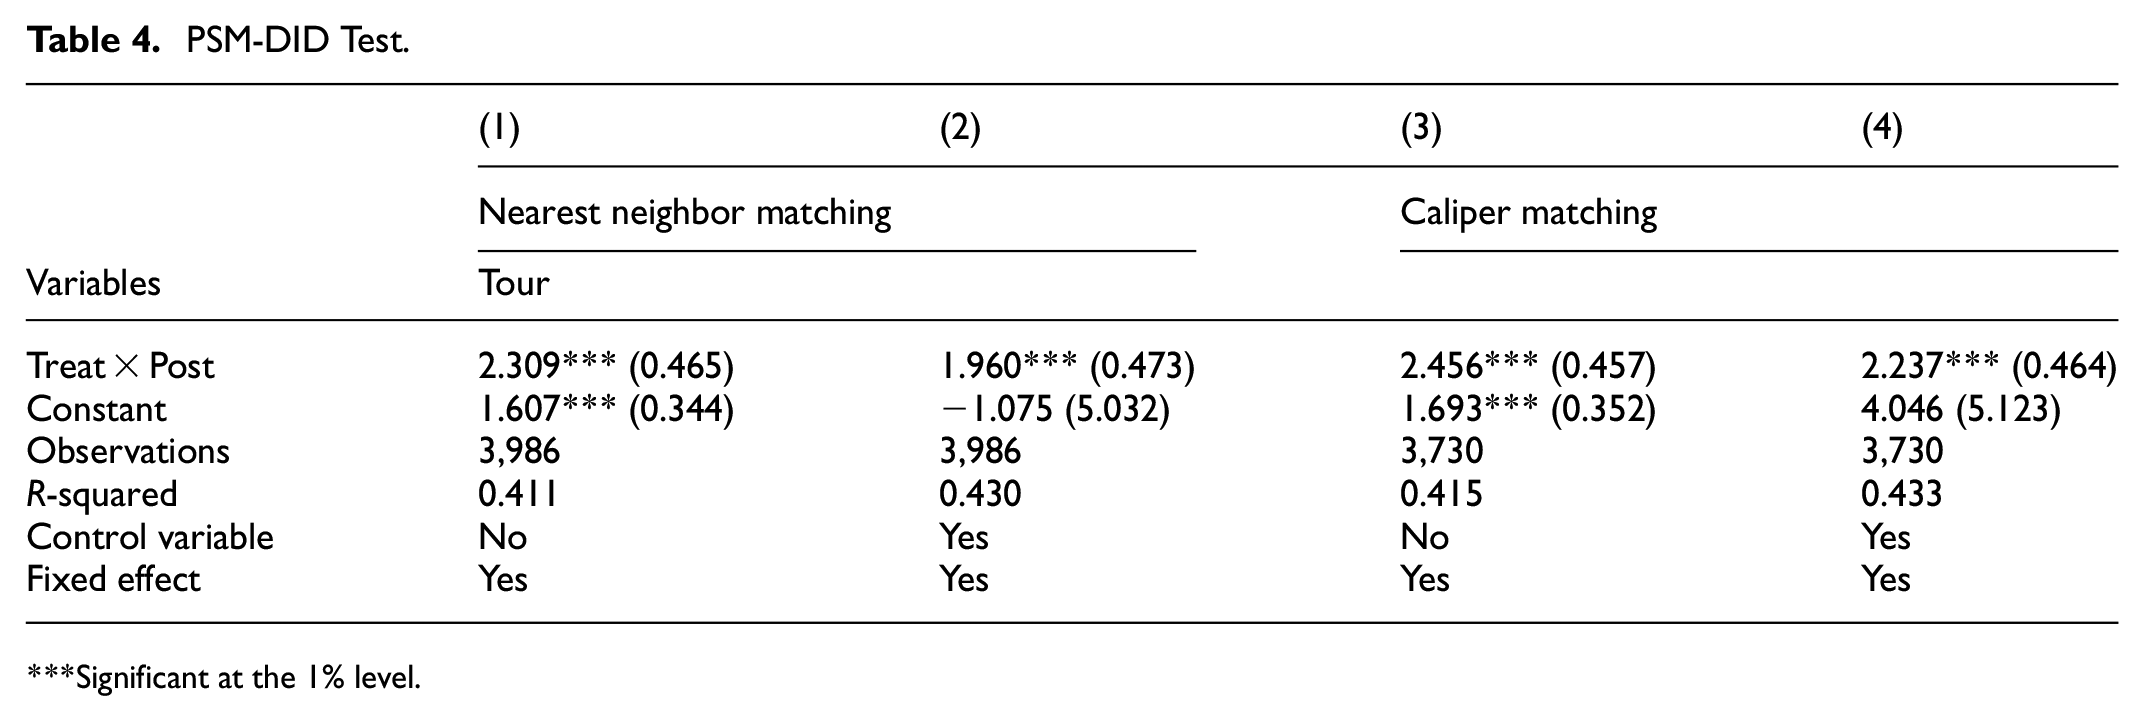
Significant at the 1% level.
Substitution of Explanatory Variables
Tourism revenue alone may not fully represent the development of the tourism industry, as factors like the number of local attractions and ticket prices can affect revenue. To mitigate any bias from the choice of indicators and to provide a clearer picture of tourism development, we replace the dependent variable from per capita tourism revenue to the total number of tourists in the region (Num_tour).
Table 5 shows that the regression coefficients for the core explanatory variables are positive and significant at the 1% level, consistent with the benchmark regression results. However, these coefficients are smaller than those in the baseline model, indicating that tourism revenue has a greater impact on tourism development than the number of tourists under the policy’s influence. This further confirms the robustness of the research findings.
Results of Analysis with Replacement of Explanatory Variables.

Significant at the 1% level.
Exclusion of Other Policy Interferences
During the study period, China underwent a crucial phase of environmental governance, which may have been influenced by other relevant policies affecting regional tourism. To ensure the robustness of the baseline regression results, we reviewed related policy documents. Specifically, we examined the “Announcement on Implementing Special Emission Limits for Air Pollutants” (2013) and the “Notice on Pilot Carbon Emission Trading” (2014), both of which are related to the new standard policy under investigation.
We included dummy variables for these two policies and their year interactions (Policy1 and Policy2) in the regression analysis. Table 6 shows that, regardless of whether control variables are considered, the coefficients for the core explanatory variables are significantly positive, consistent with the benchmark regression results. This confirms the robustness of the baseline findings.
Results of Analysis Excluding Other Policy Interferences.

Significant at the 1% level.
Sample Data Screening
To reduce the impact of outliers on the baseline regression results, we removed the top and bottom 1% and 5% of the data for the dependent variable “tour,” and then re-ran the regression for model (1).
Table 7 shows that, after removing extreme values, the coefficients of the core explanatory variables remain positive and significant at the 1% level. This consistency with the benchmark regression results further confirms the robustness of the study.
Analytical Results of Sample Data Screening.

***, **Significant at the 1% and 5% levels, respectively.
Adding Benchmark Variables
In a quasi-experimental setting using the difference-in-differences model, pilot cities ideally should be selected randomly. However, in practice, policy selection is influenced by factors such as socioeconomic development, geographic location, and political status, leading to differences between pilot and non-pilot cities that may affect model estimates. To address the non-randomness of policy selection, this study introduces interaction terms between city-specific baseline factors and time trends into Model (1), resulting in Model (5) as follows:
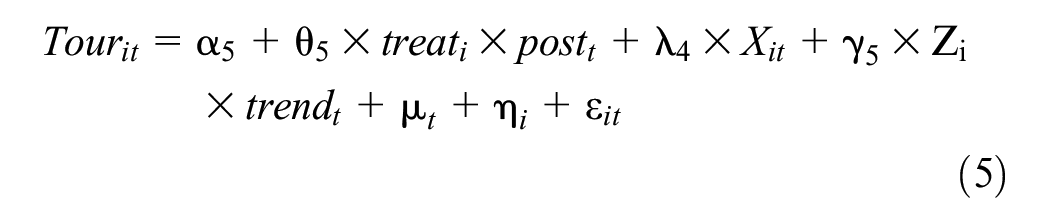
In this model, Zi represents the city-specific baseline factors, including dummy variables for whether a city is a “Two-Control Zone” pilot, a provincial capital, or a special economic zone. The variable trend denotes the time trend. All other variables remain consistent with Model (1).
Columns (1) through (4) of Table 8 present regression results for the interaction effects of “Two-Control Zone” pilot cities, provincial capitals, special economic zones, and the combination of these factors with the time trend. The findings show that all coefficients remain positive and significant at the 1% level after including these interactions. This indicates that the new standard policy significantly promotes urban tourism development, consistent with the benchmark regression results, thereby confirming the robustness of the study.
Results of the Analysis with the Addition of the Benchmark Variable.

***, **, and * indicate significant at the 1%, 5%, and 10% levels, respectively.
Adding Control Variables
To address the impact of omitted variables on the model and enhance its comprehensiveness and explanatory power, this study introduced additional control variables, including regional income level (Income), and international scale (Inte). The regression estimates were then recalculated using Model (1).
Table 9 shows that the interaction term coefficients are positive and significant at the 1% level. These results align with those of the benchmark regression (see Table 3), further confirming the robustness of the conclusions.
Results of Adding Control Variables to the Analysis.

***, **, and * indicate significant at the 1%, 5%, and 10% levels, respectively.
Mechanism Analysis
The study finds that the new standard policy significantly promotes the development of urban tourism. To analyze its impact mechanisms, this paper constructs the following model based on the theoretical framework and literature review provided earlier:


In the model, Mit represents the mechanism variables for city i in year t, including technological effects (Tech), scale effects (People), and structural effects (Stru). Other symbols are consistent with those in Model (1). The primary focus is on the significance of these three regression coefficients. If all are significantly positive, it indicates a positive impact of the policy on the tourism industry. Additionally, including the Hausman test helps assess the model’s validity and ensures it accurately reflects the policy effects.
Table 10 demonstrates that the technological effects of the new standard policy significantly boosted technological innovation, which in turn advanced the development of the tourism industry. This is likely because the policy incentivized technological advancements, facilitated the adoption of clean technologies and environmental measures, and enhanced business competitiveness. These improvements in tourism service quality supported Porter’s hypothesis that environmental regulations can achieve both economic and environmental gains through technological innovation. The results confirm Hypothesis 1 and show no negative impact from the subsequent COVID-19 pandemic. Additionally, the fixed-effects model proved to be more effective.
Analysis of Mechanisms.

***, **Significant at the 1% and 5% levels, respectively.
The scale effects reported in Table 10 indicate that the new standard policy significantly increased urban population mobility, which has spurred tourism industry growth. Increased population movement raised local consumption demand, thereby promoting tourism development. This supports the push-pull theory, which suggests that the policy’s “push” factors drive people away from their original locations while “pull” factors attract them to new areas. The results validate Hypothesis 2 and show no adverse effects from the COVID-19 pandemic. The fixed-effects model also yielded better results.
According to Table 10, the structural effects show that the new standard policy facilitated industrial structure upgrades, further boosting tourism development. This likely occurred because the policy enhanced environmental regulation, leading to the relocation of polluting enterprises and promoting the growth of the tertiary sector, particularly compared to the secondary sector. This improvement in environmental quality and regional attractiveness aligns with the “pollution haven” theory, indicating that the policy drives the exit of polluting businesses. The results support Hypothesis 3 and are unaffected by the later impact of COVID-19. Moreover, the fixed-effects model demonstrated superior performance.
Heterogeneity Analysis
Urban Location Heterogeneity
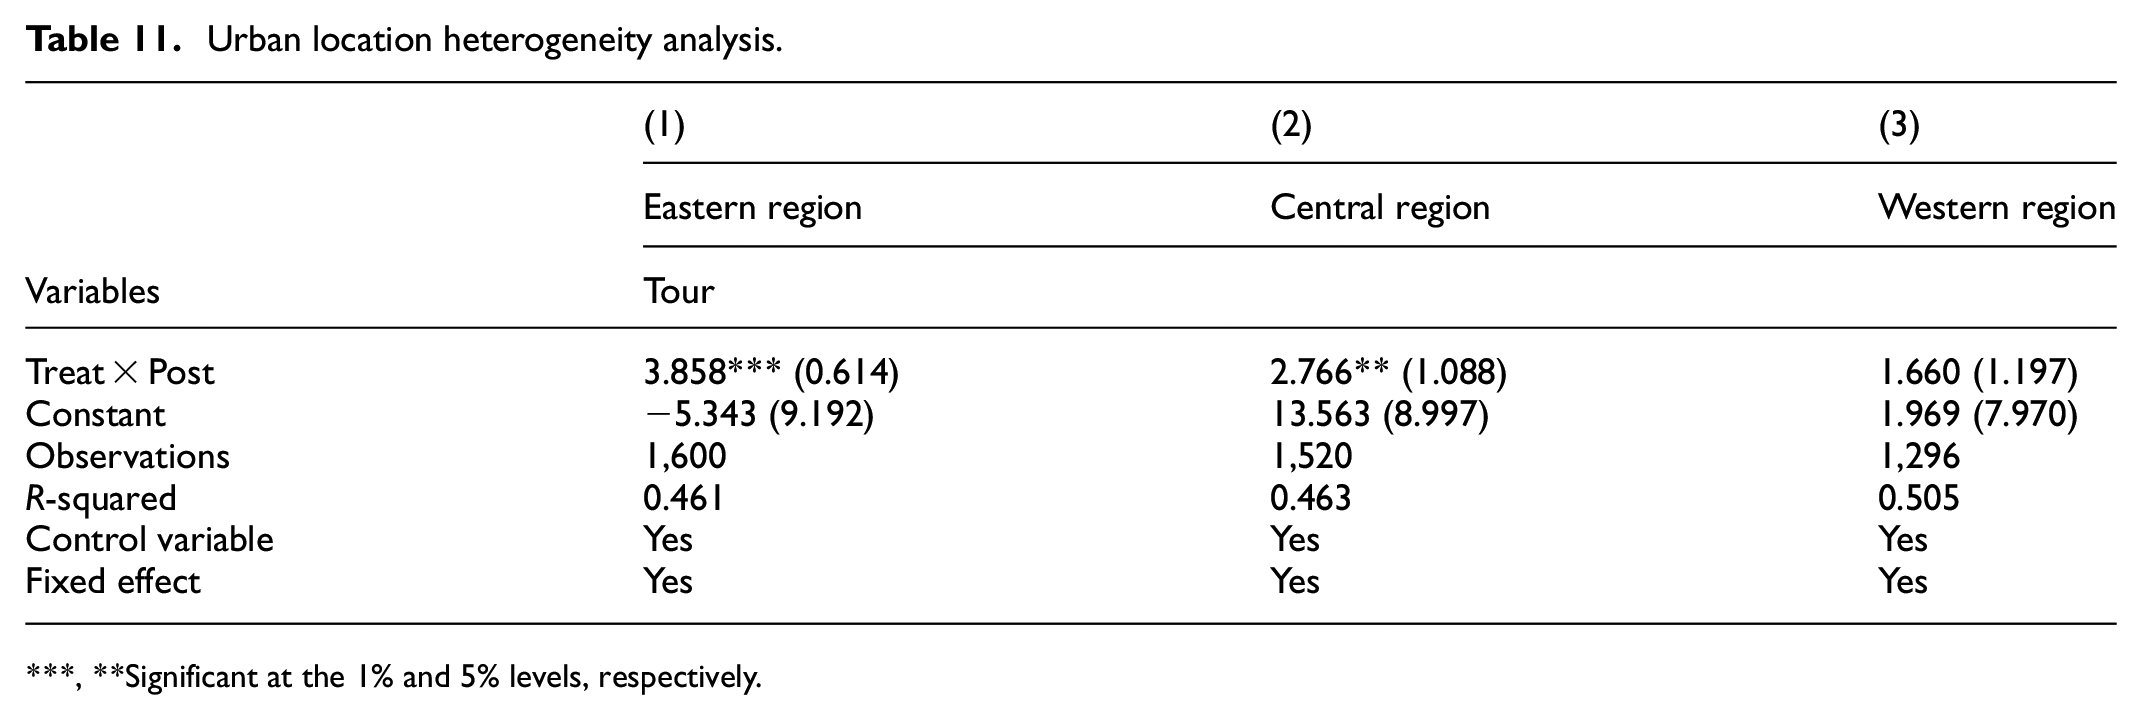
Due to variations in economic development and tourism environments across different regions, the impact of the new standard policy on tourism varies. Based on the regional classification criteria from the National Development and Reform Commission, the 276 cities were divided into three regions—Eastern, Central, and Western—for regression analysis.
Table 11 shows that the new standard policy significantly benefits tourism development in the Eastern and Central regions, with a more pronounced effect in the Eastern region. In contrast, the impact on the Western region is minimal. This disparity may be due to the Eastern and Central regions’ advanced economies, well-developed infrastructure, and mature tourism markets, which enable them to effectively adjust their industrial structures to promote a green economy. In contrast, the Western region faces challenges such as poor transportation and insufficient resource development, leading to weaker policy adaptability and implementation.
Urban location heterogeneity analysis.
***, **Significant at the 1% and 5% levels, respectively.
Urban Scale Heterogeneity
To account for the impact of city size on regional tourism development, we categorized the 276 cities based on the 2022 Urban Commercial Attraction Rankings into first-tier, second-tier, third-tier, fourth-tier, and fifth-tier cities for regression analysis.
The results, shown in Table 12, indicate that first-tier, second-tier, fourth-tier, and fifth-tier cities all experienced positive effects from the policy. First-tier cities exhibited the strongest impact, followed by fourth- and fifth-tier cities, while second-tier cities showed the weakest effect. Third-tier cities did not experience a significant impact on their tourism industry under this policy. These differences may arise because first-tier and second-tier cities benefit from higher visibility, mature infrastructure, and superior services, while fourth- and fifth-tier cities are gradually enhancing their attractiveness through active promotion and investment. In contrast, third-tier cities have less effective branding and investment, resulting in a limited impact on tourism.
Analysis of City Size Heterogeneity.

*** and * indicate significant at the 1% and 10% levels, respectively.
Regional Heterogeneity of Integrated Urban Economies
Given the significant regional differences in China, a thorough understanding of how these variations affect tourism development is essential. To explore this, we classified the 276 cities according to the National Bureau of Statistics into eight economic zones: Northeast, North Coastal, East Coastal, South Coastal, Yellow River Midstream, Yangtze River Midstream, Southwest, and Great Northwest. We then performed regression analysis for each zone.
As shown in Table 13, the new standard policy significantly promotes tourism in the Northeast, North Coastal, East Coastal, and Yellow River Midstream regions, with the East Coastal region experiencing the most substantial impact. In contrast, the South Coastal, Yangtze River Midstream, Southwest, and Great Northwest regions have not seen significant benefits from the policy. The varying impacts can be attributed to several factors: The Northeast and Yellow River Midstream regions benefit from unique cultural and natural resources, which the policy supports. The North Coastal region has well-developed infrastructure, strong policy implementation, and high demand. The East Coastal region is economically advanced, with high consumer spending power and a high level of internationalization. The South Coastal region lags in infrastructure and market development. The Yangtze River Midstream region suffers from uneven economic development. The Southwest region faces challenges due to complex terrain and poor transportation. The Great Northwest is geographically remote with restrictive natural conditions.
Analysis of Regional Heterogeneity in the City’s Integrated Economy.

Significant at the 1% level.
Heterogeneity of Urban Environmental Quality
To investigate the impact of the new standard policy on tourism development in cities with varying environmental quality, this study classifies the sample into two groups based on the annual PM2.5 concentration limit of 35 µg/m3 specified by the policy. The groups are categorized as high and low environmental quality cities, and regression analyses are conducted for each group.
Table 14 shows that the policy’s impact on tourism is not significant in high environmental quality cities. However, in cities with low environmental quality, the policy significantly boosts tourism development. This discrepancy may be due to the already strong environmental foundation in high-quality cities, where the marginal effect of the policy is minimal, and tourists are less sensitive to small changes in environmental quality. In contrast, in cities with low environmental quality, the policy’s implementation significantly improves environmental conditions, thereby fostering tourism growth.
Heterogeneity Analysis of Urban Environmental Quality.

Significant at the 1% level.
Conclusions and Policy Recommendations
This study uses the new standard policy as a quasi-natural experiment and constructs a Difference-in-Differences (DID) model to examine its impact on tourism development. The conclusions are as follows: During the study period, the new standard policy significantly promoted tourism development. Various robust checks confirm that the COVID-19 pandemic did not have a substantial overall impact on tourism. This finding contrasts with Chaudhuri and Kumar’s (2022) view that the pandemic poses a threat to tourism development in India, suggesting that China implemented measures to mitigate the pandemic’s effects. Mechanism analysis reveals that the policy indirectly fosters tourism development through technology effects, scale effects, and structural effects. The heterogeneity analysis indicates that the policy’s impact on tourism varies based on city location, scale, economic region, and environmental quality. This study offers valuable insights for the sustainable development of global tourism and provides a foundation for future research into the effects of environmental policies on tourism in different countries and regions, with a particular focus on policy implementation details and regional differences.
Based on the research, the following recommendations are proposed, particularly for developing countries: Governments at all levels should formulate and improve environmental protection regulations, coordinate interregional environmental monitoring networks, and facilitate exchanges between technology and tourism professionals, offering technical support and consulting services. National population mobility policies and management measures should be established and simplified, while policies promoting the integration of the tourism industry with other sectors should be advanced.
For the Eastern region, infrastructure, especially the tourism transportation network, should be improved. Collaborative development of smart tourism platforms and the organization of diverse tourism festivals are recommended. In the Central region, establishing regional tourism cooperation platforms, supporting innovation projects for small and medium-sized tourism enterprises, and promoting unique regional tourism resources are key strategies. The Western region should focus on environmental education and awareness campaigns, offer tax incentives to attract tourism investment, and support community involvement in the tourism industry.
First- and second-tier cities should invest in smart tourism systems to enhance service quality, strengthen international market promotion, and advance green and sustainable tourism projects. Third-tier cities should increase investment in tourism infrastructure, attract tourism management talent, and promote local tourism resources. Fourth- and fifth-tier cities should prioritize infrastructure investment, offer tax reductions and subsidies, and develop rural tourism and agricultural sightseeing.
For the Northeast region, promoting winter sports and forest tourism should be prioritized, including the organization of international ice and snow events and cultural festivals. In the North Coastal region, high-end tourism products such as luxury cruises and international conference tourism should be developed, along with fostering coordinated development in the Beijing-Tianjin-Hebei area. The East Coastal region should focus on enhancing international tourism reception capacity and building smart tourism cities. For the Yellow River Midstream region, promoting historical and cultural tourism, as well as rural tourism, is recommended. In the South Coastal region, efforts should be directed toward building tourism infrastructure and public service facilities and developing marine and resort tourism. The Middle Yangtze region should improve natural disaster emergency plans and integrate regional tourism resources for collaborative development. The Southwest region needs to enhance transportation infrastructure and develop eco-tourism and ethnic cultural experiences. For the Great Northwest region, upgrading transportation, accommodation, and other supporting facilities is essential, along with developing Silk Road cultural tourism and desert adventure tourism.
Cities with high environmental quality should focus on promoting green tourism products, improving the quality of tourism services, and strengthening environmental education. For cities with lower environmental quality, increasing efforts in environmental management and improving infrastructure construction are crucial.
This paper acknowledges the following limitations: First, while the study results indicate that the new standard policy significantly promotes tourism development, this relationship is influenced by various factors such as the quality of tourism resources, infrastructure, government governance, corporate behavior, social and cultural factors, and climate conditions, which may introduce uncertainty into the findings. Second, missing or low-quality data could introduce bias. Additionally, the external effects of neighboring cities, such as the mutual influence of pollution emissions and tourist flows, were not fully considered, which could lead to an underestimation or overestimation of the policy’s impact.
Future research will focus on: First, collecting comprehensive and high-quality data, using multiple indicators for cross-verification, and applying spatial econometric methods and spatial weight matrices to more accurately capture interregional influences. Second, analyzing the implementation data of policies across different countries, using literature reviews and expert interviews to assess the effectiveness of policies in various countries and regions, revealing best practices and feasible policy options. Third, selecting successful agricultural and sustainable tourism projects, and analyzing their contribution to local economies and sustainable development effects using environmental economics theories. This analysis will involve input-output analysis, cost-benefit analysis, and ecosystem service value assessment models to fully understand and quantify the economic effects of the new standard policy.
Footnotes
Funding
The author(s) disclosed receipt of the following financial support for the research, authorship, and/or publication of this article: The authors would like to acknowledge the financial support from “National Social Science Foundation of China” (Grant No. 21BTJ027).
Declaration of Conflicting Interests
The author(s) declared no potential conflicts of interest with respect to the research, authorship, and/or publication of this article.
Data Availability Statement
The data for this study are available on request.