
Abstract
The spatial network of the global tourism economy has evolved into an increasingly complex system. However, no study has systematically captured and compared global and continental tourism economy network. This study objectively examines the spatial network structure of the global tourism economy from global and continental perspectives, by analyzing panel data from 142 major countries during 1995 to 2019, integrating a modified gravity model and social network analysis (SNA) method. Network density and network correlation of the global tourism economy have increased over time, with the global tourism economy network exhibiting stronger network and scale dependencies compared with the continental network. However, network density varied across five continents and was ranked as Europe > Africa > Asia–Oceania > the Americas. After 2000, global tourism economy network stabilized, forming 3 to 4 subgroups. However, the diffusion and spillover effects of core areas were restricted, the spatial connections of edge areas were weak. Additionally, the increasing and stable influence of “leader” countries and the decreasing and changing control ability of “middleman” countries suggested a trend toward direct tourism partnerships. A sustainable world tourism economy network calls for a clear role positioning of dominant, controlling and intermediary countries, and corresponding connectivity paths between the regions, policy recommendations for different countries.
Keywords
Introduction
The global tourism economy has maintained a relatively high growth rate, emerging as a key driver of global economic development amid slow global economic recovery and stagnating international trade. The tourism industry has outpaced global economic growth, playing a crucial role in fostering international cooperation and development. According to the World Tourism and Travel Council, tourism accounted for 9.1% of global gross domestic product (GDP) in 2023 and is projected to contribute 11.4% of the global economy (i.e., $16 trillion) by 2034 Additionally, based on the concept of “T20” proposed in the recent years, 80% of the global tourism economy is concentrated in the top 20 countries, including the United States, China, Germany, the United Kingdom, and India. Global tourism has generally formed a “triple balance of power” pattern across Europe, the Americas, and the Asia–Pacific region. According to “Travel 2040,” a report published by a U.S.-based Internet data agency, a small number of countries, particularly China and the United States, are expected to dominate the global international tourism market over the next 15 years. Given the dual forces of global economic integration and post-pandemic economic recovery, understanding the structural patterns and development trends of the global tourism economy is crucial for guiding cross-border tourism policies and optimizing the international layout of regional tourism industry.
The global economy pattern or network refers to the external expression of the global economic structure shaped by interactions among countries or groups of countries. Its essence is the balance and distribution of economic power between major countries (Dicken, 2007; McCann & Acs, 2011). As a fundamental component of the global economy, the balance and distribution of tourism economic forces can be analyzed through the spatial relationships of the tourism economy. Relational thinking is the origin of relational economic geography (Bathelt & Glückler, 2003), with its research gradually expanding from national economies to global economic systems, giving rise to well-known theoretical concepts such as global production networks and global economic development (Wang & He, 2022). However, few studies have systematically examined large-scale spatial and temporal patterns of tourism relations. Thus, our concern about power geometry and spatial relations within the global and continental tourism economy advances relational economic geography by systematically explaining the change and migration of the tourism economy on a global scale.
As research evolves from a “place space” to a “flow space” perspective, the concept of “network” has become a new paradigm for interpreting regional spatial organization. With the integrated development of the global tourism economy and the expansion of regional cooperation strategies, connections within regional tourism economies are strengthening, forming a spatial network with multiple nodes, links and domains (Kim et al., 2021; Miguéns & Mendes, 2008). Social network analysis (SNA) is a sophisticated way to quantify the network structures of the tourism sector (Albrecht, 2013; Casanueva et al., 2014). Thus, the application of SNA in world tourism economy studies provides a better orientation to formulate effective tourism policies, address imbalances in tourism development worldwide, and achieve high-quality growth (Gan et al., 2021). This study examines 142 representative countries to systematically analyze the spatial network of tourism economy. The primary study objectives are as follows: (i) analyze the spatial network structure characteristics of the global tourism economy, identifying the roles and positions of different countries within the network; (ii) evaluate whether spatial relationships in the tourism economy differ between global and continental scales; and (iii) develop optimization strategies for the spatial network structure of the global tourism economy, providing a theoretical basis for policymakers to enhance tourism policies and promote the synergistic development of the global tourism economy.
Literature Review
Owing to the distinct characteristics of tourism activities and tourism industry, the spatial structures of tourism have been examined from both the supply and demand perspectives (Liu et al., 2017; Tsiotas et al., 2019). Consequently, research topics have diversified, covering the tourism economy, enterprises, stakeholders (Jesus & Franco, 2016; Kimbu & Ngoasong, 2013), tourism information flows (Ruan & Zhang, 2021), and tourist flows (Li et al., 2021; Stienmetz & Fesenmaier, 2015; Xu et al., 2022). Regarding the spatial network of the tourism economy, most studies have focused on spatial structural characteristics and evolution (Gan et al., 2021; Wang et al., 2018), spatial and temporal variations (Fang et al., 2012; Guo et al., 2014), influencing factors or dynamic evolution (Chen et al., 2022; Marrocco & Paci, 2013; Wu & Song, 2018), and external effects (Alexandre & Isabel, 2015; Eleftheriou & Sambracos, 2018). Compared with the spatial interpretation of other tourism demand and supply elements, global tourism economy relations result from interactions between destination and source countries, jointly influenced by geography, transportation, culture, economy, and societal factors.
Various methods have been employed to examine tourism spatial patterns, including modified gravity model, Granger causality test, spatial auto-correlation, coefficient of variation, principal component analysis and SNA. SNA has been widely used to analyze tourism structures through quantitative analysis of various relationships. Its application scale has focused on urban (Gan et al., 2021) and regional levels (Han et al., 2018; Xie et al., 2021), followed by the continental (Wang & Lu, 2021) and global level (Lozano & Gutiérrez, 2018; Yao et al., 2020). Lyócsa et al. (2019) studied the interconnectedness of changes in international tourism demand across 30 European countries, revealing that mutual interconnectedness is a typical feature of international tourism demand networks, with less developed tourism sectors exhibiting stronger interconnections with global tourism demand. Chung et al. (2020) integrated cluster analyses with SNA, demonstrating that global tourism networks have become highly consolidated over time and that reduced transaction costs (e.g., language, distance, and visa policies) are crucial in attracting international tourists. Although tourism network properties may change significantly over time (Westveld & Hoff, 2011), few tourism studies have included any quantitative analysis of longitudinal data sets using the SNA approach (Baggio & Sainaghi, 2016).
Additionally, there is no systematic explanation regarding the applicability of SNA theory to macro-tourism economy relations. Can the theory of SNA explain the network attributes of the global tourism economy? Although previous studies have not given an explicit systematic discussion, scholars have separately analyzed their applicability from the perspective of spatial differences, spatial correlation. First, spatial differences and imbalances in the tourism economy and income in various countries are affected by multiple factors. The node attribute concept in SNA promotes the exploration of individual network characteristics, aligning with the current global landscape, where a few dominant countries drive the tourism industry, as reflected in the “T20” concept. Second, the spatial connection of the tourism economy reflects the movement of tourism-related elements and serves as a key representation of the spatial attributes and interactive relationships of tourism activities, producing corresponding aggregation and spillover effects (Kim et al., 2021). Moreover, tourism increases both the probability of trade between two countries and the volume of international trade between them (Santana-Gallego et al., 2016). The practical exploration of cross-regional tourism cooperation mode (such as Belt and Road, North American Free Trade Area, etc.) also verifies the theoretical hypothesis of the spatial correlation of national tourism economy. Hence, this study combines overall and individual network analyses to reveal the spatial-temporal characteristics of the global tourism economy network based on the longitudinal network data.
Methodology
In the spatial network of tourism economy, each country serves as a “node,” while each tourism economic relation between countries represents a “edge.” Identifying the “node” and quantifying the strength of the “tie” is crucial for determining the spatial network of the global tourism economy. This study employs modified gravity model and SNA method to interpret spatial network structure of the global tourism economy from global and continental perspectives. The analytical framework is illustrated in Figure 1.

Study framework of the global tourism economy network.
Modified Gravity Model and Spatial Correlation Matrix
Gravity model in economic geography originated from Newton’s universal gravity model in classical mechanics and has been applied to examine economic linkages among regions (Reilly, 1931). In the 1960s, the model was first used in tourism research (Crampon, 1966). Given the complexity of tourism, the gravity model was subsequently modified to adapt to various research scenarios (Smith, 1989). Currently, researchers employ these modified models to measure tourism flows, economy, and attractions. This study adopts a modified gravity model to calculate the spatial correlation strength of tourism economy among countries, as follows:


Where
This study uses a modified gravity model to construct a spatial correlation matrix for national tourism economies, based on which a spatial binary relationship matrix is derived. Given the spatial variability among national tourism economies, this study uses the average value of the matrix as the critical value for defining the binary matrix. If the tourism economy correlation strength exceeds the average value, the value is assigned 1, indicating a relationship between the tourism economies of row and column countries. Conversely, the value is assigned 0, indicating no significant economic relation. This spatial binary matrix serves as a basis for analyzing the spatial correlation network of the tourism economy.
Social Network Analysis
SNA is mainly used to examine the structure and hierarchy of a network by analyzing its nodes and edges. UCINET and Gephi are the most commonly used SNA tools in social-science research. UCINET is particularly suited for handling complex, multi-relational data owing to its robust computational capabilities and broad compatibility. By contrast, Gephi is more suitable for processing dynamic big data, offering advanced visualization, and dynamic analysis features. Therefore, this study integrates both tools to analyze the spatial network structure of the global tourism economy, focusing on the overall and individual network characteristics, Gephi network indicators (Table 1), cohesive subgroups, and core–edge structure analysis.
Indicator Description of Tourism Economy Network.

Note. L is the actual bibliography of relationships contained in the network; m is the number of actors in the network; dij is the shortest path between node i and node j; ei is the number of connections existing between all adjacent nodes of the node i; epq is the total number of connected edges connecting subgroup p and subgroup q.
Overall Network Indicator
Overall network indicators include network density, association, level, and efficiency. Network density measures the sparseness of connections between individuals in a network, where higher values indicate stronger interconnections. Network association assesses the robustness of the spatial correlation network of tourism economic development, where a higher network correlation indicates a stronger network resilience and deeper international cooperation. Network level reflects the extent to which countries in the network are asymmetrically accessible, where a higher network hierarchy implies stricter network hierarchy, with a few dominant countries having a leadership role within the tourism economic network. Network efficiency measures the connectivity efficiency between countries in the spatial network of a tourism economy. A higher network efficiency corresponds to fewer connections among countries, indicating a more fragmented network that hinder cooperation and impedes the advancement of the economic development of tourism through networks.
Individual Network Indicator
Individual network indicators include degree, betweenness, and closeness centralities. Degree centrality measures an individual’s importance and influence within a network, where a higher value indicates greater significance and influence. Betweenness centrality measures an individual’s ability to act as an intermediary in a network, reflecting their capacity to coordinate and control network interactions. A higher betweenness centrality suggests a crucial position in controlling the flow of resources and information, where the individual’s absence may disrupt communication. Closeness centrality measures the degree to which individuals in a network are not controlled by others.
Cohesive Subgroup and Core-Edge Structure
Cohesive subgroup analysis is an important method in SNA used to identify the existence or potential relationships among social actors. When actors in the network are closely related, they form a subgroup, with SNA defining such a group as a condensed subgroup. If the network has a condensate group with a high density, its members are closely connected and communicate frequently for information sharing and cooperation. Core-edge structure analysis categorizes network nodes into core and edge regions based on the closeness between the nodes in the network, with nodes in the core area holding greater significance in the network.
Gephi Network Indicator
Gephi software is used for complex network visualization and network analysis to visualize and simplify the international tourism economy network. Average path length reflects the degree of separation between the individual nodes in a network. A modularity index value exceeding .44 indicates a certain degree of modularity. Alongside the average path length, the average clustering coefficient assesses the small-world effect, providing insights into node connectivity and clustering patterns.
Data Collection
Under the influence of the coronavirus disease 2019 (COVID-19), the scale of international tourism has decreased since 2020. Based on data availability, this study collects panel data from 142 countries during 1995 to 2019, categorizing them into four regions: Africa, the Americas, Asia–Oceania, and Europe (Table 2). This classification aligns with the findings of the “Global Tourism Economy Trend Report.” The Asia–Oceania region corresponds to the Asia–Pacific region. In 2019, these countries accounted for approximately 93% of the total global population, 97% of the global GDP, and 90% of the international tourism revenue. These countries serve as representative study cases, reflecting global tourism economic pattern. Data on international tourism arrivals P, international tourism revenue T, and gross national product (GNP) G for each country are obtained from the World Bank (2020). The geographical distance between countries is approximated using the distance between their capitals, obtained from the French Center d’Études Prospectives et d’Informations Internationales (CEPII) database (CEPII, 2020). The World Development Indicators (WDI) and CEPII databases, both recognized for their reliable data, are widely used in academic research. Based on the calculation results, four cross-sectional datasets from 1995, 2003, 2011, and 2019 are selected for comparative analysis in the following text.
Study Area.

Results and Discussions
Spatial Network Structure Characteristics of the Global Tourism Economy
Overall Network Characteristics
Network density of the global tourism economy fluctuated significantly, rising from .031 to .144 between 1995 and 2019. These fluctuations indicated that major countries had more frequent tourism economic ties and closer cooperation owing to the globalization of tourism activities (Figure 2a). However, the network density remained below the medium level of .5, suggesting considerable room for improvement in international tourism cooperation and exchanges (Yao et al., 2020). Network association of the global tourism economy increased from .38 to .73 during 1995 to 2019 (Figure 2b), indicating improved network accessibility and robustness alongside stronger spatial connectivity and spillover effects among countries. Network efficiency declined from .89 to .72 (Figure 2c), which indicated fewer redundant relationships in the spatial network of the tourism economy, while two-way spillover relationships increased, ultimately stabilizing the spatial network. Finally, network level was generally at a relatively high level but showed a fluctuating downward trend from .74 to .56 (Figure 2d), indicating an obvious but weakening hierarchical structure in the spatial network of the tourism economy. This shift was conducive to the synergistic development of the global tourism economy.

Overall network characteristics of the global tourism economy, 1995 to 2019. (a) Network density, (b) network association, (c) network efficiency, and (d) network level.
Individual Network Characteristics
The top 10 countries in the centrality ranking of the global tourism economy are listed in Table 3. Regardless of the type of centrality degree indicator, a clear upward trend was observed over the past decades, reflecting increasing importance and influence of major nodes/countries to other countries and networks of the global tourism economy.
Top 10 Countries by Centrality Indicator of the Global Tourism Economy Network.
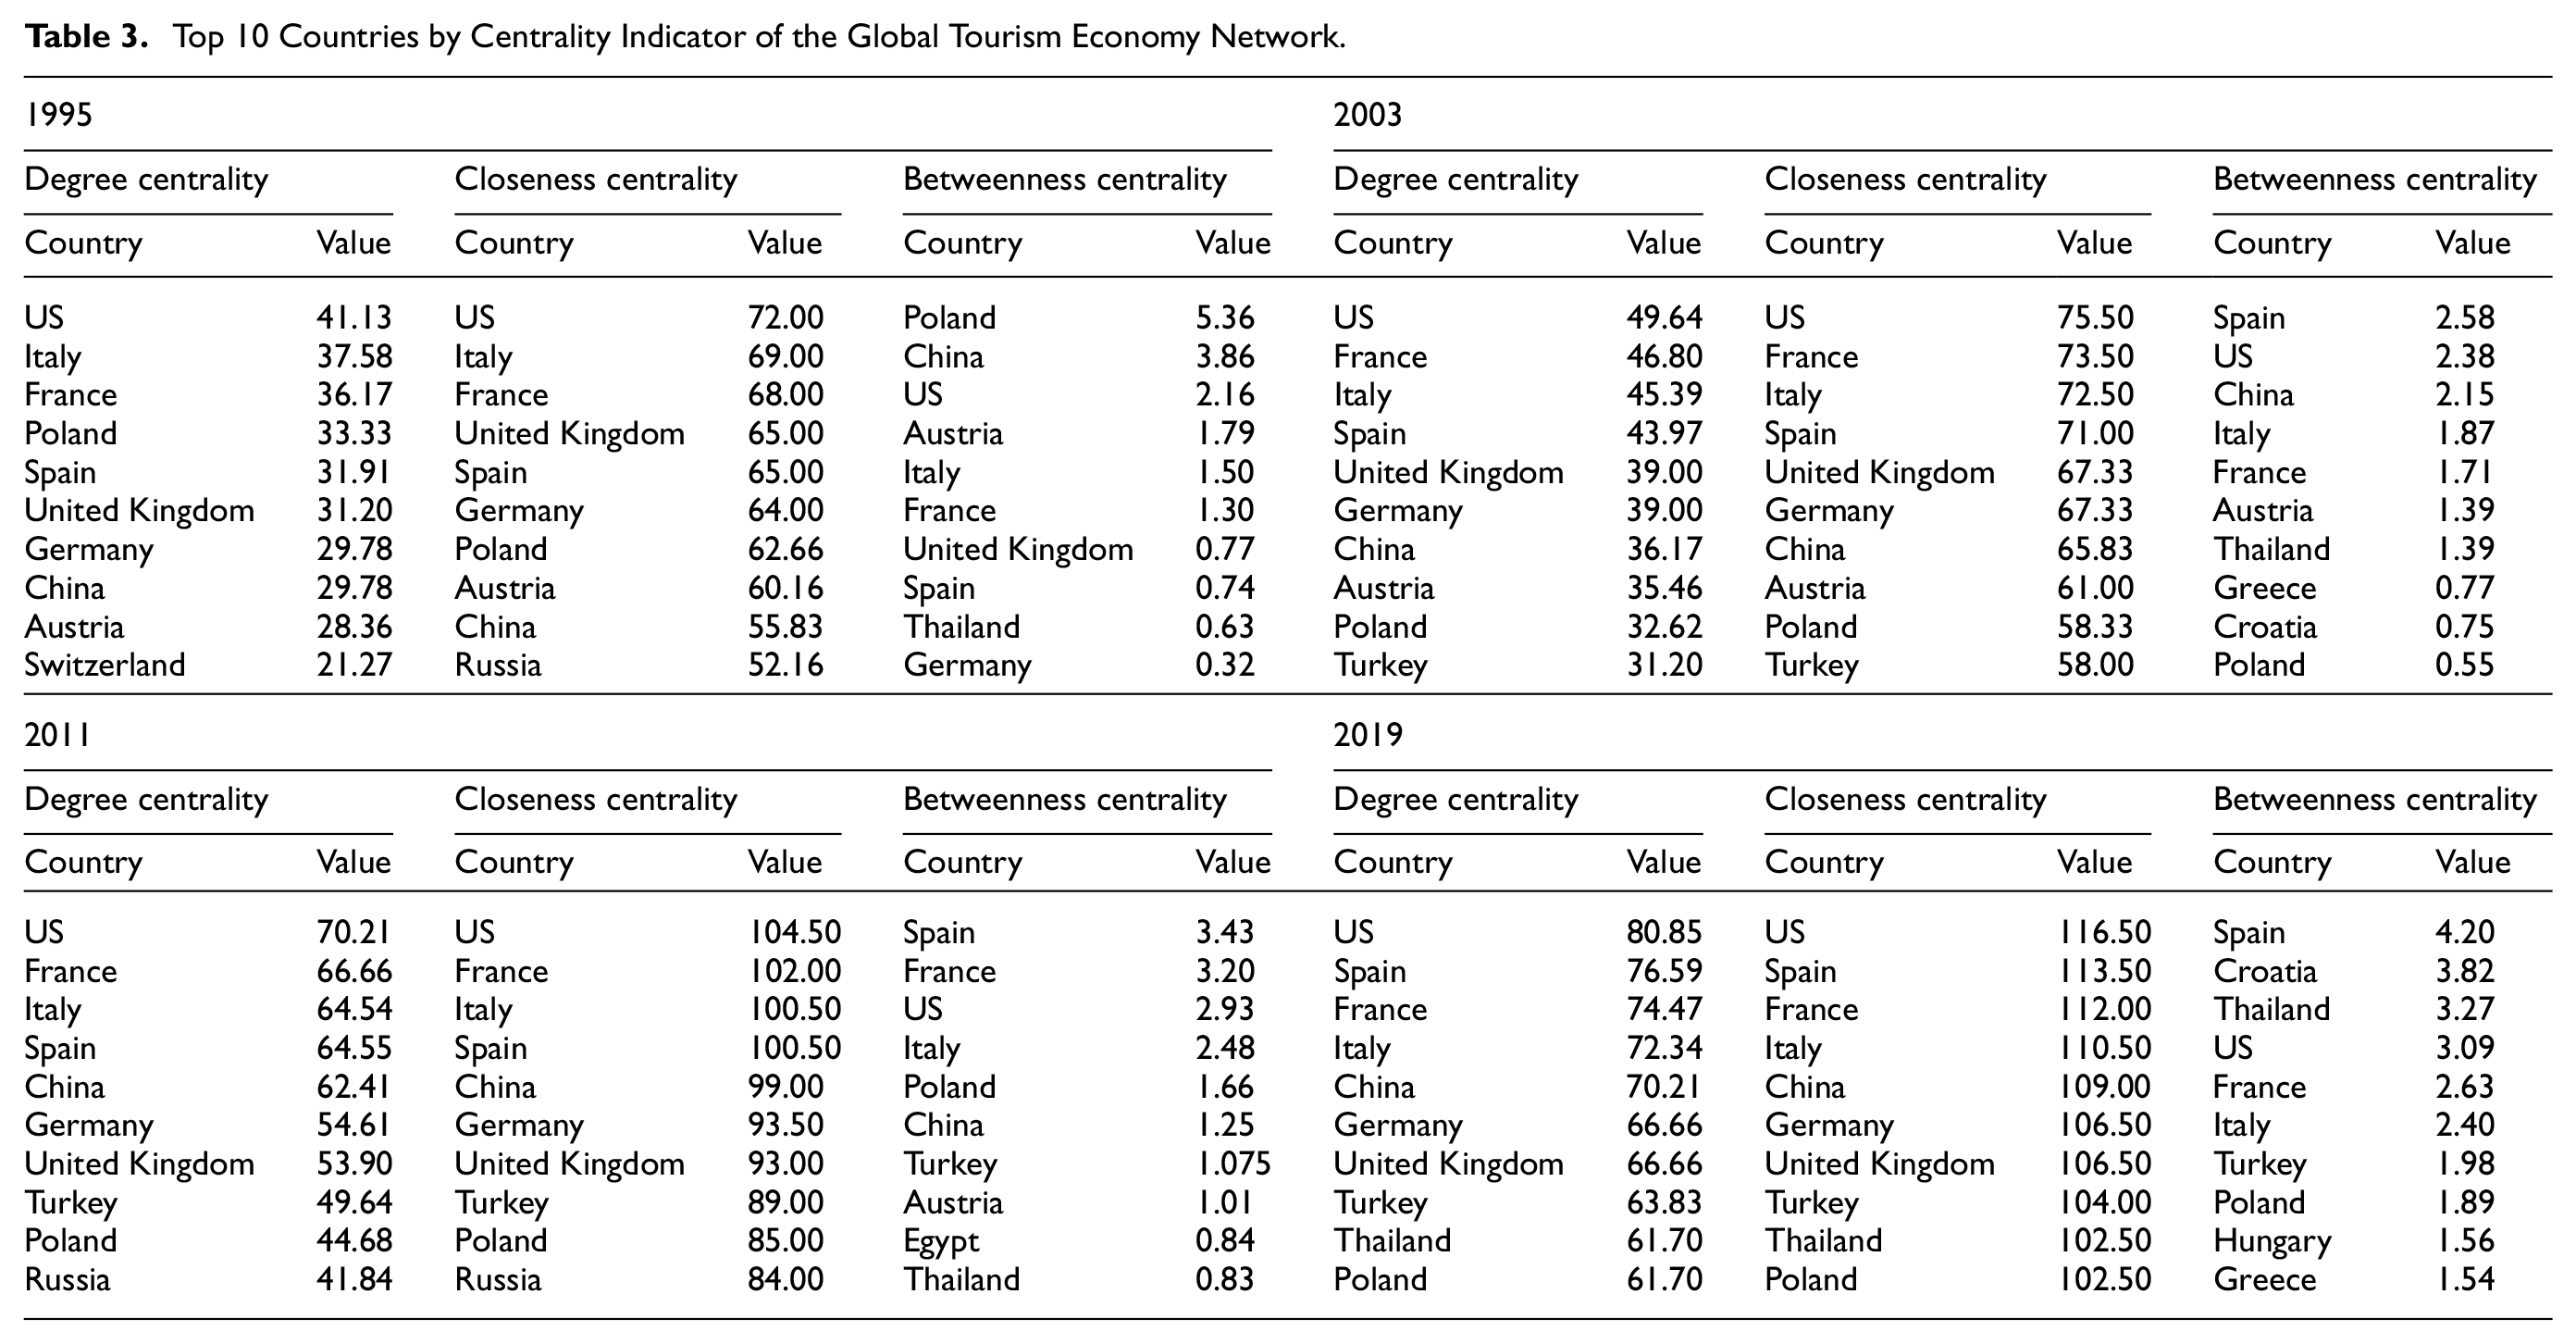
Regarding degree centrality, the top 10 countries in 2019 were the United States, Spain, France, Italy, China, Germany, the United Kingdom, Turkey, Thailand, and Poland, respectively. These countries were central in tourism economy network, establishing close tourism economy ties with multiple countries and having strong polarization and diffusion effects on neighboring countries. This ranking remained largely unchanged between 1995 and 2019 and closely aligned with the “T20” countries, including the world’s largest economy (the United States), traditional tourism powers (Thailand, Italy), manufacturing power (Germany) and emerging markets (China). According to the summary of the development trend of tourism income, countries can be classified into four groups: (i) low-speed and steady growth, exemplified by the United States; (ii) slow growth, represented by China; (iii) alternating positive and negative growth, represented by Germany, Britain, and Italy; and (iv) revenue fluctuation, exemplified by France, Spain, Turkey, and Russia.
Regarding closeness centrality, the United States, Italy, France, the United Kingdom, Spain, Germany, Poland, Austria, China, Turkey, Russia, and Thailand were the top 10 countries in 2019. These countries were more likely to be associated with other countries in the spatial network of the tourism economy; however, they took active positions in the network, and their tourism economies were not “controlled” by other countries. The countries with the highest degree centrality were comparable to those with the highest closeness centrality, indicating that the “leader” control capacity of the tourism economy spatial network gradually increased. Due to their superior locations, highly developed social economies, and abundant tourism resources, these countries have strong connectivity in the global tourism economy network and can easily access resources and information, resulting in an important nodal core position and core control ability. Conversely, countries with the lowest closeness centrality, including Uganda, Niger, Uruguay, Saint Vincent, the Grenadines, Vanuatu, Samoa and Yemen, tend to be economically disadvantaged. Consequently, they were more susceptible to external control in the tourism trade and occupied marginal position in the network.
Regarding betweenness centrality, the top 10 countries in 2019 were Poland, Spain, China, the United States, Austria, Italy, France, the United Kingdom, Thailand, and Spain, respectively. These countries became the indispensable “mediums” in the spatial network of the tourism economy, playing an intermediary role. However, the sum of betweenness centrality of the top 10 countries decreased from 95.11% in 1995 to 65.89% in 2019, indicating a weakened role of intermediaries and an increase in direct tourism cooperation between countries. By contrast, the betweenness centrality of some countries had a value of 0; for example, Uganda, Ukraine, Uruguay, Iceland, Vietnam (VIN), Vanuatu, Samoa, Yemen, South Africa, and Zambia acted as marginalized individuals and were controlled and dominated by other countries regarding the tourism economy. The slowly developing tourism industry in these countries and limited autonomy in tourism cooperation highlight the need for strategies to enhance their participation in global tourism networks.
Core-Edge Structure
The number of countries in the core zone increased from 27 in 1995 to 48 in 2019, with both the core and edge nodes exhibiting clear clustering characteristics (Figure 3 and Table 4). Internal network densities of both core (.632 in 1995 to .772 in 2019) and marginal regions (.102 in 1995 to .227 in 2019) in the spatial network of the global tourism economy have gradually increased. However, the network density in the marginal area was significantly lower than that in the core area, indicating that tourism economies in these regions were weakly connected. Therefore, strengthening spatial linkages among these countries is essential. The network densities of the core-to-marginal (.014 in 1995 to .042 in 2019) and marginal-to-core regions (.102 in 1995 to .227 in 2019) both showed an relative low but increasing trend, indicating that the interconnection between the core and edge areas was enhanced by the diffusion effect of core nodes. Overall, the diffusion and spillover effects of core areas are constrained, while edge areas exhibit weak spatial connectivity, necessitating further optimization and enhancement of the global tourism spatial network.
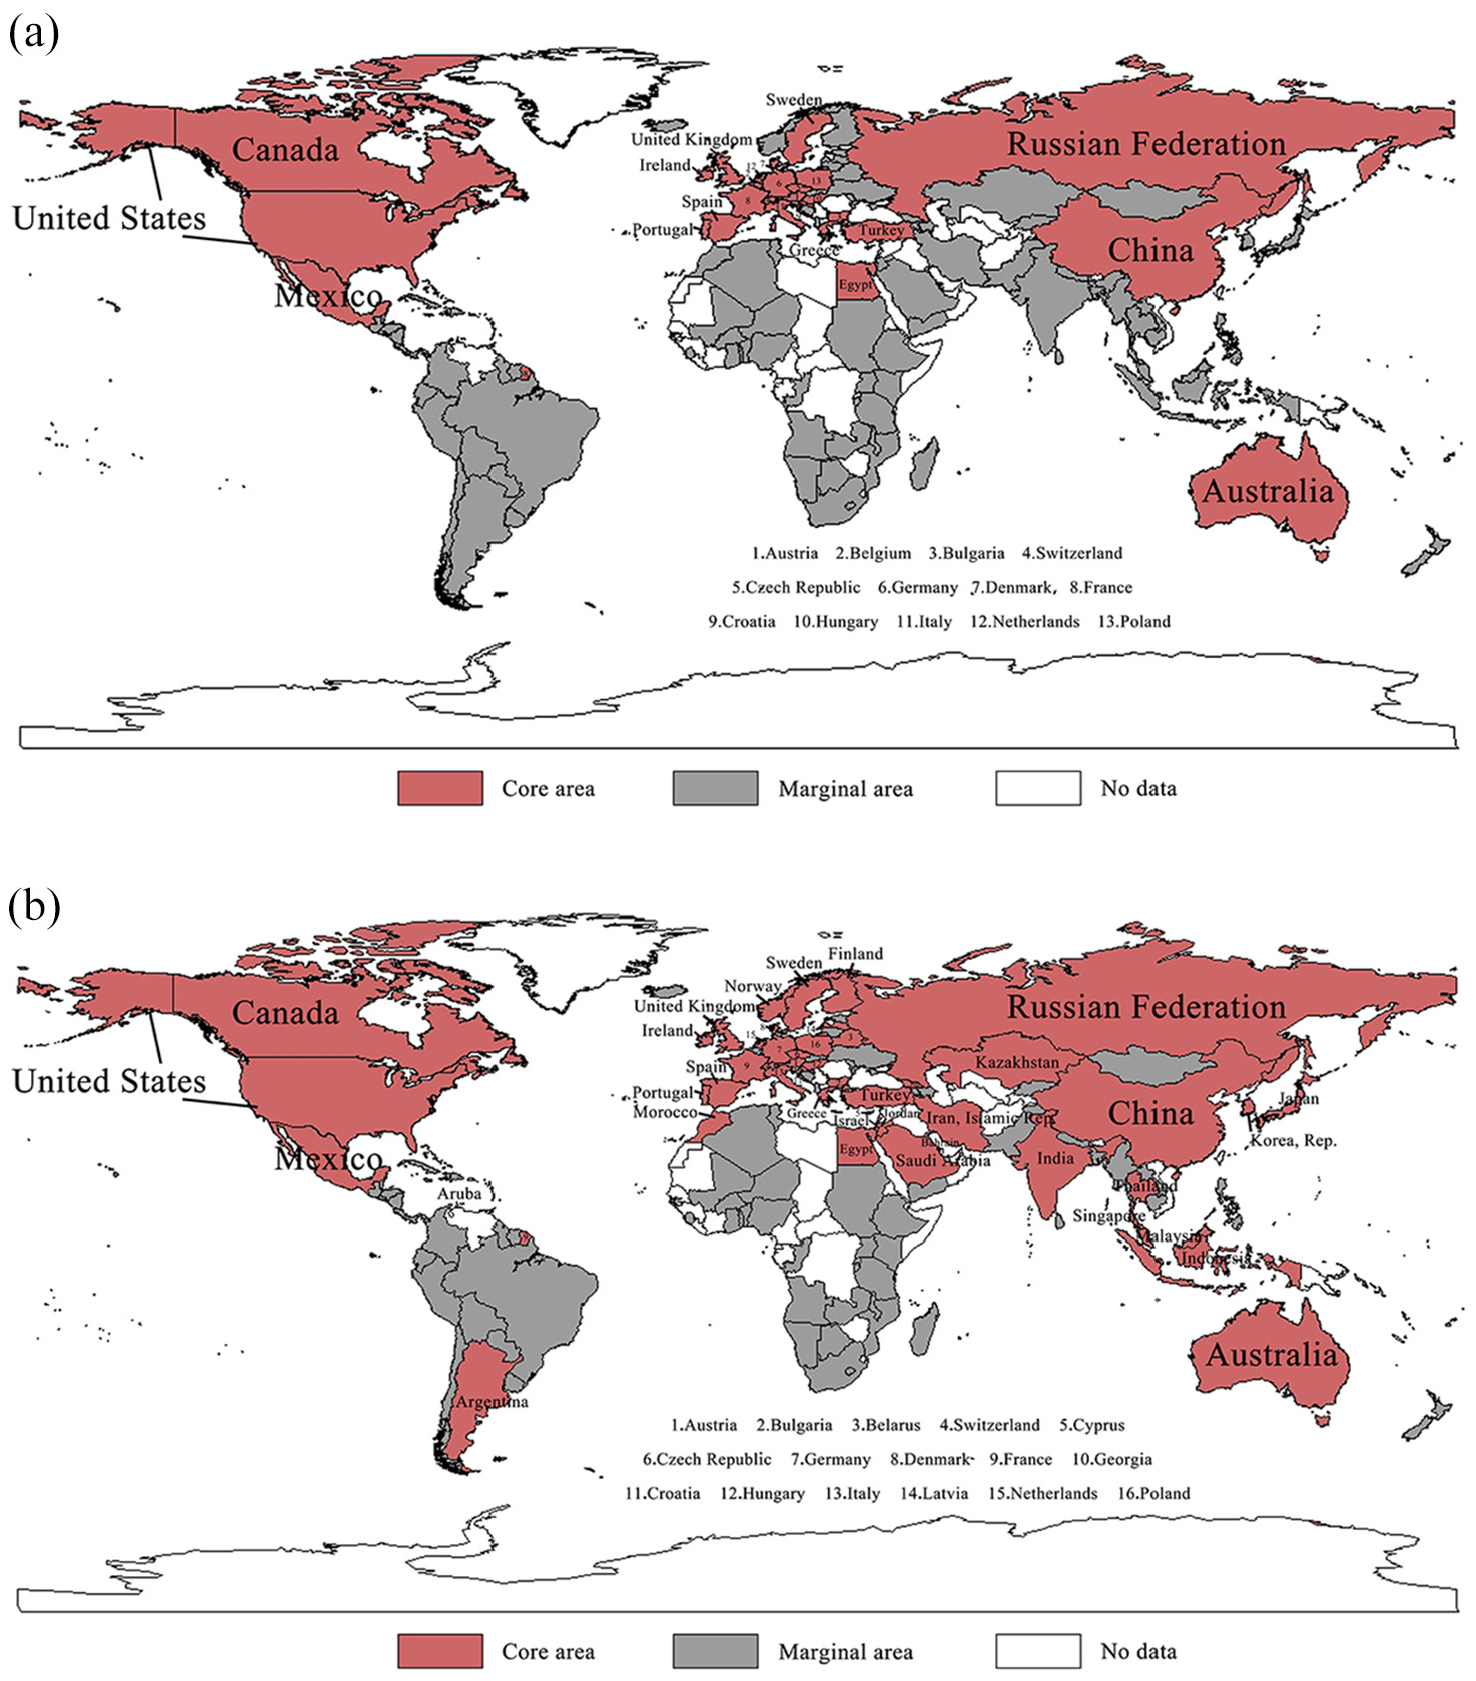
Core-edge distribution in (a) 1995 and (b) 2019. Red region represents the core area, while gray region represents the marginal area.
Core-Edge Density Matrix of the Global Tourism Economy Network.

Countries in the core area can be attributed to several factors. First, Europe and North America are the most internationally competitive regions in the global tourism economy, forming highly clustered core nodes in the tourism network (Shao et al., 2020). Second, countries located at the intersection of Asia, Europe, and Africa, such as, Saudi Arabia, Turkey, Israel, Georgia, Egypt, Morocco, Bahrain, Cyprus, and Iran, serve as core nodes owing to their unique geographical locations. Third, emerging economies, particularly those with favorable policies and a large population, also occupy core positions, for example, the BRICS countries–China and India. China has strengthened its international tourism cooperations following the implementation of the “Belt and Road” strategy (Shymanskyi et al., 2023; Zhu et al., 2022). Finally, countries with resource or market advantages in their respective regions have the potential to develop into core areas, for example, Australia, Southeast Asia (Indonesia, Malaysia, Singapore, and Thailand). Japan and South Korea.
Spatial Network Structure Characteristics of the Continental Tourism Economy
Overall Network Characteristics
According to the Gephi network in Table 5, both the number of nodes and edges showed an upward trend, reflecting a gradual increase in countries’ participation in international tourism development over the past 25 years. The number of participating countries in international tourism increased from 88 in 1995 to 121 in 2019, while the number of edges increased significantly from 490 in 1995 to 2138 in 2019. Network diameter fluctuated between 3 and 4, indicating that the number of countries involved in the middle of the longest correlation chain of the network maintained in the range of 3 to 4, each serving as a bridge node. Average path length decreased from 2.15 in 1995 to 1.73 in 2019, which indicates that, on average, each linkage chain passed through 1.7 to 2.2 intermediary countries. The global tourism economy network exhibits characteristics of a “small-world” model, with its high average clustering coefficient around .82 to .87 and low average path length (decreasing from 2.15 to 1.73) over time. “Small-world” networks are characterized by widespread weak ties between nodes; thus, measures can be taken to reduce the “distance” or change the number of edges to improve the efficiency of information transmission and promote the development of the subgroup/community (Watts & Strogatz, 1998).
Gephi Network Indicator of the Global Tourism Economy Network, 1995 to 2019.

In the Gephi network, each country in the four continental regions is represented by a node. The color of a node at the global scale represents different subgroups/communities (Figure 4), whereas the color of node at the continental scale represents the degree weight of each country (Figure 5). Node size at both scales is directly proportional to the degree value of each country. The number of subgroups decreased from 7 in 1995 to 3 in 2003 and 4 in 2019, hence, the number of countries in each subgroup has increased. However, the global tourism economy network was weakly partitioned into communities, as modularity index decreasing from .173 to .123 below the .6 threshold for significant community structure (Newman & Girvan, 2004). Economic scale, political resources, knowledge capital, and air quality are important factors that influence subgroup development (Geng et al., 2021). Network proximity, geographical location, and historical bases also profoundly affect the spatial patterns of subgroups. Selective links and path dependence are dynamic mechanisms of subgroup development (Sheng et al., 2019). After 2000, China’s accession to the World Trade Organization reshaped the global pattern. Although the scale of the tourism economy before 2000 was not comparable to that after 2000, a change in the network characteristics can be observed in the evolution of the international pattern. The subgroups have evolved more regularly over time, and the tourism-economy linkages between countries are less affected by geographical location. Countries rich in tourism resources have significant advantages, forming sporadic networks.

Visualization network of the global tourism economy in (a) 1995, (b) 2003, (c) 2011, and (d) 2019. The color division of node represents different subgroups/communities. The size of node represents the degree value of the country.

Visualization network of the continental tourism economy in 2019. The color and size of node represent the degree value of the country. (a) Africa, (b) Americas, (c) Asia–Oceania, and (d) Europe.
Compared with the continental network (Table 6), the number of global tourism-economic ties (2,138 edges) was significantly higher than the sum of the four continental regions (736 edges). Additionally, intra-continental interactions remained limited, with countries exerting relatively weak influence in their regions (Ma et al., 2021). Network density within the five continents also gradually strengthened, showing that tourism-economic linkages between countries gradually developed in a multidirectional, dense, and deepening direction. In 2019, the Europe network showed the highest average degree (14.8) and network density (.435), indicating that European countries have the highest degree of tourism-economic synergies and the most frequent tourism economic activities. By contrast, the Americas network had the lowest average degree (8.29) and network density (.251), indicating that the tourism economy of the countries in the Americas was less connected and synergistic, and that there was a need to further strengthen the connection of tourism development in each country.
Gephi Network Indicator of the Continental Tourism Economy Network in 2019.

Individual Network Characteristics
According to the centrality ranking, the top countries play increasingly prominent roles in continental-scale network (Figure 6).

Top three countries by centrality indicator of the continental tourism economy network. The size of the box represents the centrality value of the country. (a) Africa, (b) Americas, (c) Asia–Oceania, and (d) Europe.
In the Europe network, France, Italy, and Germany ranked as the top three countries of both degree centrality and closeness centrality during 1995 to 2019. Similarly, in the Americas network, the United States, Mexico, and Canada ranked as the top three countries of both degree centrality and closeness centrality during the same period. These countries have long become the core nodes of regional networks in developed countries and play a stable controlling role. Their strong connectivity enables them to engage easily with other countries in the tourism economy network while maintaining an active position and a high autonomy. In the Asia–Oceania network, China, Indonesia, and Thailand were the “leader” iwith the highest degree centrality in 1995, while China, India, Thailand became the “leader” in the network with the highest degree centrality in 2019. Meanwhile, the top three countries of closeness centrality changed from China, Japan, and Thailand in 1995 to China, India, and Thailand in 2019, indicating the evolution of emerging economies such as India into core forces in regional markets.
Compared with degree centrality and closeness centrality, the ranking of betweenness centrality within the five continents presented a more obvious difference during 1995 to 2019. In the Europe network, Italy, France, and Poland ranked as the top three countries for betweenness centrality in 1995, whereas France, Austria, and Poland ranked as the top three countries for betweenness centrality in 2019. In the Americas network, the United States, Mexico, and Canada ranked as the top three countries in degree centrality in 1995, whereas Mexico, Dominica, and the United States ranked as the top three countries in betweenness centrality in 2019. In the Asia–Oceania network, China, Thailand, and Indonesia ranked as the top three countries in terms of betweenness centrality in 1995, whereas Thailand, Saudi Arabia, and China ranked as the top three countries in terms of betweenness centrality in 2019. In the Africa network, Egypt, South African, and Tunisia ranked as the top three countries for degree centrality in 1995, while Morocco, South Africa, and Tunisia ranked as the top three countries for betweenness centrality in 2019. These countries are indispensable intermediaries and bridges in spatial networks of the tourism economy. Although the countries like Austria, the Dominican Republic, Saudi Arabia, and Tunisia are not traditional tourism powers, they play an important intermediary role in the tourism economic network. Their removal could disrupt information transmission, highlighting the emergence of a structured hierarchy of dominant, controlling, and intermediary countries in the regional tourism cooperation network. Countries should play a different role in international tourism cooperation based on their network positions.
Conclusions and Implications
This study adopts the modified gravity model and SNA method to examine the spatial network structure of world tourism economy from 1995 to 2019 from both global and continental perspectives. The following conclusions are drawn: (i) Network density and network correlation of world tourism economy showed an upward trend, while network level and network efficiency showed a downward trend over the past 25 years, indicating that international tourism cooperation evolved toward coordination and integration while the spatial network stabilized. (ii) The individual characteristics of the spatial network structure of world tourism economy showed that the role of the “leader” countries remained stable (including the world’s largest economy [the United States], traditional tourism powers [Thailand, Italy], manufacturing power [Germany] and emerging economies [China]), and the role of the “intermediary” changed over time. The control ability of the “leader” gradually increased, the control ability of the “middleman” gradually decreased, and the trend of direct cooperation between countries became more obvious. (iii) The spatial network of the global tourism economy exhibited a distinct core-edge spatial differentiation pattern. However, the diffusion and spillover effects of the core areas were restricted, while the spatial connections of the edge areas were weak. The number of subgroups decreased from 7 in 1995 to 3 in 2003 and 4 in 2019, with their evolution being more regular over time. (iv) The spatial network of the global tourism economy had more evident network and scale-dependent characteristics than the continental scale. The number and average degree of tourism-economic links were significantly higher than the sum of the four regions. Intercontinental tourism has become an important aspect of international tourism. (v) There were differences in the spatial network structure of the tourism economy across the five continents. Network density within the five continents was ranked as Europe > Africa > Asia–Oceania > the Americas. Regarding centrality, China, India, and Thailand have been the “leader” in the Asian region; France, Italy and Germany dominated the spatial network of the tourism economy in the European region; South Africa and Egypt dominated in the African region; and the United States, Canada and Mexico dominated the spatial network of the tourism economy in the American region. Additionally, these “leader” countries often function as “medium” within the spatial network of the tourism economy. However, emerging countries are playing an important intermediary role in the tourism economic network, suggesting an evolving division of roles within regional tourism cooperation networks, including dominant, controlling and intermediary countries.
Based on the above results, the spatial network structure of world tourism economy provides a theoretical basis and reference for tourism policy formulation and the coordinated development of the international tourism development. (i) In order to maintain the stabling and consolidated network, the cross-border and intercontinental tourism organization and cooperation are necessary to find the connectivity paths between the continents, for example, establishing a global visa-free mechanism. In particular, the leading countries should actively undertake the responsibility for global tourism development by innovating the tourism collaboration mechanism and contributing to the construction of global tourism community. The formal signing and implementation of the Regional Comprehensive Economic Partnership (RCEP) in 2020 has created long-term benefits for international tourism exchange and cooperation, including 10 ASEAN countries and China, Japan, South Korea, Australia and New Zealand. As the world’s largest trade agreement, RCEP will play a profound role in reshaping the global tourism pattern and promote the formation of the world’s largest tourism economic community. (ii) It is necessary to define the position of the major country in the network and achieve balanced development of the tourism economy. Countries in the core area of the spatial network structure of world tourism economy should play a leading and driving role, for example, by establishing cross-border tourism cooperation zones, leading international cooperation platforms, increasing tourism economic assistance to peripheral countries. As nodes of economic, political, and transportation networks, core cities of major countries should effectively organize, coordinate and implement more inclusive and collaborative tourism strategies. Simultaneously, with the opening of national borders, competitive tourist cities are seeking more transnational cooperation and extending tourism routes to develop a safe “travel corridor” and “tourism bubble” through regional cooperation. Conversely, countries in the periphery must strengthen tourism cooperation with core countries by transforming and upgrading their tourism industry and obtaining international tourists, capital, and technology from core countries to improve their network position. (iii) Addressing the main factors affecting the spatial network of the tourism economy is essential for promoting deeper tourism cooperation. First, differentiated cooperation strategies should be developed according to geographical distance, initially strengthening cooperation with neighboring countries’ tourism industries and gradually extending to other countries and regions. For example, complementarity with neighboring countries can be achieved by developing tourism resources, improving tourism service facilities such as accommodation and entertainment, and strengthening the construction of modern transportation networks. Second, establishing bilateral and multilateral agreements promotes the coordination of tourism standards and policies among other countries, providing a conducive environment for international tourism cooperation. Finally, innovating tourism products and developing more tourism formats based on the cultural characteristics of their countries are necessary to meet the increasingly diversified and personalized tourism needs of tourists.
Limitations and Future Research Directions
Our study is the first international tourism study to adopt a SNA approach that quantifies the complex structure of world tourism economy network from the macro and long time scale over time, however, several limitations must be considered when drawing conclusions from the reported results. Additionally, what follows includes possible directions for future research. (i) This study provides a descriptive and explanatory analysis of the characteristics of world tourism economy network using historical data. However, the prediction of future trend in the network is insufficient, and the theoretical and influencing mechanisms of its formation require further exploration. (ii) The essence of tourism involves spatial mobility, and the tourism economy includes the sum of various economic activities and relations in the spatial movement process. Therefore, further research is needed to determine whether the tourism economy and tourism flow networks are correlated. Future studies should adopt multidimensional and multilevel approaches to analyze various networks created through international tourism activities.
Footnotes
Acknowledgements
The authors express their grateful thanks to the editor and the reviewers for their constructive comments and suggestions that helped to shape this article.
Ethical Considerations
This article does not contain any studies with human participants or animals performed by any of the authors.
Funding
The author(s) disclosed receipt of the following financial support for the research, authorship, and/or publication of this article: This work was supported by the National Social Science Fund of China under Grant 24CGL096.
Declaration of Conflicting Interests
The author(s) declared no potential conflicts of interest with respect to the research, authorship, and/or publication of this article.
Data Availability Statement
Data sharing not applicable to this article as no datasets were generated or analyzed during the current study.